U.S. Apartment Market Continues to Post Small but Consistent Gains


The U.S. apartment market has seen occupancy and rents increase slightly every month in 2026.
As of May, U.S. occupancy landed at 95.5%, after steadily climbing for five months straight, according to data from RealPage Market Analytics. Apartment occupancy increased 30 basis points (bps) in May and has climbed a total of 90 bps since the end of 2025. This followed a steady decline throughout the back half of 2025.
Even with five months of growth, however, the most recent showing remained 20 bps below the rate from May 2025, when U.S. occupancy was at its peak.
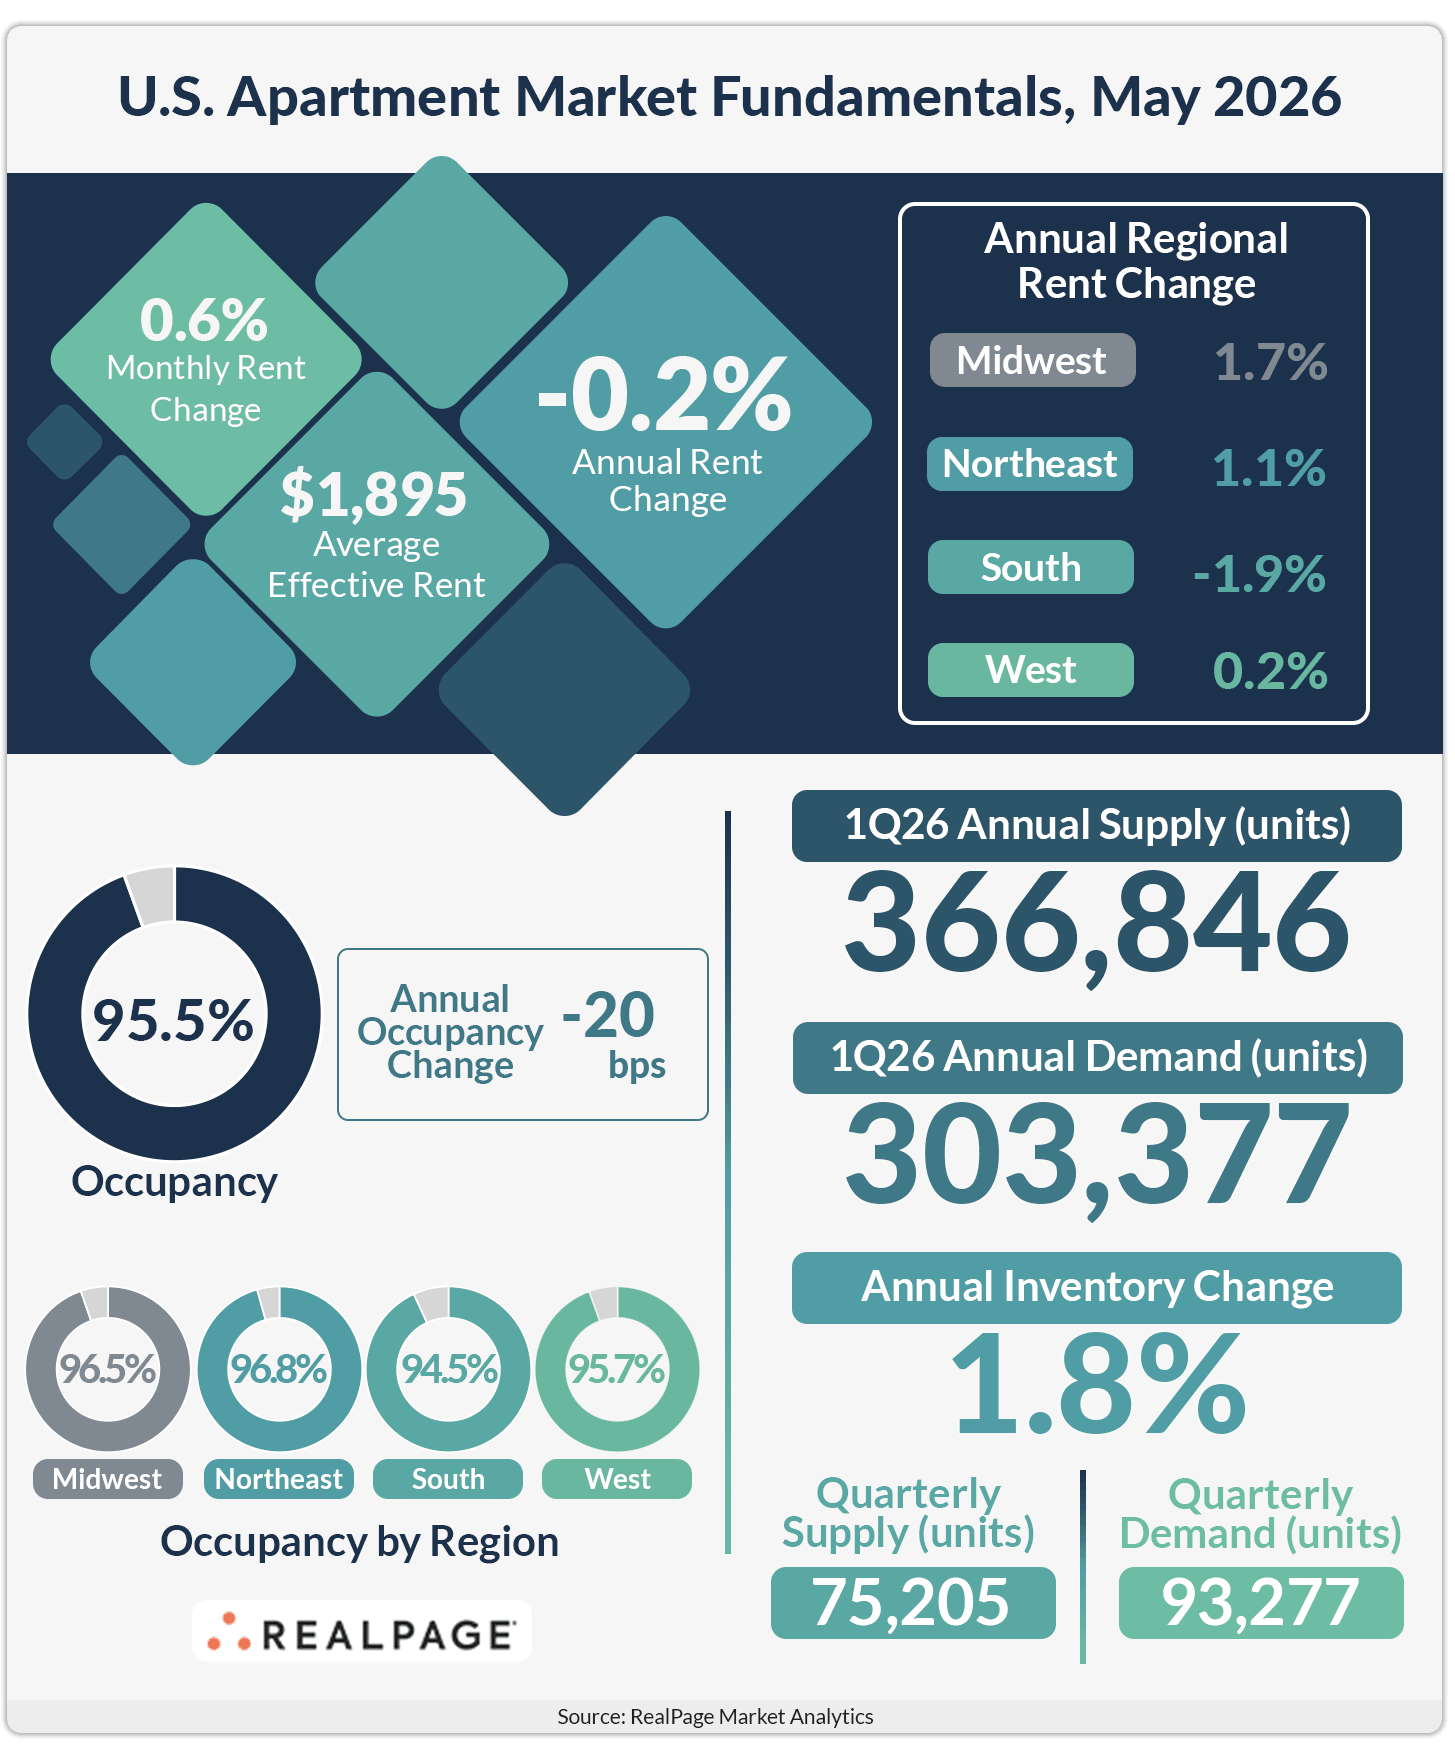
Effective asking rents have also increased for five consecutive months in 2026, though the increases have been relatively mild. U.S. prices were up 0.6% in May, marking five monthly increases between 0.2% and 0.6%. That sustained period of growth, however, couldn’t wipe out previous declines, leaving May rents 0.2% below year-earlier prices.
Annual Rent Cuts Continue in Only One U.S. Region
All four U.S. regions saw rents climb in May. In fact, monthly growth allowed the West region to pull itself out of annual rent cuts, leaving the South as the only region nationwide to continue to see annual price declines. The South is also the only U.S. region with apartment occupancy below 95%. In every other region, occupancy was at roughly 96% or above in May.
Annual rent cuts were most pronounced in Sun Belt markets, where elevated supply volumes continue to outpace demand. San Antonio posted the steepest decline (-6%) among the nation’s 50 largest apartment markets, unseating neighboring Austin (-4.9%). In fact, Austin was bumped down to the nation’s third-worst performance, following Denver (-5.6%). This is the first time Austin rent cuts have eased to less than 5% since July 2023.
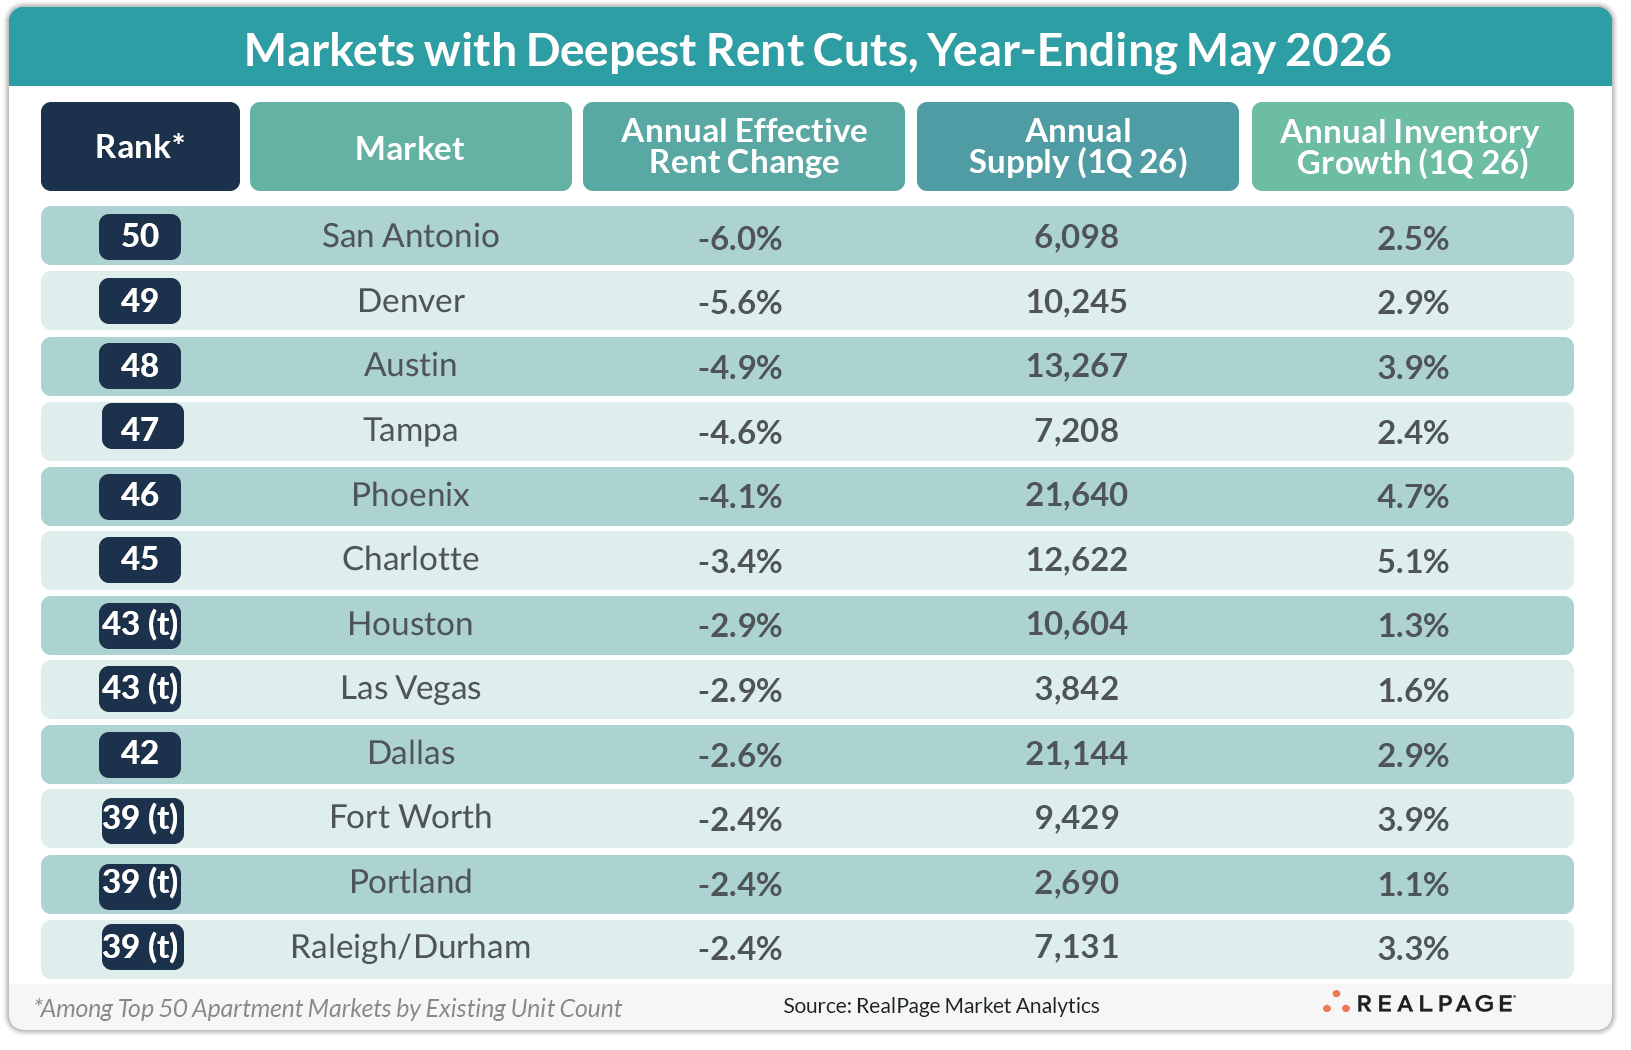
Phoenix and Charlotte also remained under notable rent pressure, with rents falling 4.1% and 3.4%, respectively, in the year-ending May, amid some of the fastest inventory growth rates nationally.
In tourism-driven economies like Tampa (-4.6%) and Las Vegas (-2.9%), rent softness was compounded as consumers pull back on discretionary travel, a slowdown tied to deteriorating economic confidence across the U.S.
Rent Growth Continues in Tech Hubs
Tech-oriented coastal markets continue to lead the nation’s rent growth rankings, supported by comparatively limited new supply and resilient high-wage employment expansion related to the rise in artificial intelligence.
San Francisco posted the nation’s strongest annual rent growth at 10.6% in the year-ending May. That was nearly twice the increase in the second strongest performer: San Jose (6.2%).
New York fell out of its typical place among the nation’s top five rent growth performers in May, with annual price growth of 3%. As rent growth moderates in New York and strengthens in some smaller markets, New York has slowly descended the rankings of late.

Several supply-constrained Midwest markets also posted steady rent gains in the past year. Milwaukee recorded 3.5% rent growth, while Chicago saw a 3.1% increase. More modest gains around the 2% mark were seen in St. Louis, Minneapolis, Detroit and Kansas City.