Completions Are Elevated but Spread Out in Boston


Boston apartment deliveries reached a multi-decade high in 2017, as development activity is spreading out from the urban core. That pattern bodes well for the apartment market, as dispersed deliveries are more easily absorbed, limiting the impact of new supply on any one particular area.
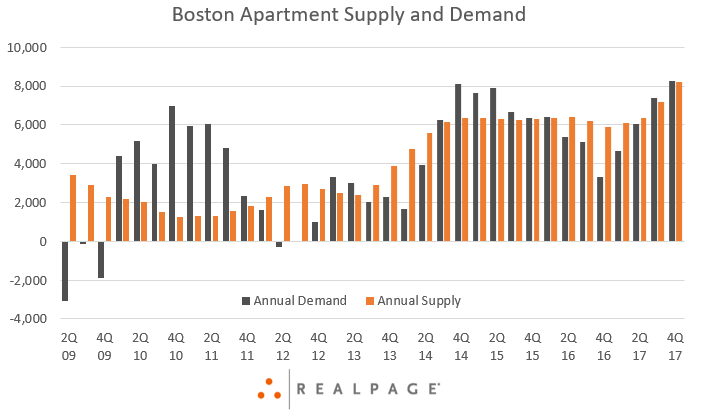
Deliveries in Boston reached 8,223 units in the past year, with this volume expanding the metro’s inventory base 2.2%. Both metrics more than doubled the long-term averages and are the latest in a supply wave that stretches back to 2013.
At the beginning of the elevated supply stretch, the urban core submarkets drove the metro’s completion volumes, regularly accounting for around half of all new deliveries. In 2017, those urban areas of Intown Boston, Fenway/Brookline/Brighton and Cambridge/Somerville accounted for 32% of deliveries in 2017 – meaning that most new product in Boston is heading to the close-in neighborhoods and the suburbs.
As completions have become more dispersed, absorption has accelerated. Boston apartment demand was robust at 8,275 units in 2017. That was the #11 performance in the country and the highest absorption volume the metro has realized since RealPage began tracking the market.
The Boston area usually sees a lot of seasonality in apartment demand performances. It’s not uncommon for absorption to essentially disappear during the cold weather months, and then peak mid-year. In 2017, the 2nd quarter surge was the most robust in recent history, and the standard 4th quarter slump wasn’t as significant as normal, as the market avoided net move-outs. Both of those scenarios pointed toward the record annual showing.
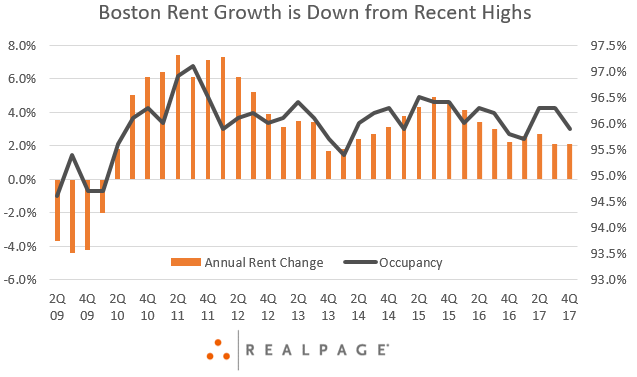
At the end of 2017, occupancy was at 95.9%, essentially unchanged year-over-year, and roughly in line with the metro’s long-term norm. That’s impressive, given the amount of new supply.
However, operators apparently sacrificed on rents in an effort to spur along demand. Like demand, price positioning in Boston often takes a downturn in 4th quarter. The late 2017 dive was slightly more dramatic than usual, with rents coming down 2.4%. While rents are still growing on an annual basis, recent progress (2.1% in 2017) has been moderate compared to the 4% annual average since 2010.
The market should see improved rent performances in the year ahead as ongoing construction is even more spread out than recent completions. The urban core recorded just 2,500 units underway at the end of 2017. That combined tally represents just under 30% of the metro’s total construction volume.
Meanwhile, nearly every other submarket is seeing at least some construction. By a slight margin, Quincy stands as the submarket-level new supply leader moving forward, with more than 1,300 units underway. That construction volume is larger than the total number of new units delivered in Quincy over the past five years.