Which U.S. Apartment Markets are Low-Risk and Which are High-Reward?

Early 2023 apartment market results have been something of a mixed bag. Some metrics have strengthened from late 2022 doldrums. Collected rent is surpassing its pre-pandemic level, rent growth is still strong, and leasing traffic remains solid. Meanwhile, other metrics cloud the outlook, such as evaporating loss to lease, a 40-year high in new apartment deliveries and still-high inflation.
As such, the approach for most groups heading into 2023 and likely even 2024 has been one colored largely by risk mitigation. For some, that means closely monitoring the rise in expenses. For others, that means relying more heavily on low beta markets – a strategy that helps offset risk with the understood trade-off of a lower reward ceiling.
Apartment markets can behave much like stocks and commodities. In other words, there is an inherent sense of volatility embedded within individual metros. While more nuanced strategies (urban or suburban focus; Class A, Class B or Class C; value-add or new development) are levers that can adjust risk profiles, the ultimate takeaway is that some markets are accompanied by more (or less) risk and reward than others.
There are a number of ways in which market risk/reward (or risk-adjusted returns) can be measured. Some are rooted in deep statistical analysis while others can be derived from more comparative means. After all, there are a finite number of markets in which one can choose from so comparing available options can be a useful benchmark.
The following text outlines a few risk/reward assessments by market. Keep in mind this list is far from extensive and does not explore every measure of risk or beta. What it does achieve, however, is a high-level overview and a closer-to-consensus view of volatility and trade off of risk/reward by market.
Approach #1: Comparing Record High/Record Low Rent Growth Years Within Markets
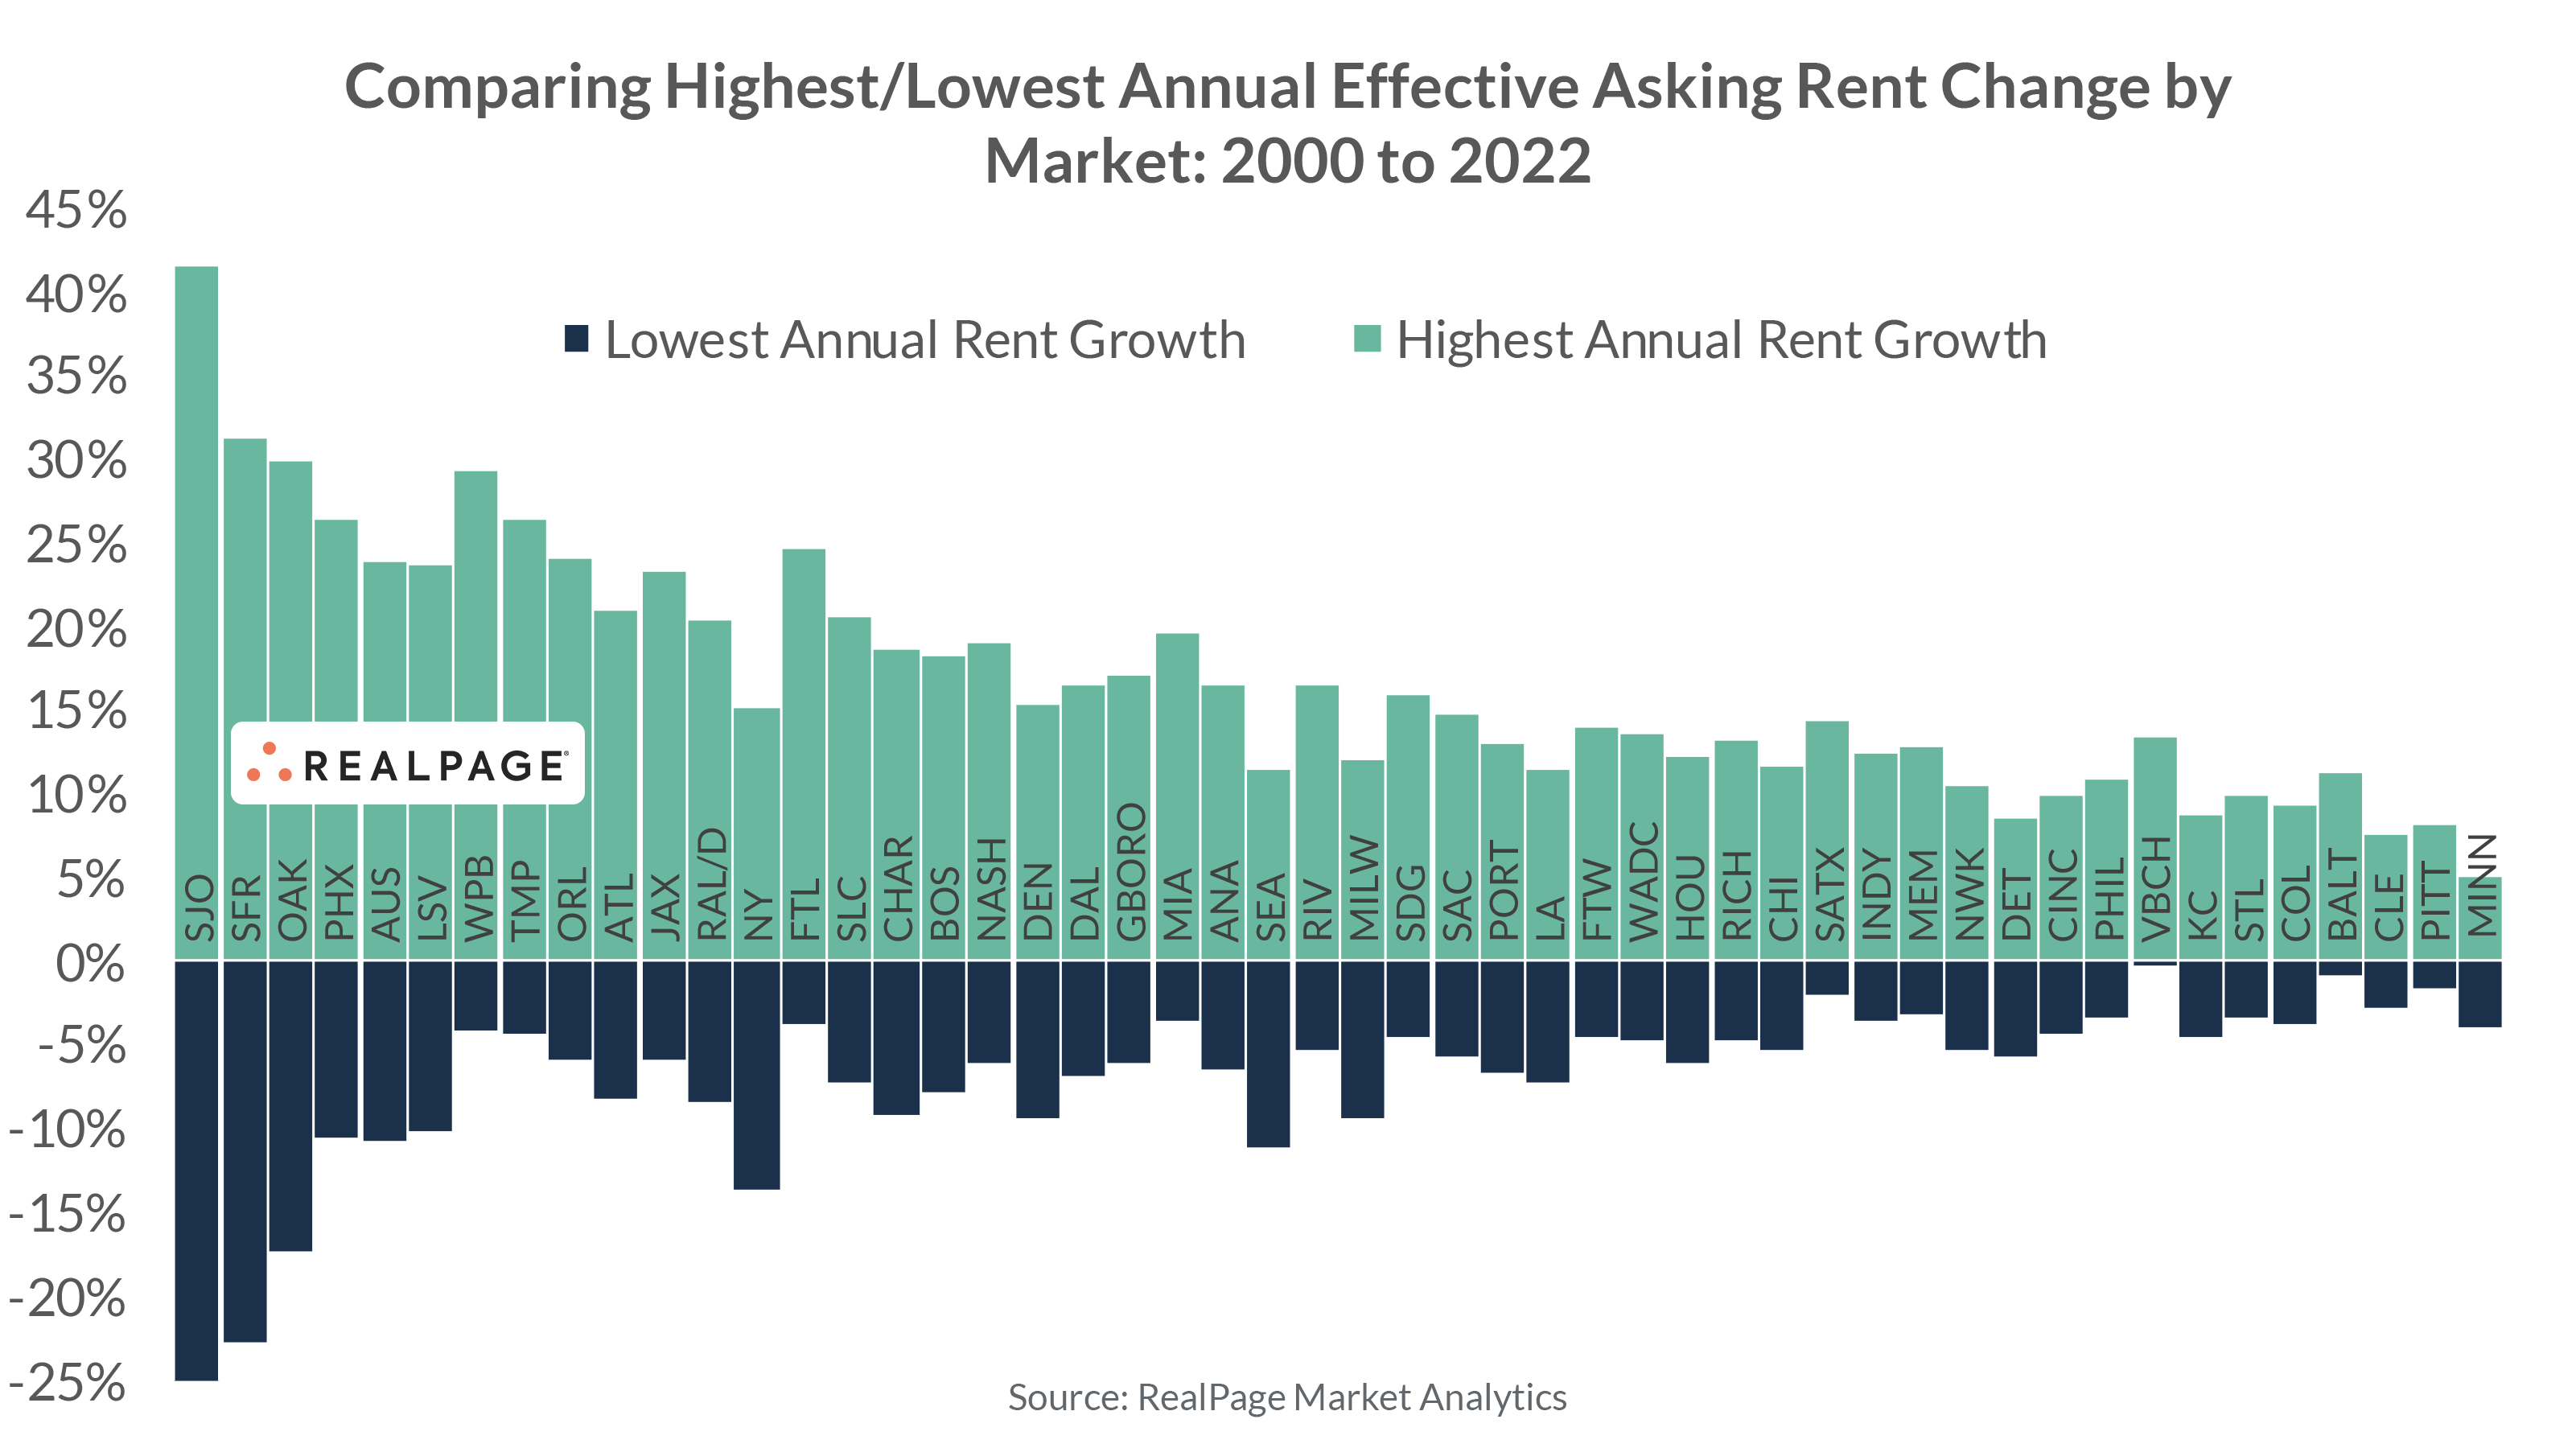
Perhaps the quickest way to compare local market volatility is by simply taking the difference between the highest year for annual rent growth versus the lowest year.
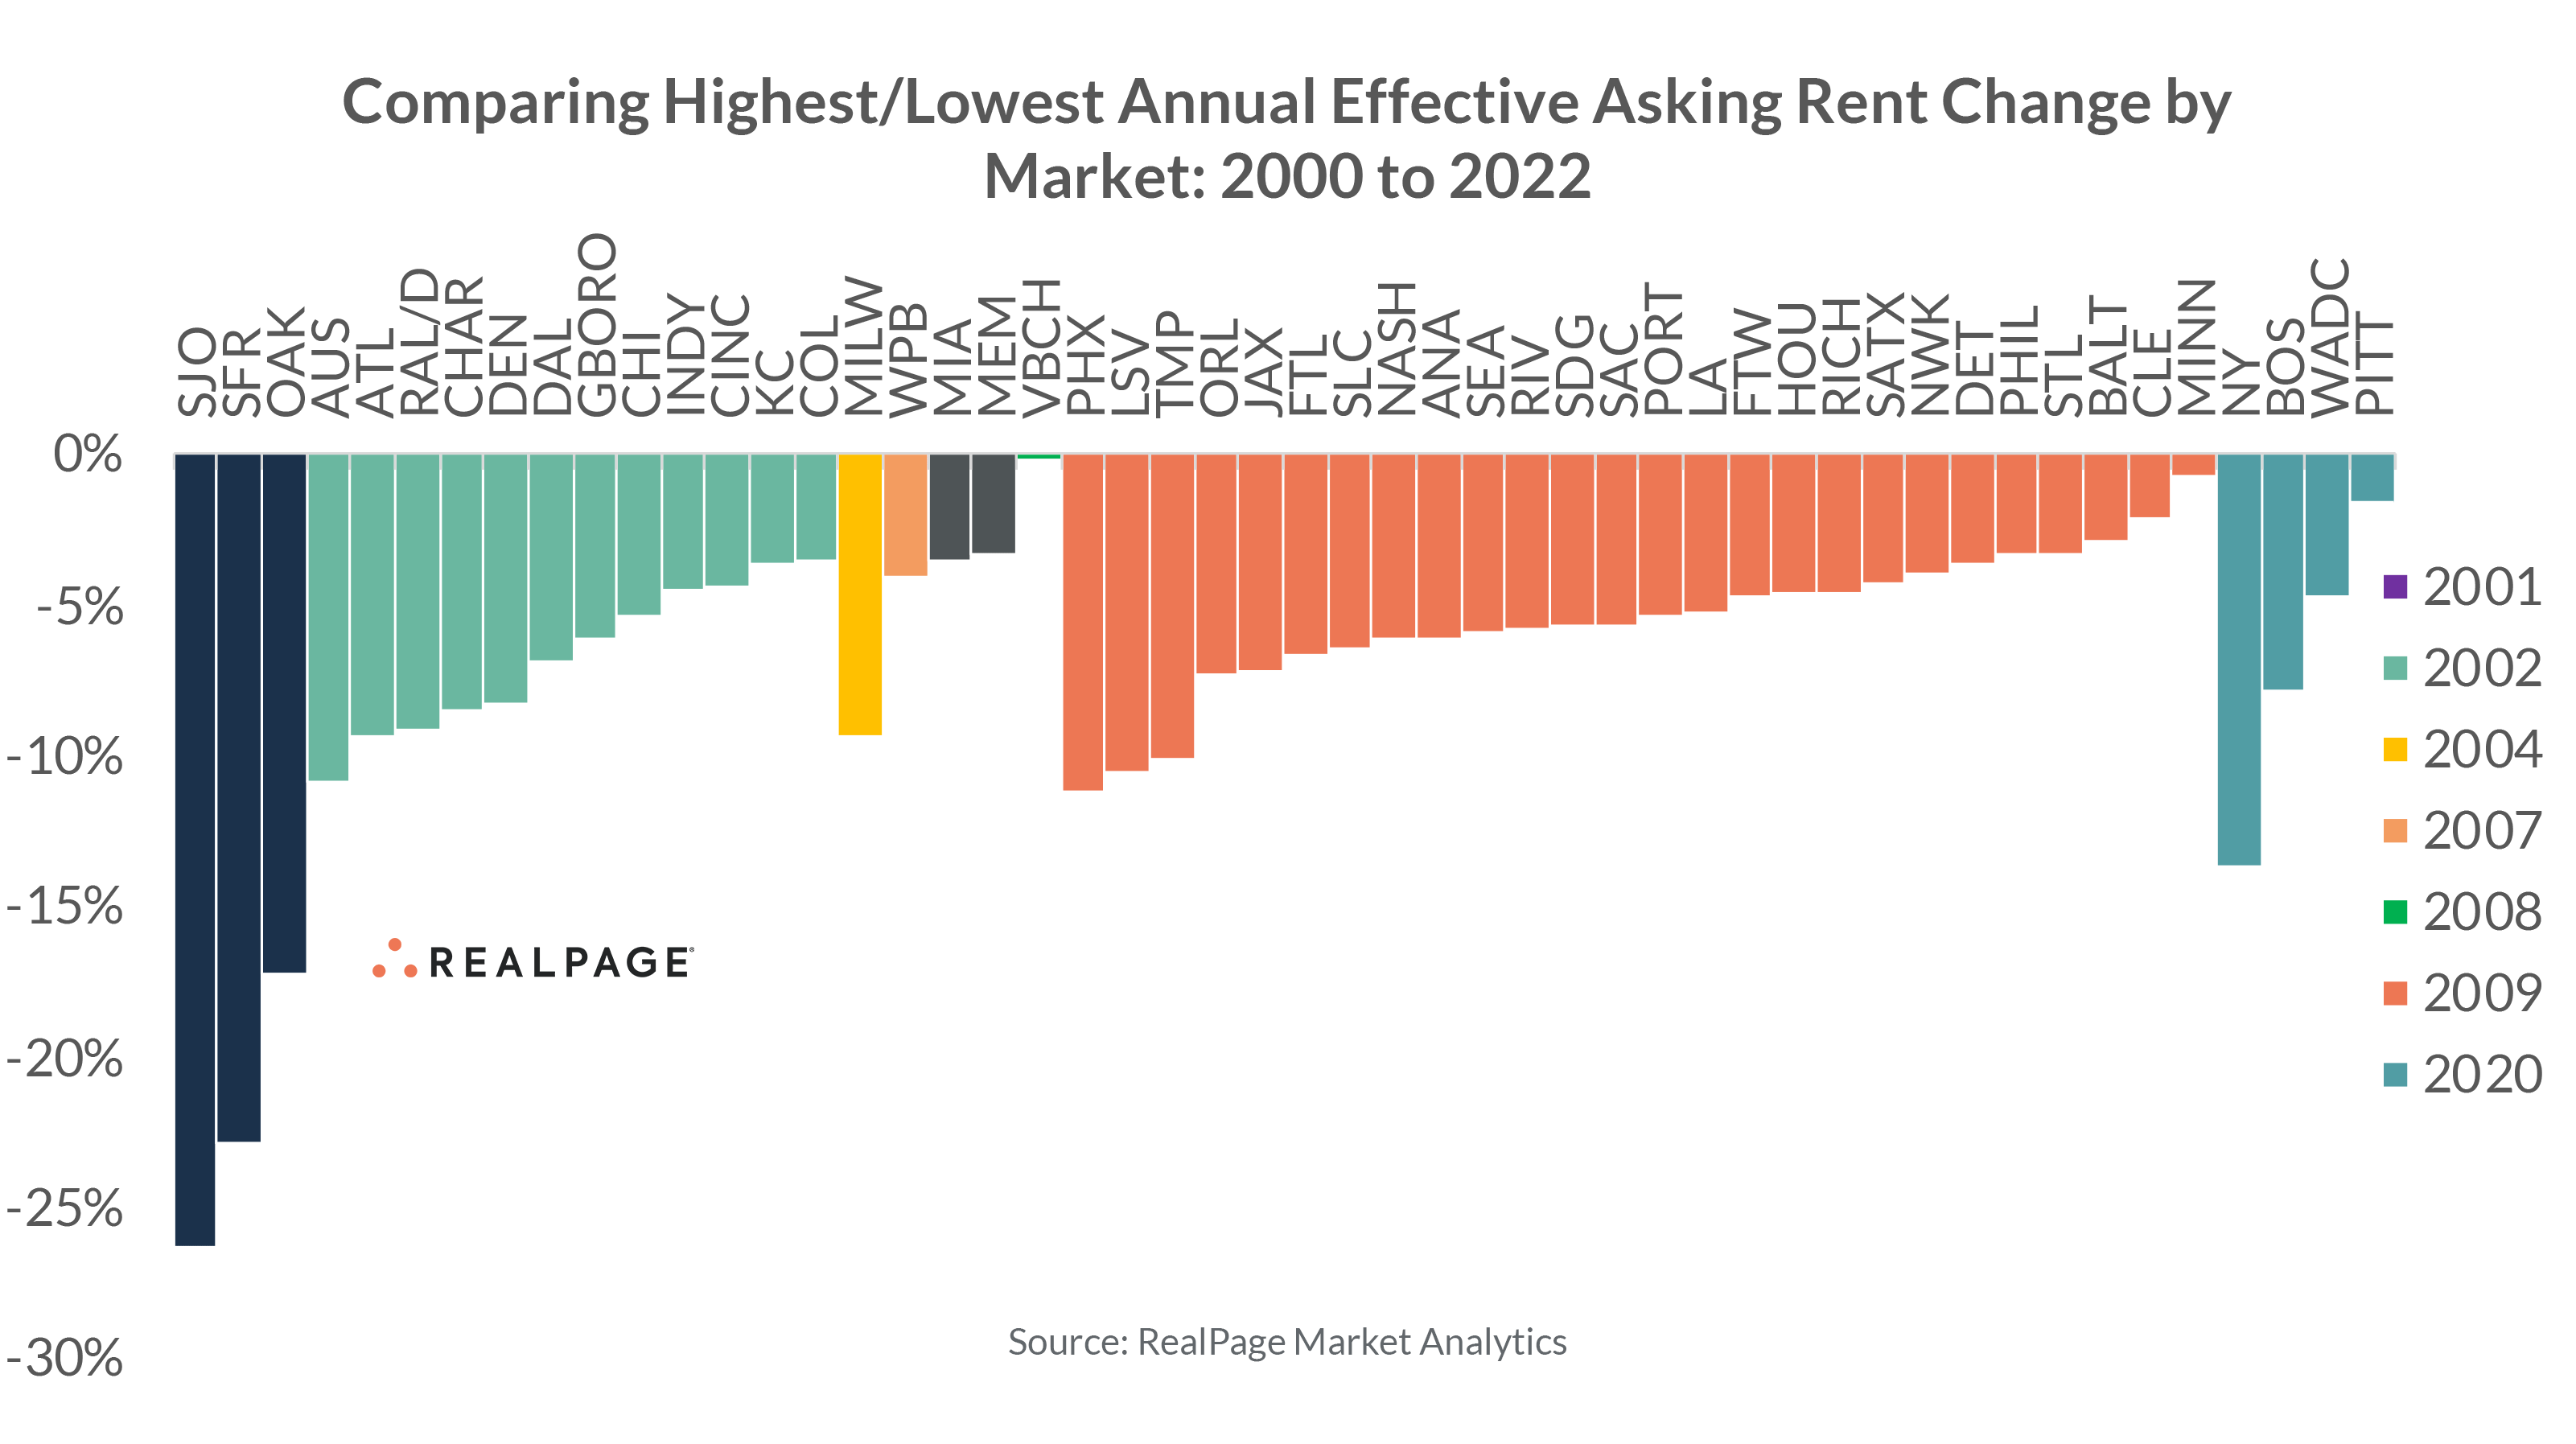
Among the nation’s largest 50 U.S. apartment markets, the difference between highest year of rent growth and lowest year of rent cuts varies during the past 20 or so years, according to data from RealPage Market Analytics.
Incredibly large swings between local peaks and valleys can be found in places like the San Francisco’s Bay Area, Phoenix, Austin and Las Vegas. Conversely, very little variance can be found in the Midwest and Rust Belt markets of Minneapolis, Pittsburgh, Cleveland, Baltimore and Columbus.
From this perspective, it’s fairly easy to see which markets have bigger boom/bust propensity. Still, this chart admittedly misses the mark in terms of true volatility within individual metros.
For example, it’s probably unfair to say West Palm Beach, Tampa and Orlando are more volatile than New York, Denver and Seattle considering the former trio of markets’ low point ranges from -4% to -6%. Meanwhile, New York, Denver, and Seattle have seen rent cuts range from -9% to -14%.
Approach #2: Comparing Local Market Rent Growth Versus a Benchmark (U.S. Average)
No investment is risk free, and in the worst of down years even the U.S. overall will experience rent cuts. As such, a useful exercise can be comparing market performance to the nation overall. After all, if the nation at large sees negative revenue growth, then a risk mitigation strategy can be to offset the full brunt of a down market.
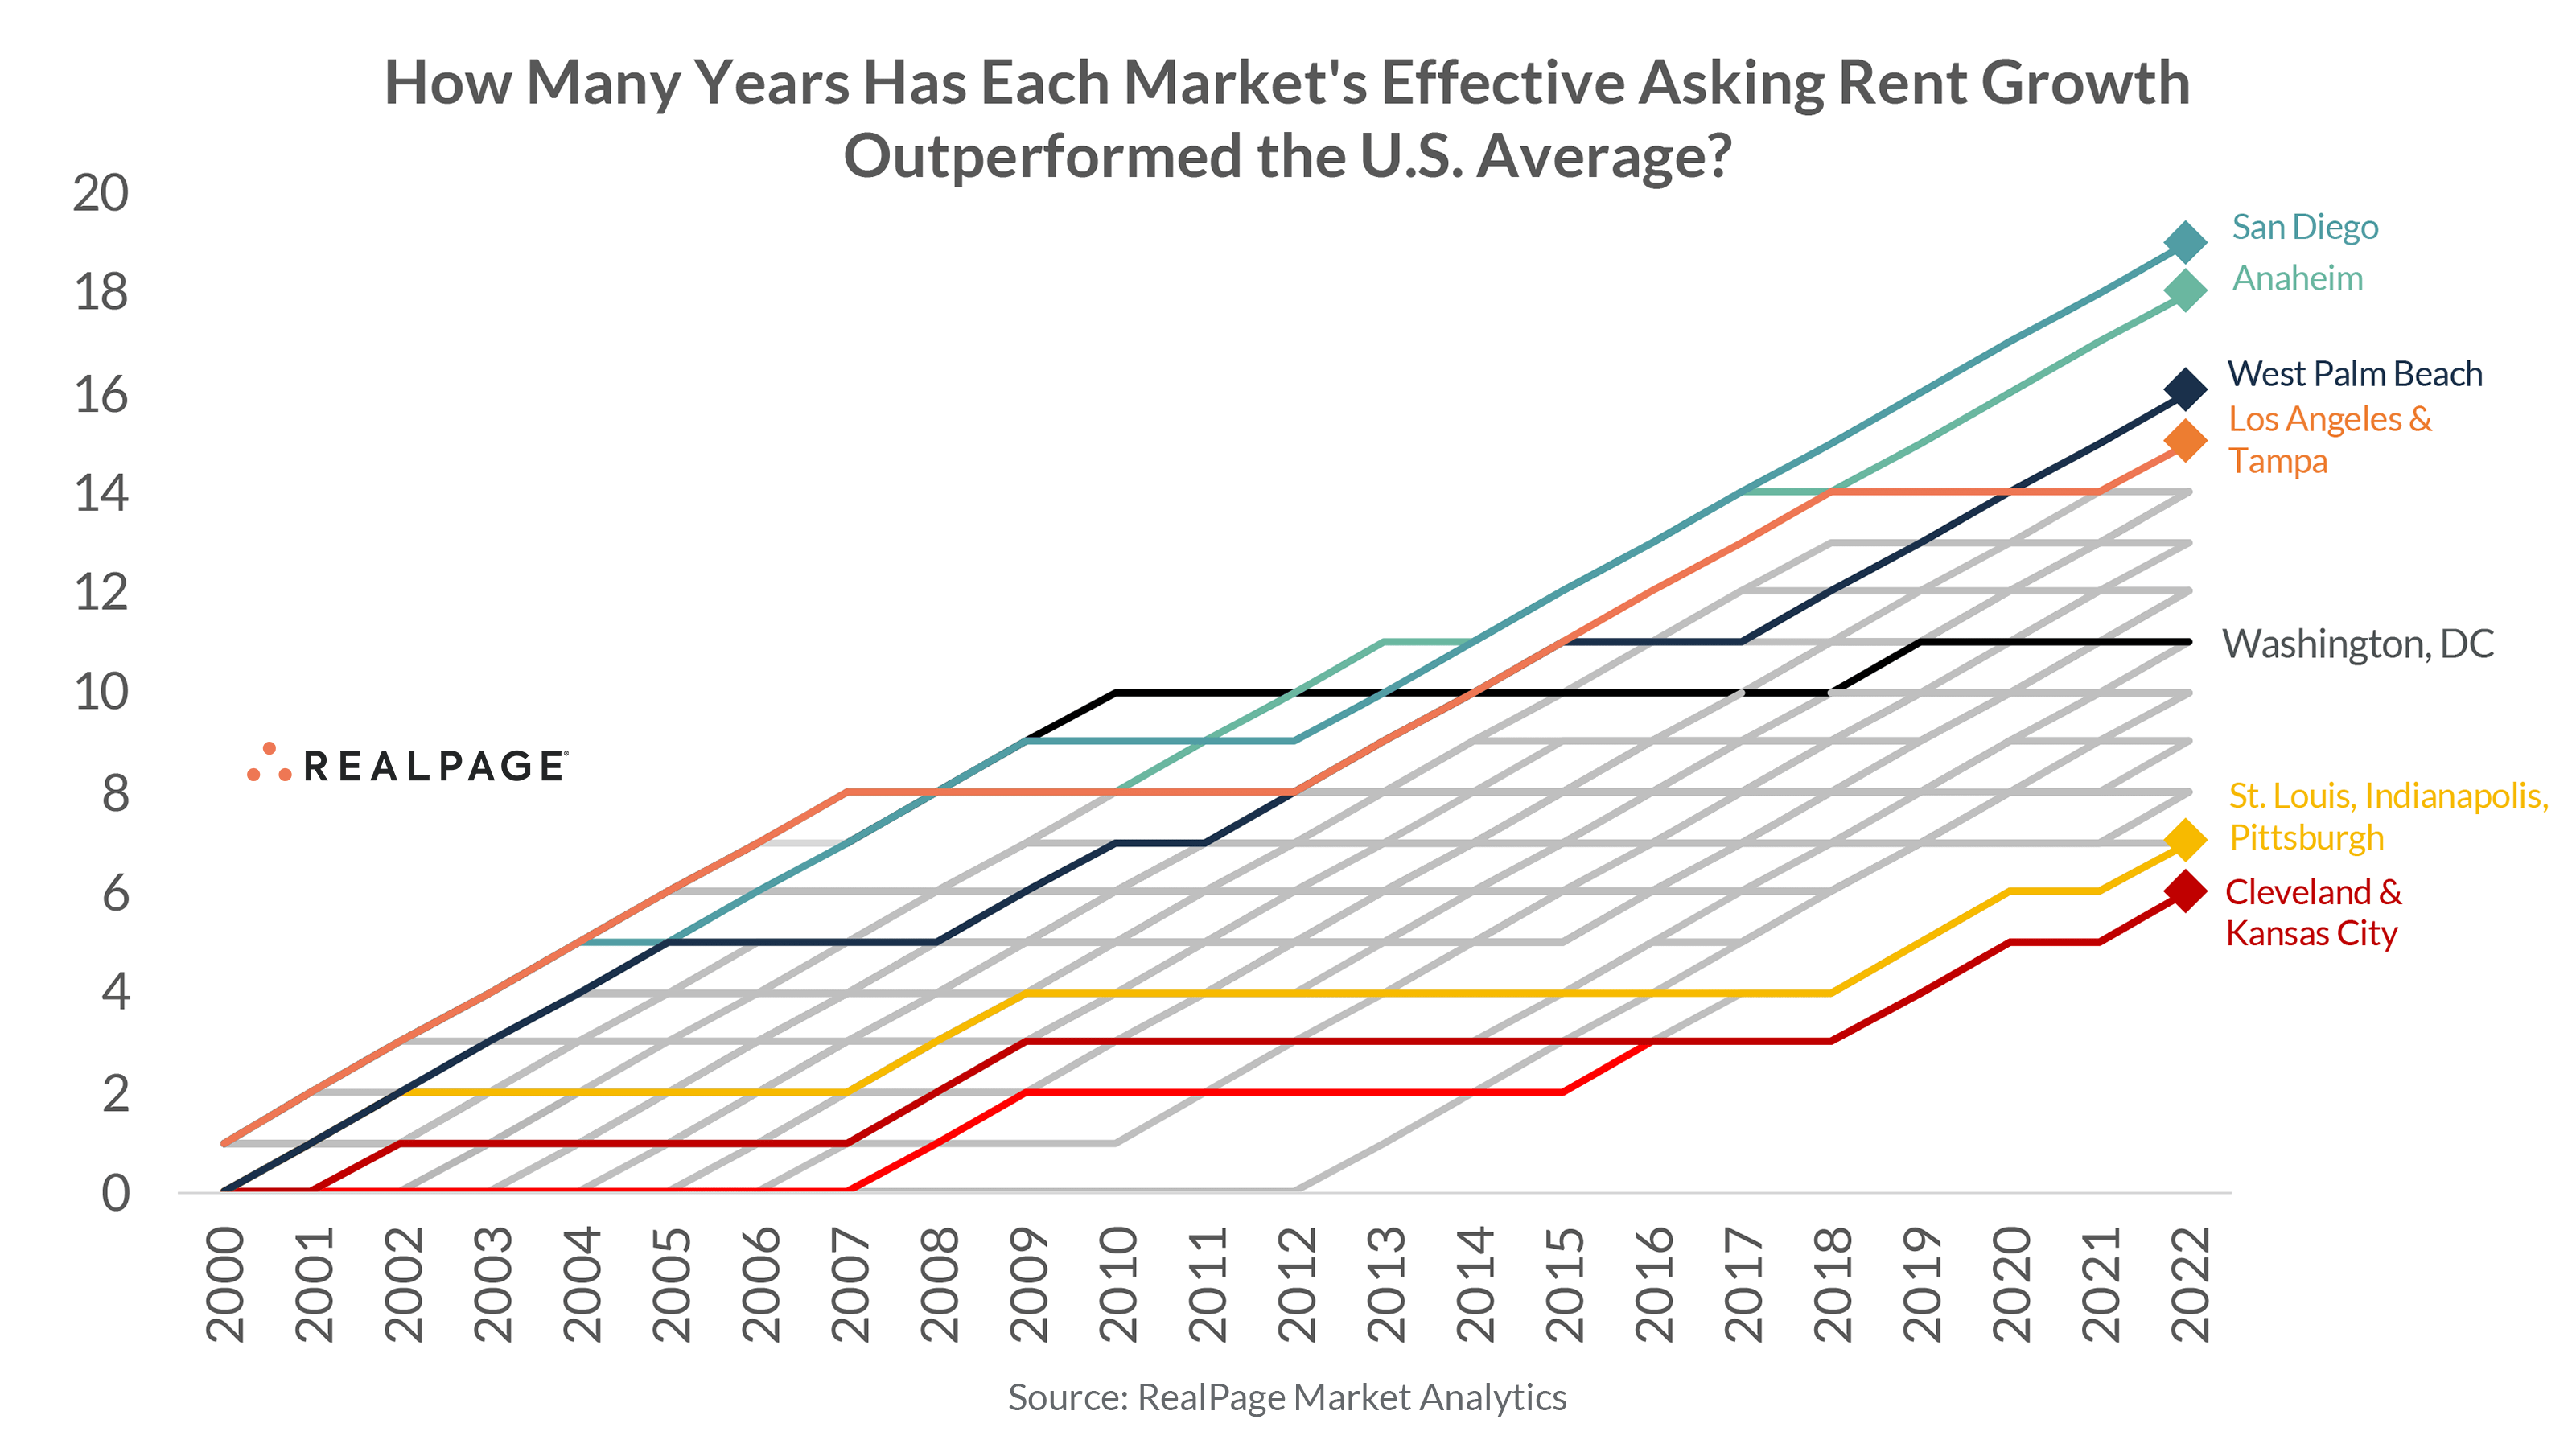
Looking at cumulative win-loss over the past two decades or so, years in which local rent growth outperforms the U.S. overall count as a +1. That isn’t to say each one of these years in these markets saw positive rent change. It’s just that the +1 years saw rent growth that still managed to outpace the national average.
For example, San Diego’s rent growth has topped the national average in 19 out of 23 possible instances. That win rate (83%) is top in the nation, followed by Anaheim (18 out of 23 years, or 78%) and West Palm Beach (16 out of 23 years, or 70%).
On the inverse, Cleveland and Kansas City have generally been the weakest performing markets in comparison to the U.S. average, besting the U.S. norm in just six of the past 23 years (or 26% of the time). St. Louis, Indianapolis and Pittsburgh follow closely behind (a total of 7 out of 23 years, or 30%)
Another interesting component of this view is that one can see market momentum relative to the U.S. over time. For example, Washington, DC had consistently been an outperforming market up until 2010. Since 2010 though, the market’s local rent growth has topped the U.S. just once (in 2018).
The shortcoming of this view is that magnitude of performance isn’t highlighted, so we need to control for magnitude of gap as well.
Approach #3: Comparing Magnitude of Rent Growth Differences Versus U.S. Average
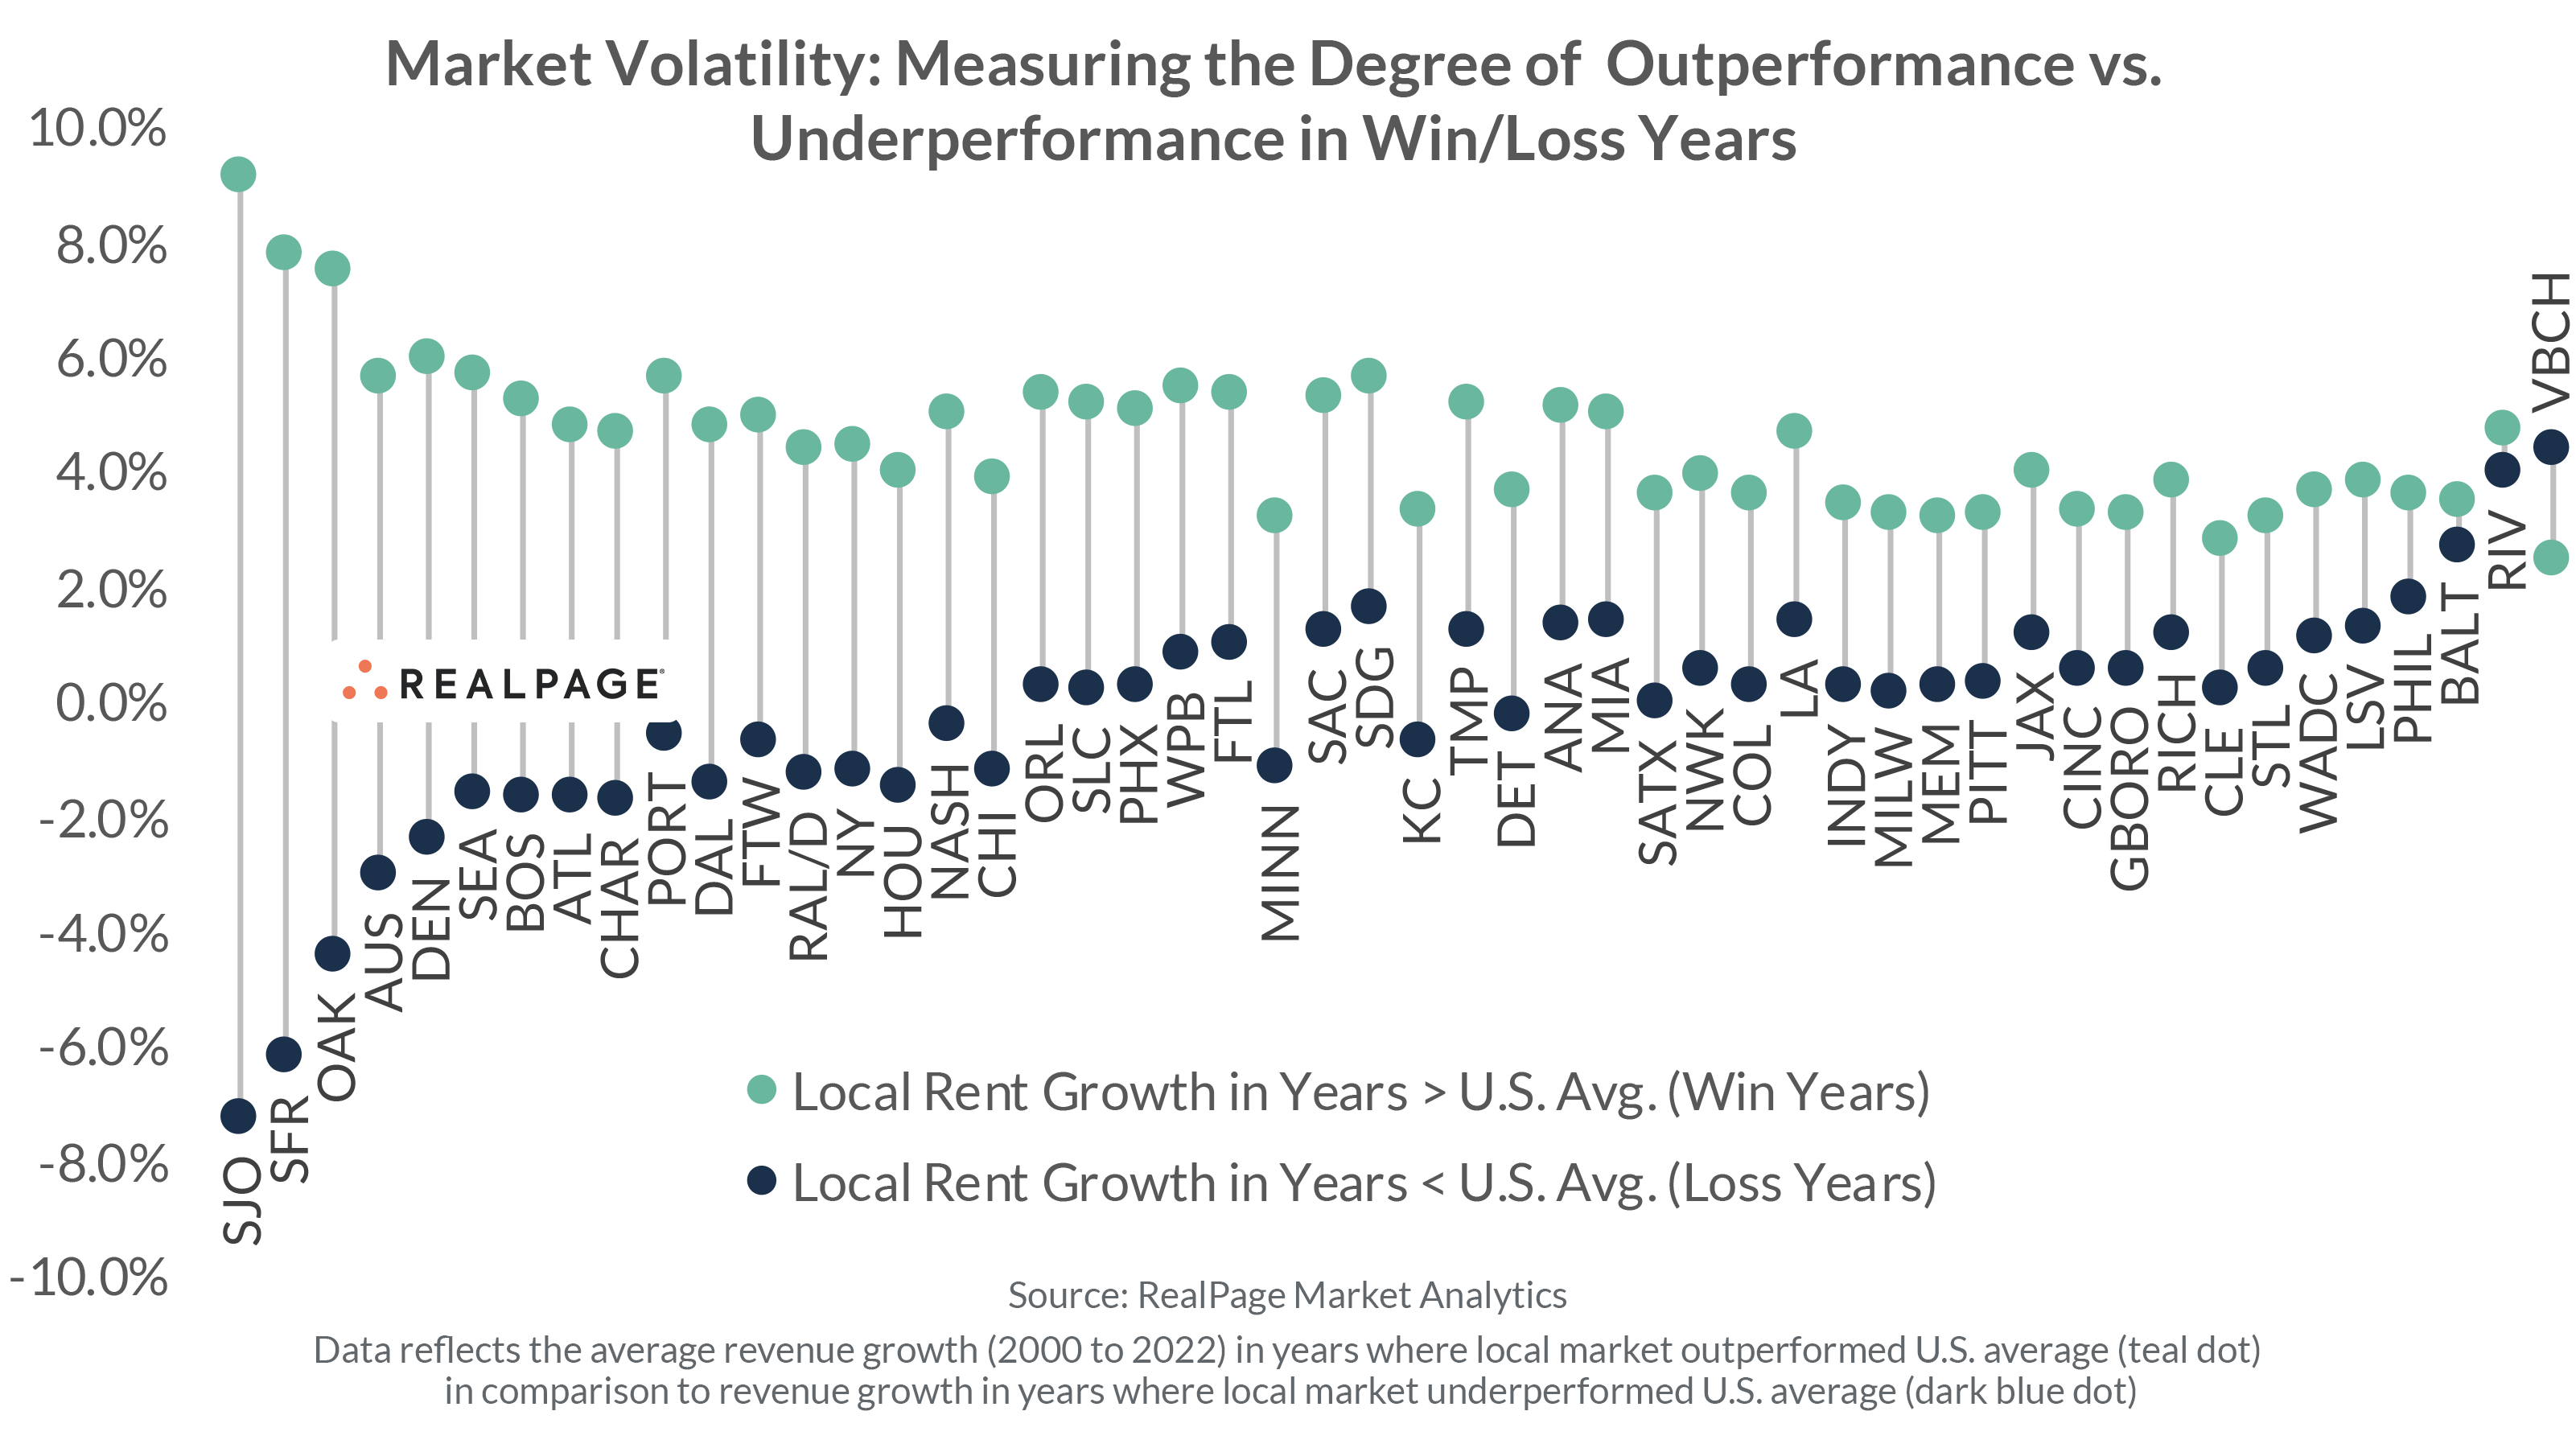
To help control for degree of outperformance, one might look at rent growth in years where the local market was on top of the U.S. average then compare that figure to the years where local performance was below the national average.
Looking at 20+ years of local rent growth and splitting that into “win” years (local growth > U.S. average) and “loss” years (local growth < U.S. average), it’s easily to see the high volatility of places like San Francisco, Austin, Denver, etc. Years in which San Jose outperforms the national average tend to do so considerably (on average, though do note the Bay Area stats are highly inflated by the 2000s Tech Bubble).
Nevertheless, the takeaway is that boom years tend to boom quite substantially. Bust years, however, tend to be pronounced. Average rent cuts in years where San Francisco has underperformed the U.S. average, for instance, are about -6%.
One interesting market is Virginia Beach. That particular metro area is the only instance where loss years actually tend to outperform win years. That suggests that this market could be countercyclical to the U.S. to some degree. In other words, years where this market’s local growth underperform the national average actually tend to be the strongest years within that particular metro. This means this is a true low-upside yet also low-downside market.
Approach #4: Standard Deviation Within Markets
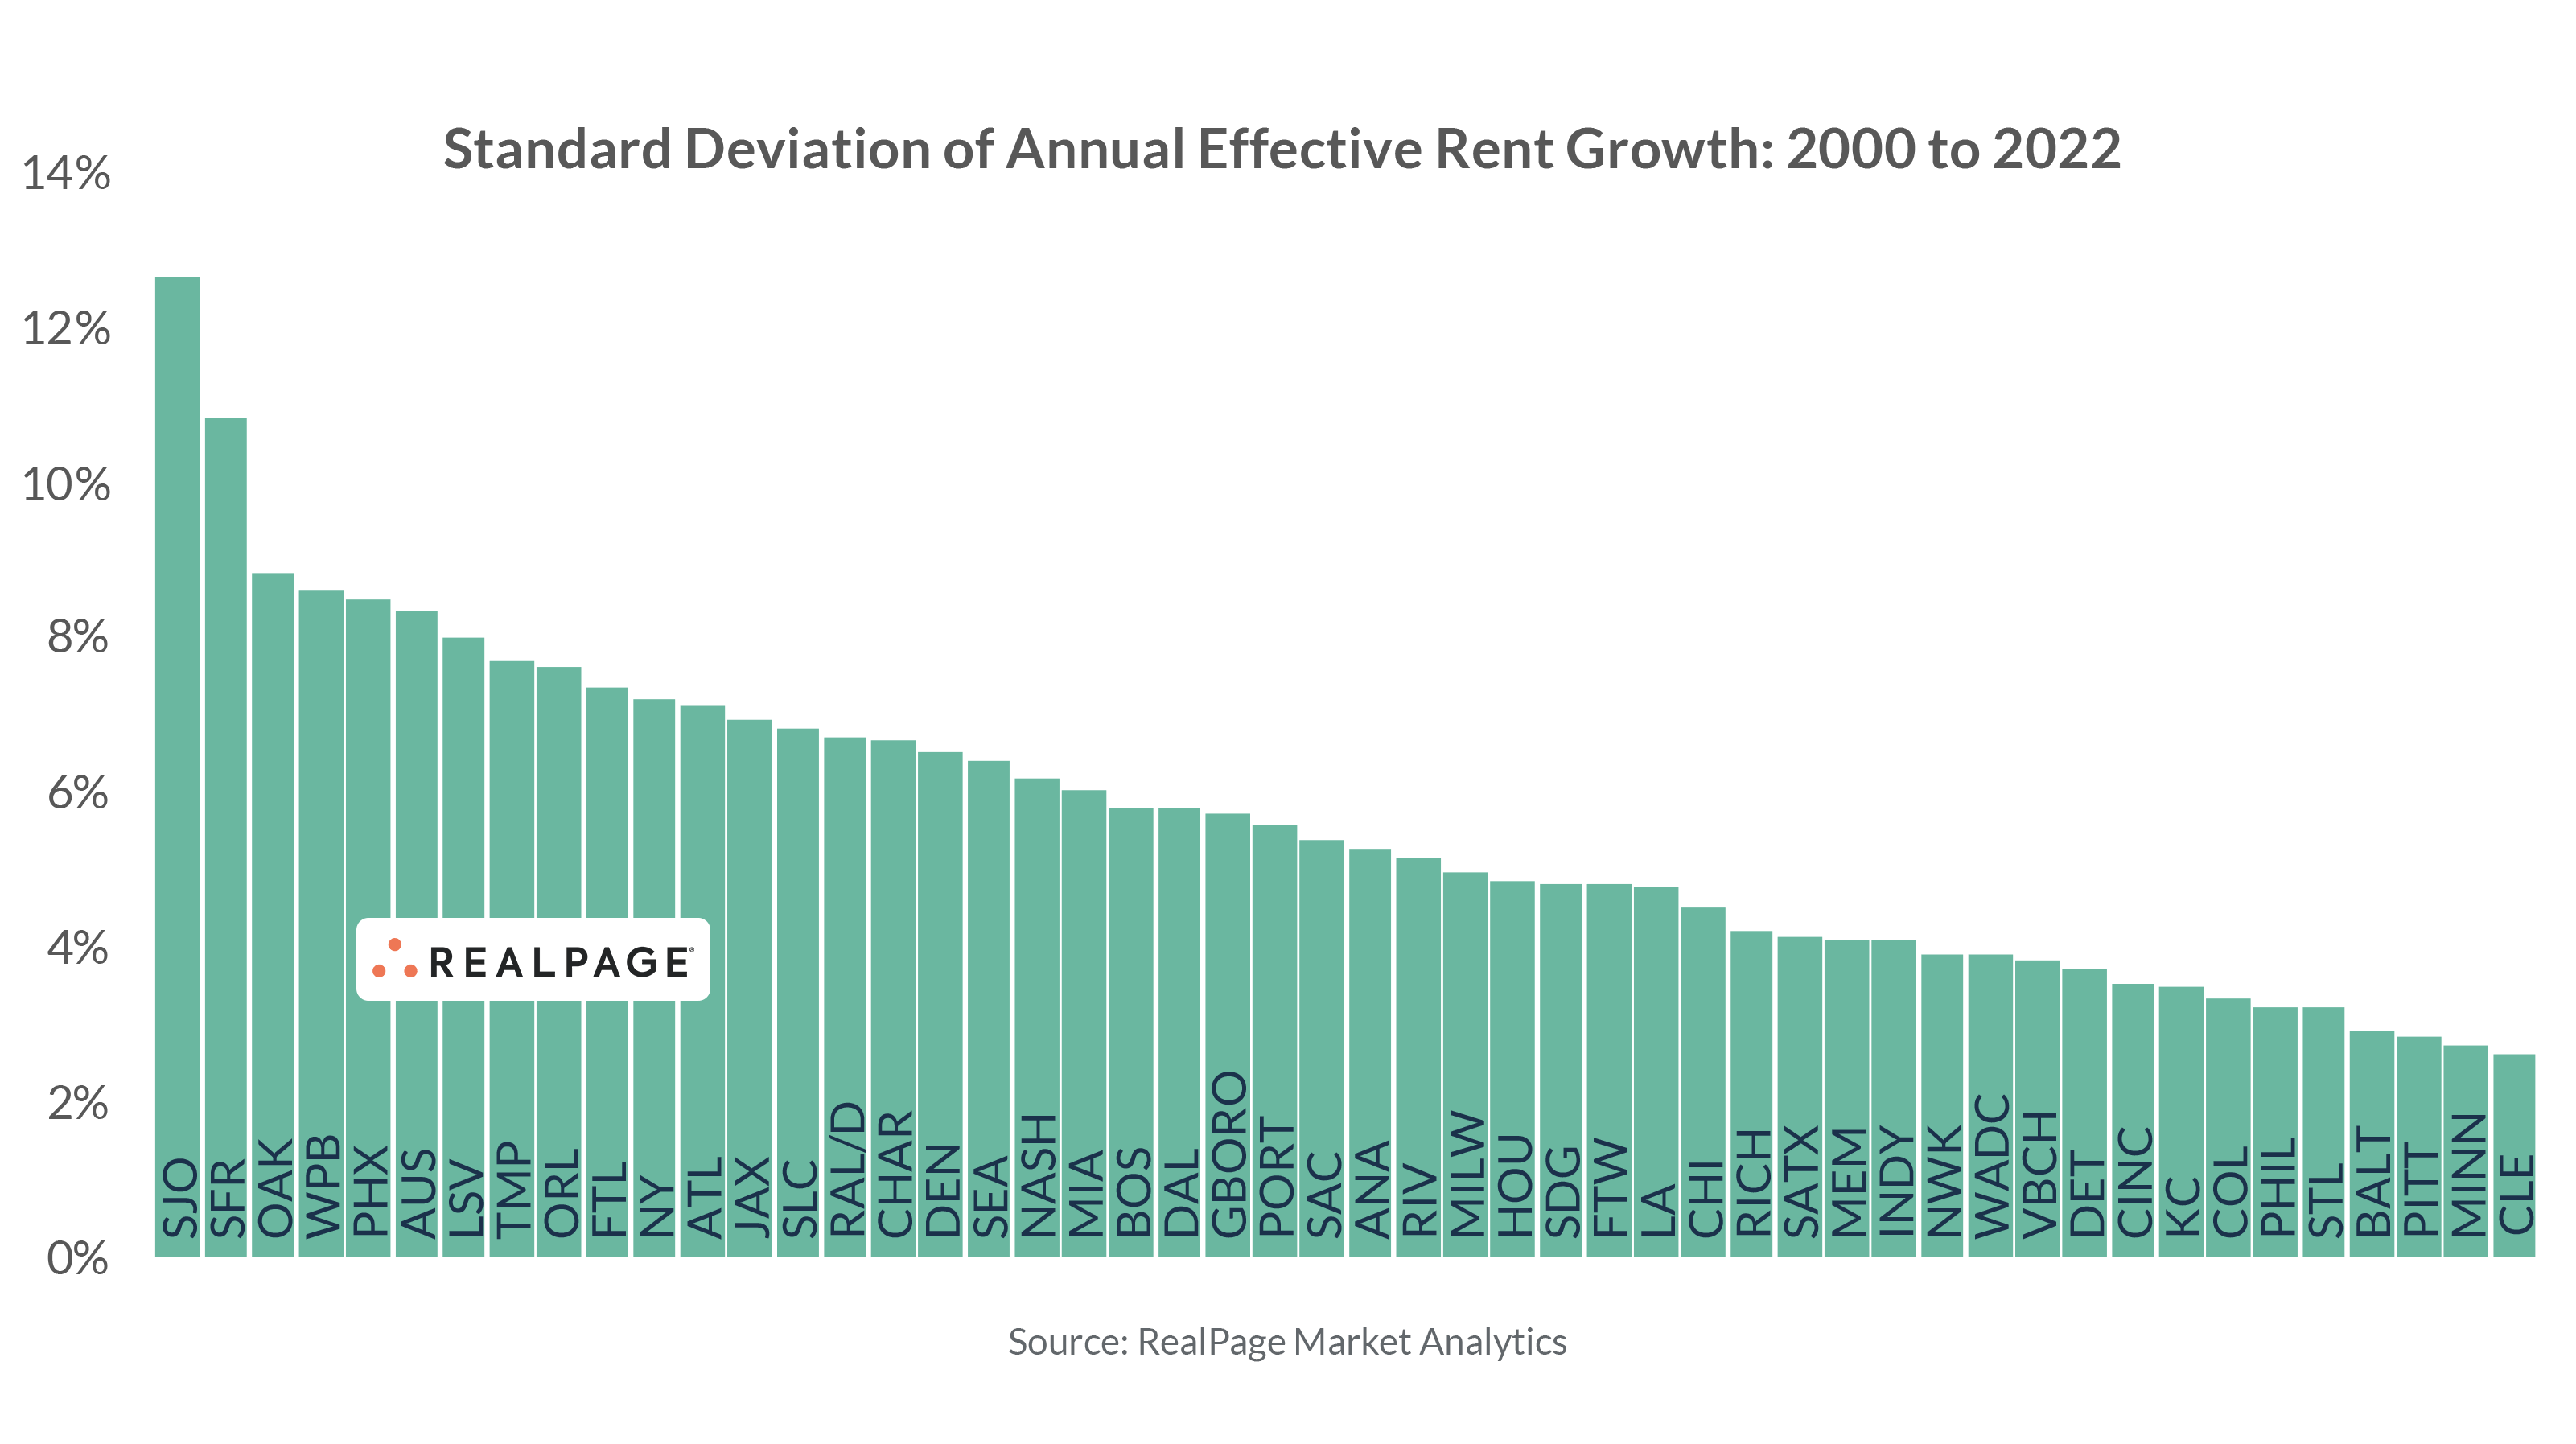
Another approach – one rooted in statistics and relatively straightforward – is to take standard deviation of rent growth.
Generally speaking, the results mirror those that have been revealed thus far: typically less standard deviation among Midwest markets and higher standard division among coastal markets.
Approach #5: Analyzing Past Shock Events & Their Impact on Local Performance
The consortium of markets belonging to the higher risk/higher reward tranche can be easily tied back to a few hyperlocal influences. It can also highlight when shock events like recessions were harshest within local markets.
The San Francisco Bay Area was the epicenter of the late 1990s/early 2000s Tech Bubble, which meant local rent growth skyrocketed as demand surged in 2000. On the inverse, those rents plummeted sharply in 2001, taking a full three years to stabilize thereafter. Austin felt similar impacts albeit to a slightly lesser degree – both on the upswing and the downswing. To that effect then, it’s safe to think that tech sector softness impacts those markets to a more significant degree.
The story of Las Vegas and Phoenix’s late 2000s housing bubble and Great Recession downturn is easy to spot. Florida markets also experienced deep lows relative to the nation overall, many of which saw their weakest years on record. Though in all fairness, most major markets saw their worst year of performance materialize in 2009.
Recently, the impacts of the COVID-19 pandemic meant that the markets of New York, Boston, Washington, DC, and Pittsburgh all saw their local low for annual rent change.


