Multifamily construction surged in February as both permitting and starts recorded strong growth from January’s annualized rates. The seasonally adjusted annualized rates for multifamily permitting and starts also reversed a recent trend of year-over-year declines, according to the U.S. Census Bureau’s monthly report.
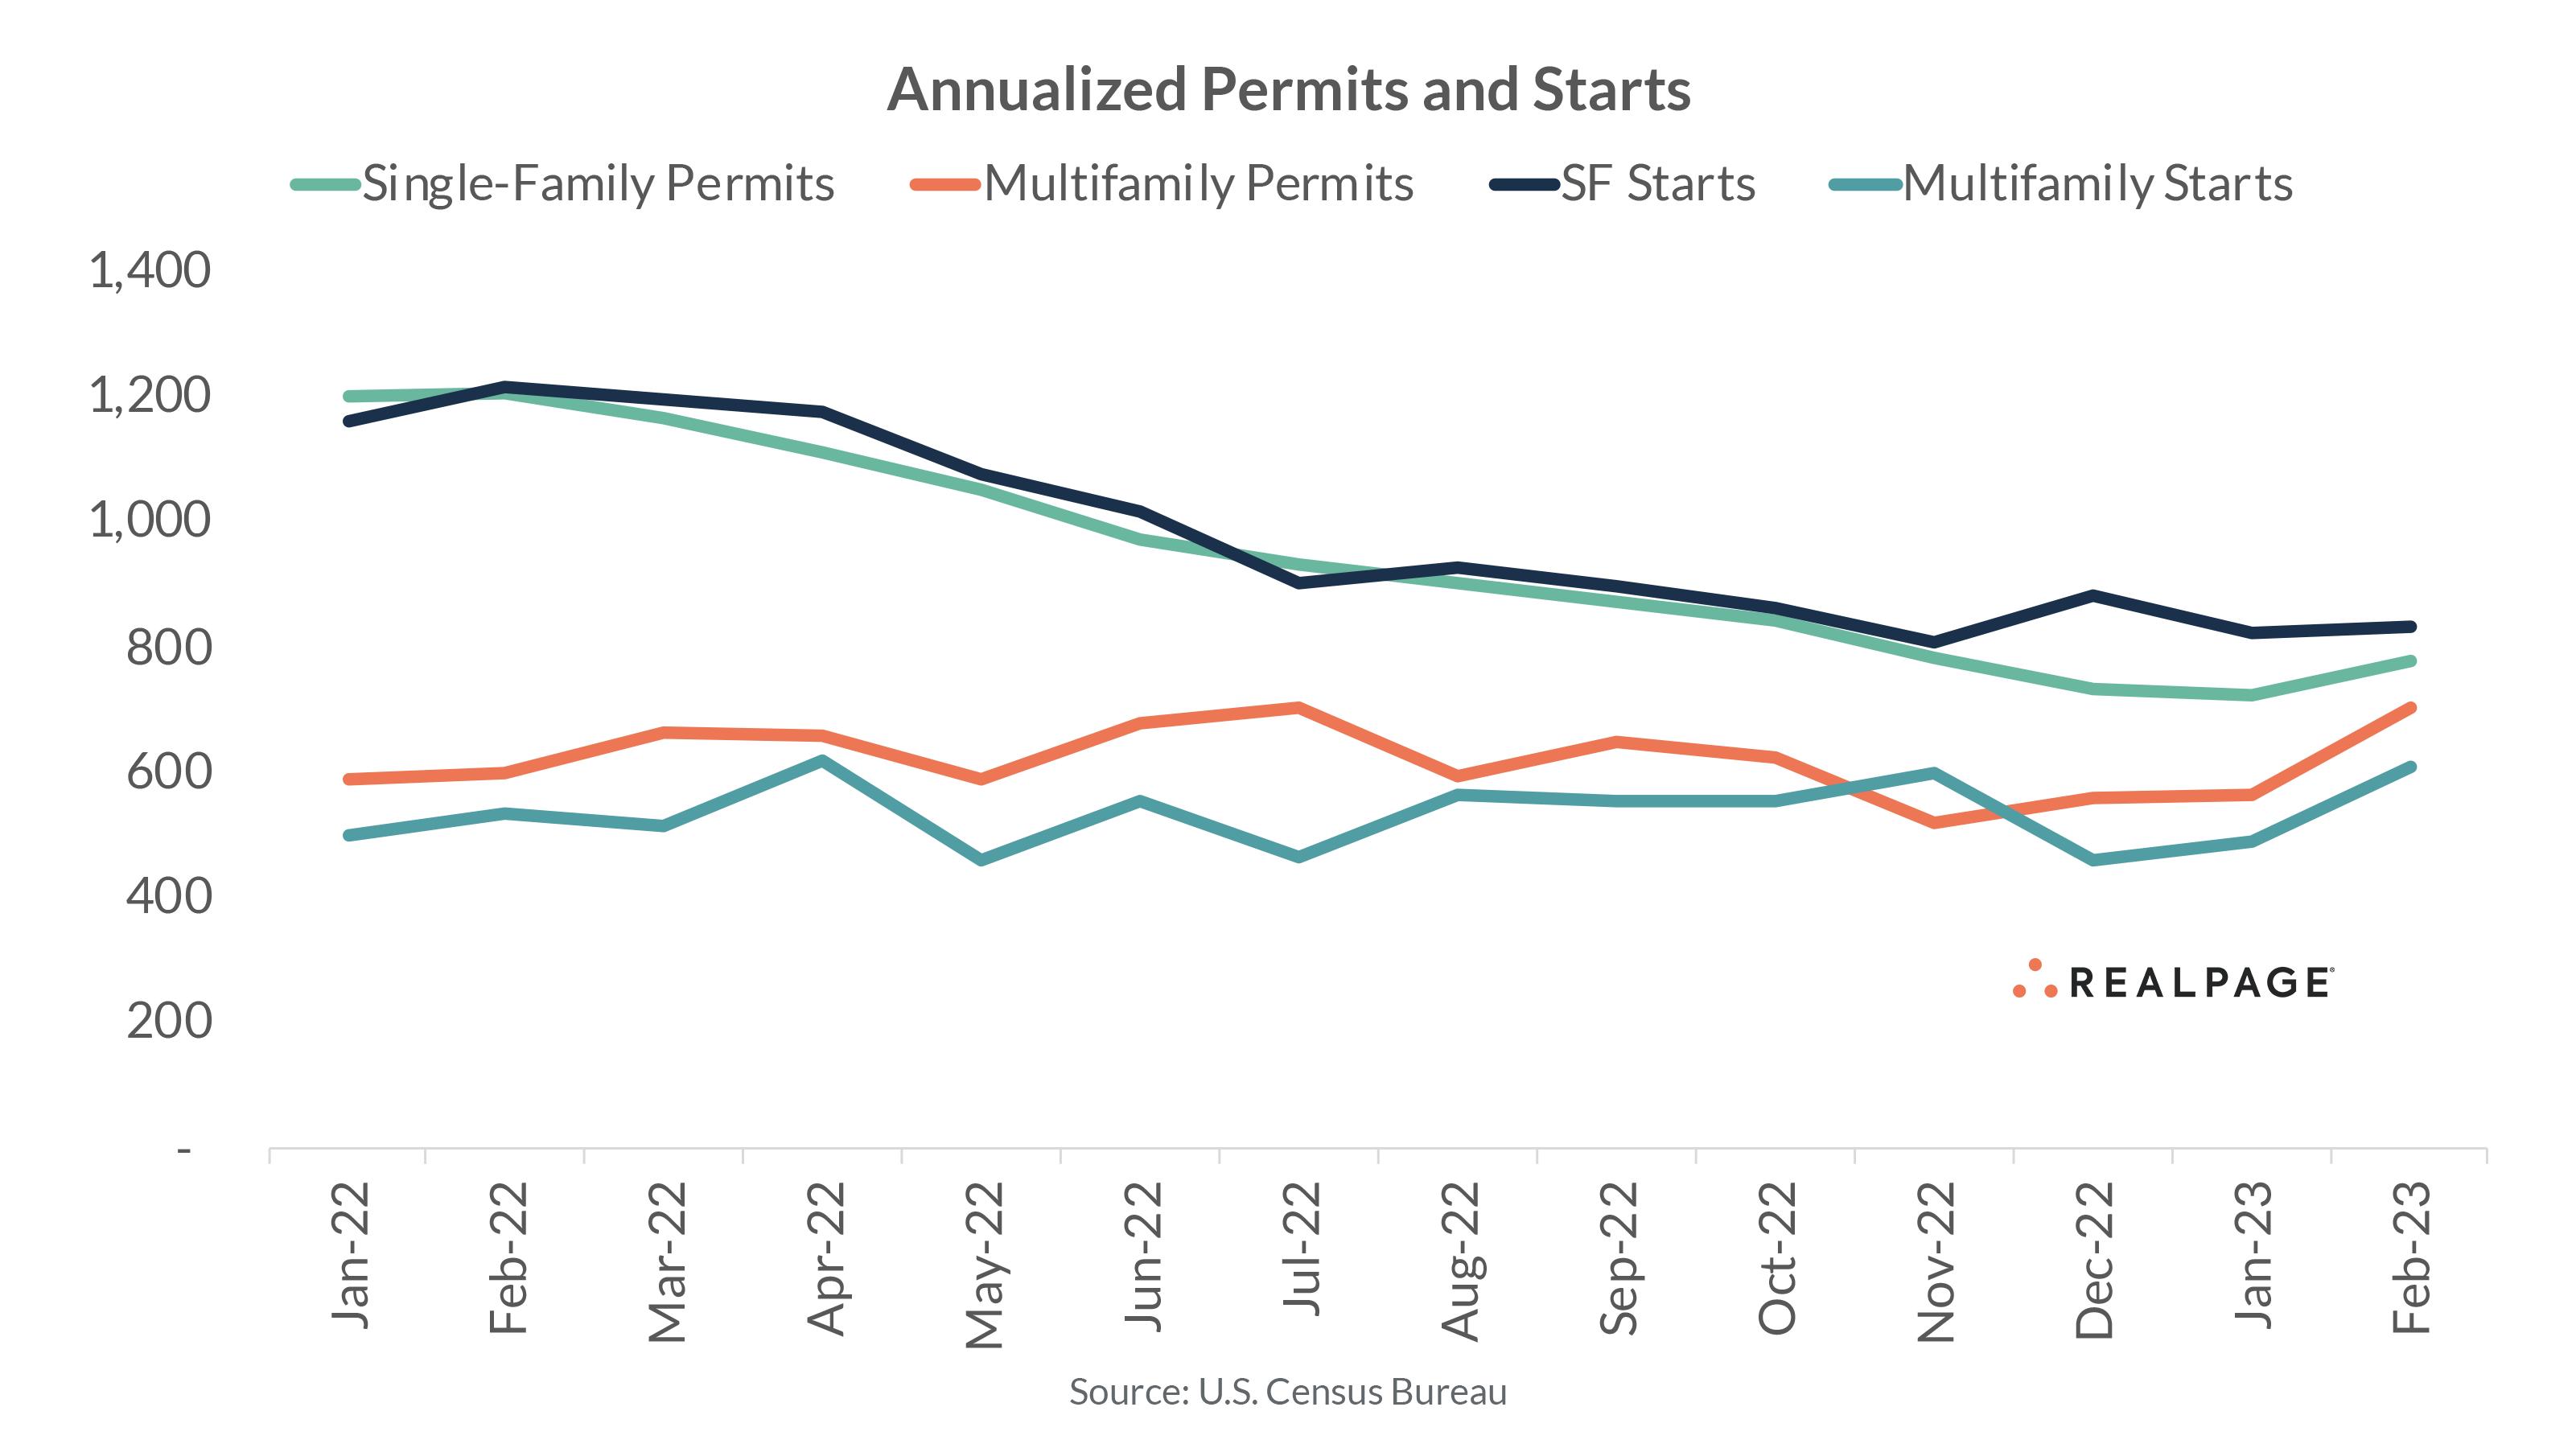
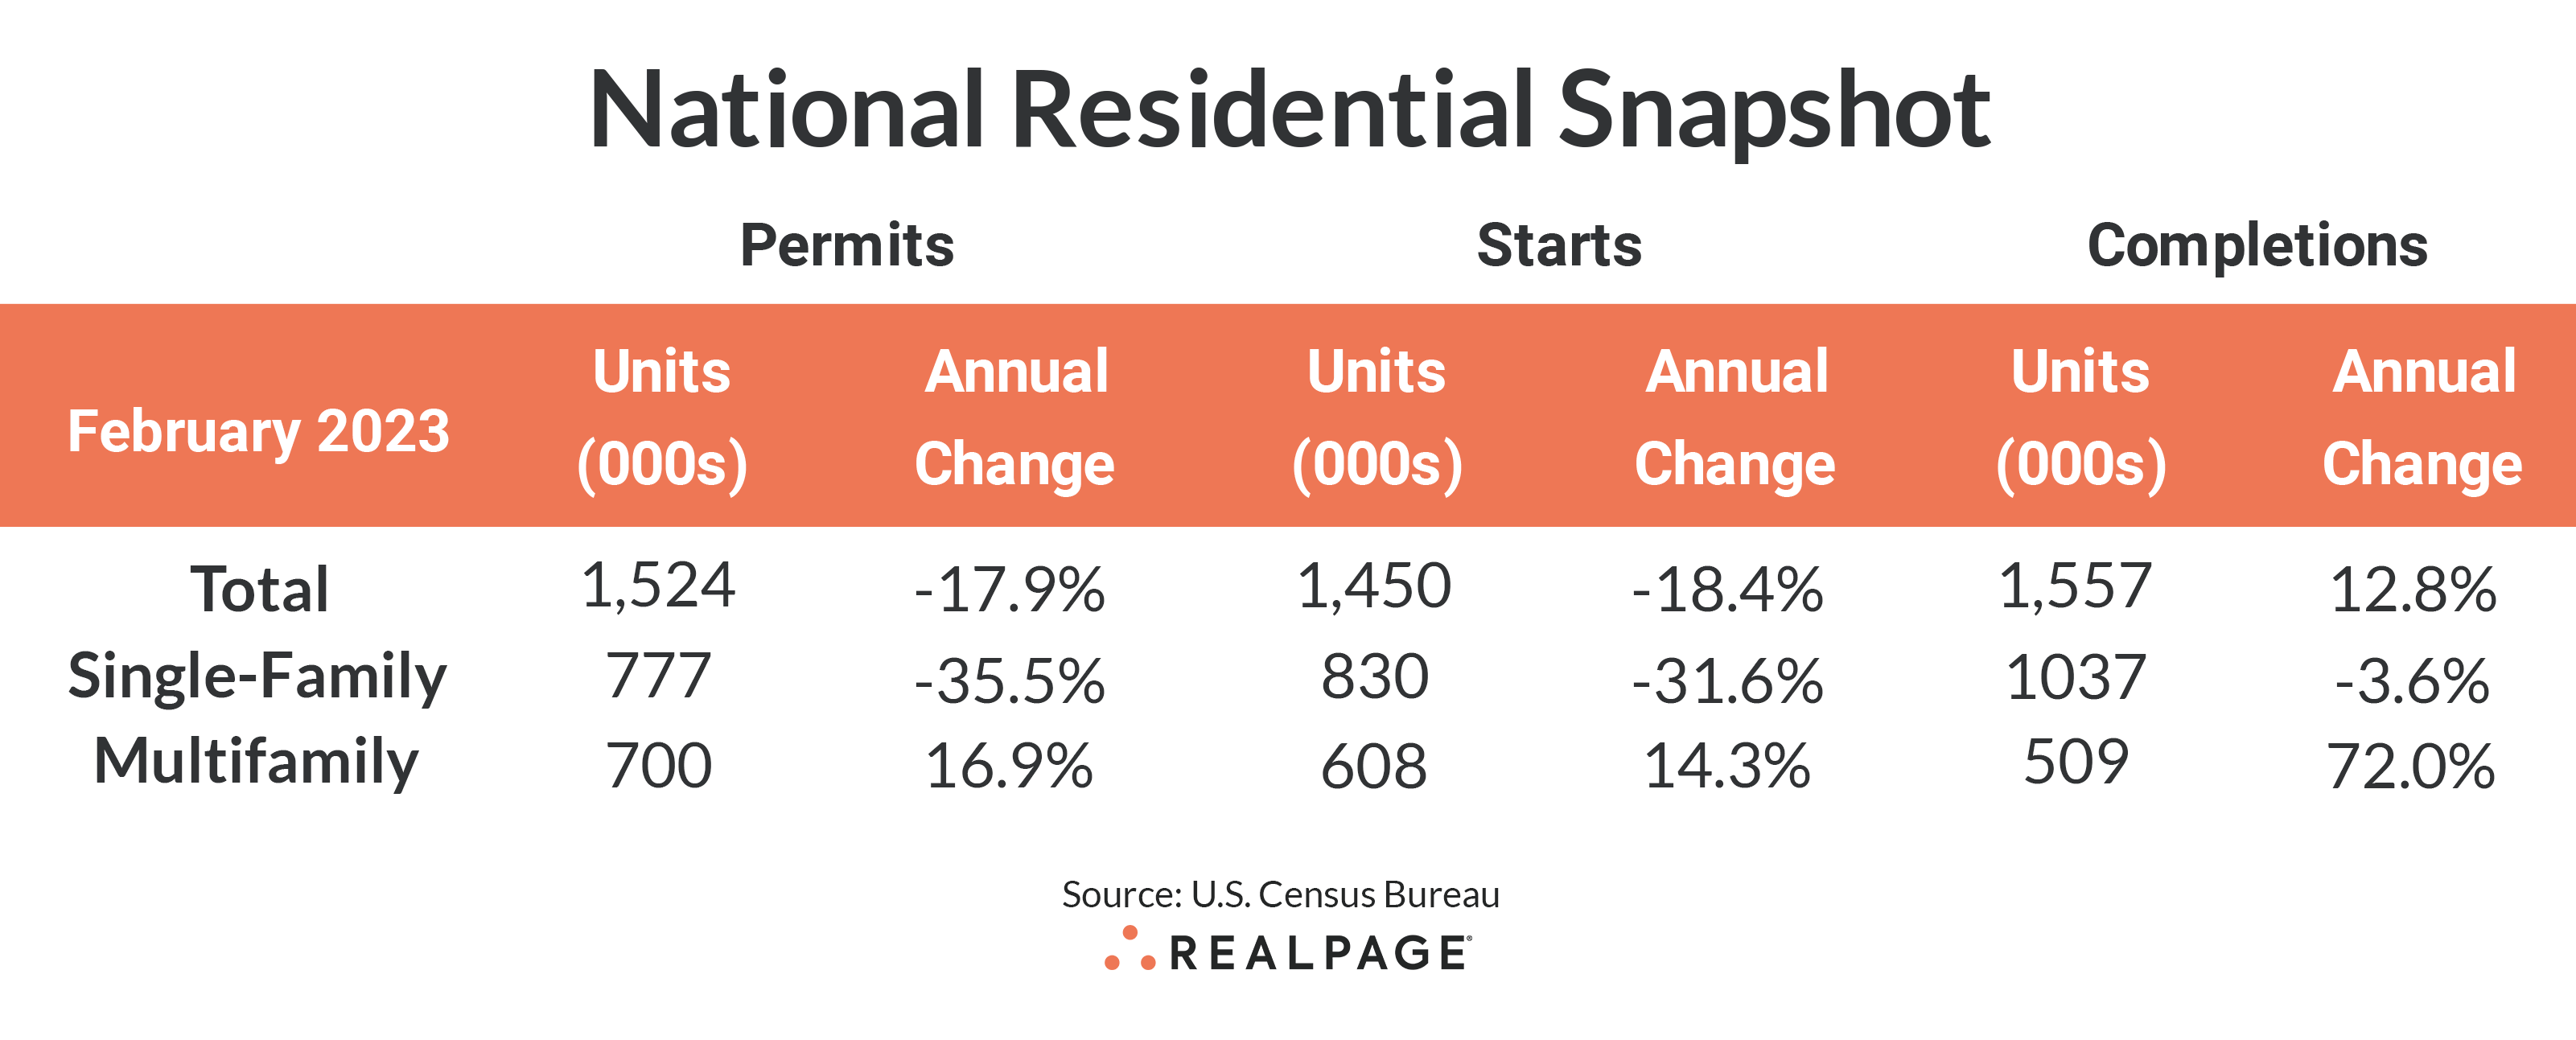
The annualized rate of multifamily permitting was up 24.3% in February compared to January (to 700,000 units), while multifamily starts jumped 24.1% from last month to 608,000 units. Year-over-year, permitting was up 16.9%, while starts were up 14.3%.
Meanwhile, single-family permitting increased 7.6% from last month to 777,000 units but were down 35.5% from last year. Single-family starts were flat compared to January (up 1.1% to 830,000 units) but also declined significantly from last year (-31.6%). With a difference of just 77,000 units, February’s annualized permitting rates for single- and multifamily units are the closest they have been since June 2015.
The ratio of multifamily permits to total residential permitting is also at its highest since 2015 at 45.9%. Historically, that ratio averages about 29%. Multifamily starts compared to total starts is elevated as well at 41.9%, compared to an average of 25%. It remains to be seen if increasing borrowing costs and financial industry concerns slow the current hot pace of multifamily development.
Multifamily completions surged 44.6% from January to 509,000 units and are up 72% from last February’s seasonally weak figure. Single-family completions were up a modest 1% in February with the annual rate reaching 1.037 million units, down 3.6% for the year.
The number of multifamily units authorized but not started increased 2.6% for the month to 160,000 units, jumping 32.2% from one year ago. The ratio of multifamily units not started to annualized permits slipped back to 22.9% from almost 28% last month. Single-family units authorized but not started fell to 130,000 units, down 13.9% from last year.
With increased permitting, the number of multifamily units under construction (941,000 units) continues to exceed that of single-family (734,000 units) and is up 22.4% from last February.
Compared to one year ago, the annual rate for multifamily permitting increased strongly in the Census’ South region (up 47.8% to 361,000 units) and in the West region (up 22.2% to 213,000 units). The Midwest fell 9.2% to 81,000 units while the Northeast region dropped more than 51% from last February to 44,000 units. Compared to the previous month, permitting was up by more than 12% in all four regions, with the West showing a solid 58.6% increase.
Multifamily starts were up in half of the four regions, with a very strong increase in the West (80.6% to 177,000 units) and a 55.1% increase in the Midwest to 107,000 units. Starts in the South were down 8.4% (to 284,000 units) and were down significantly in the small Northeast region (down 27.3% to 40,000 units). Compared to January’s pace, starts were down in only the Northeast region.
Metro-Level Multifamily Permitting
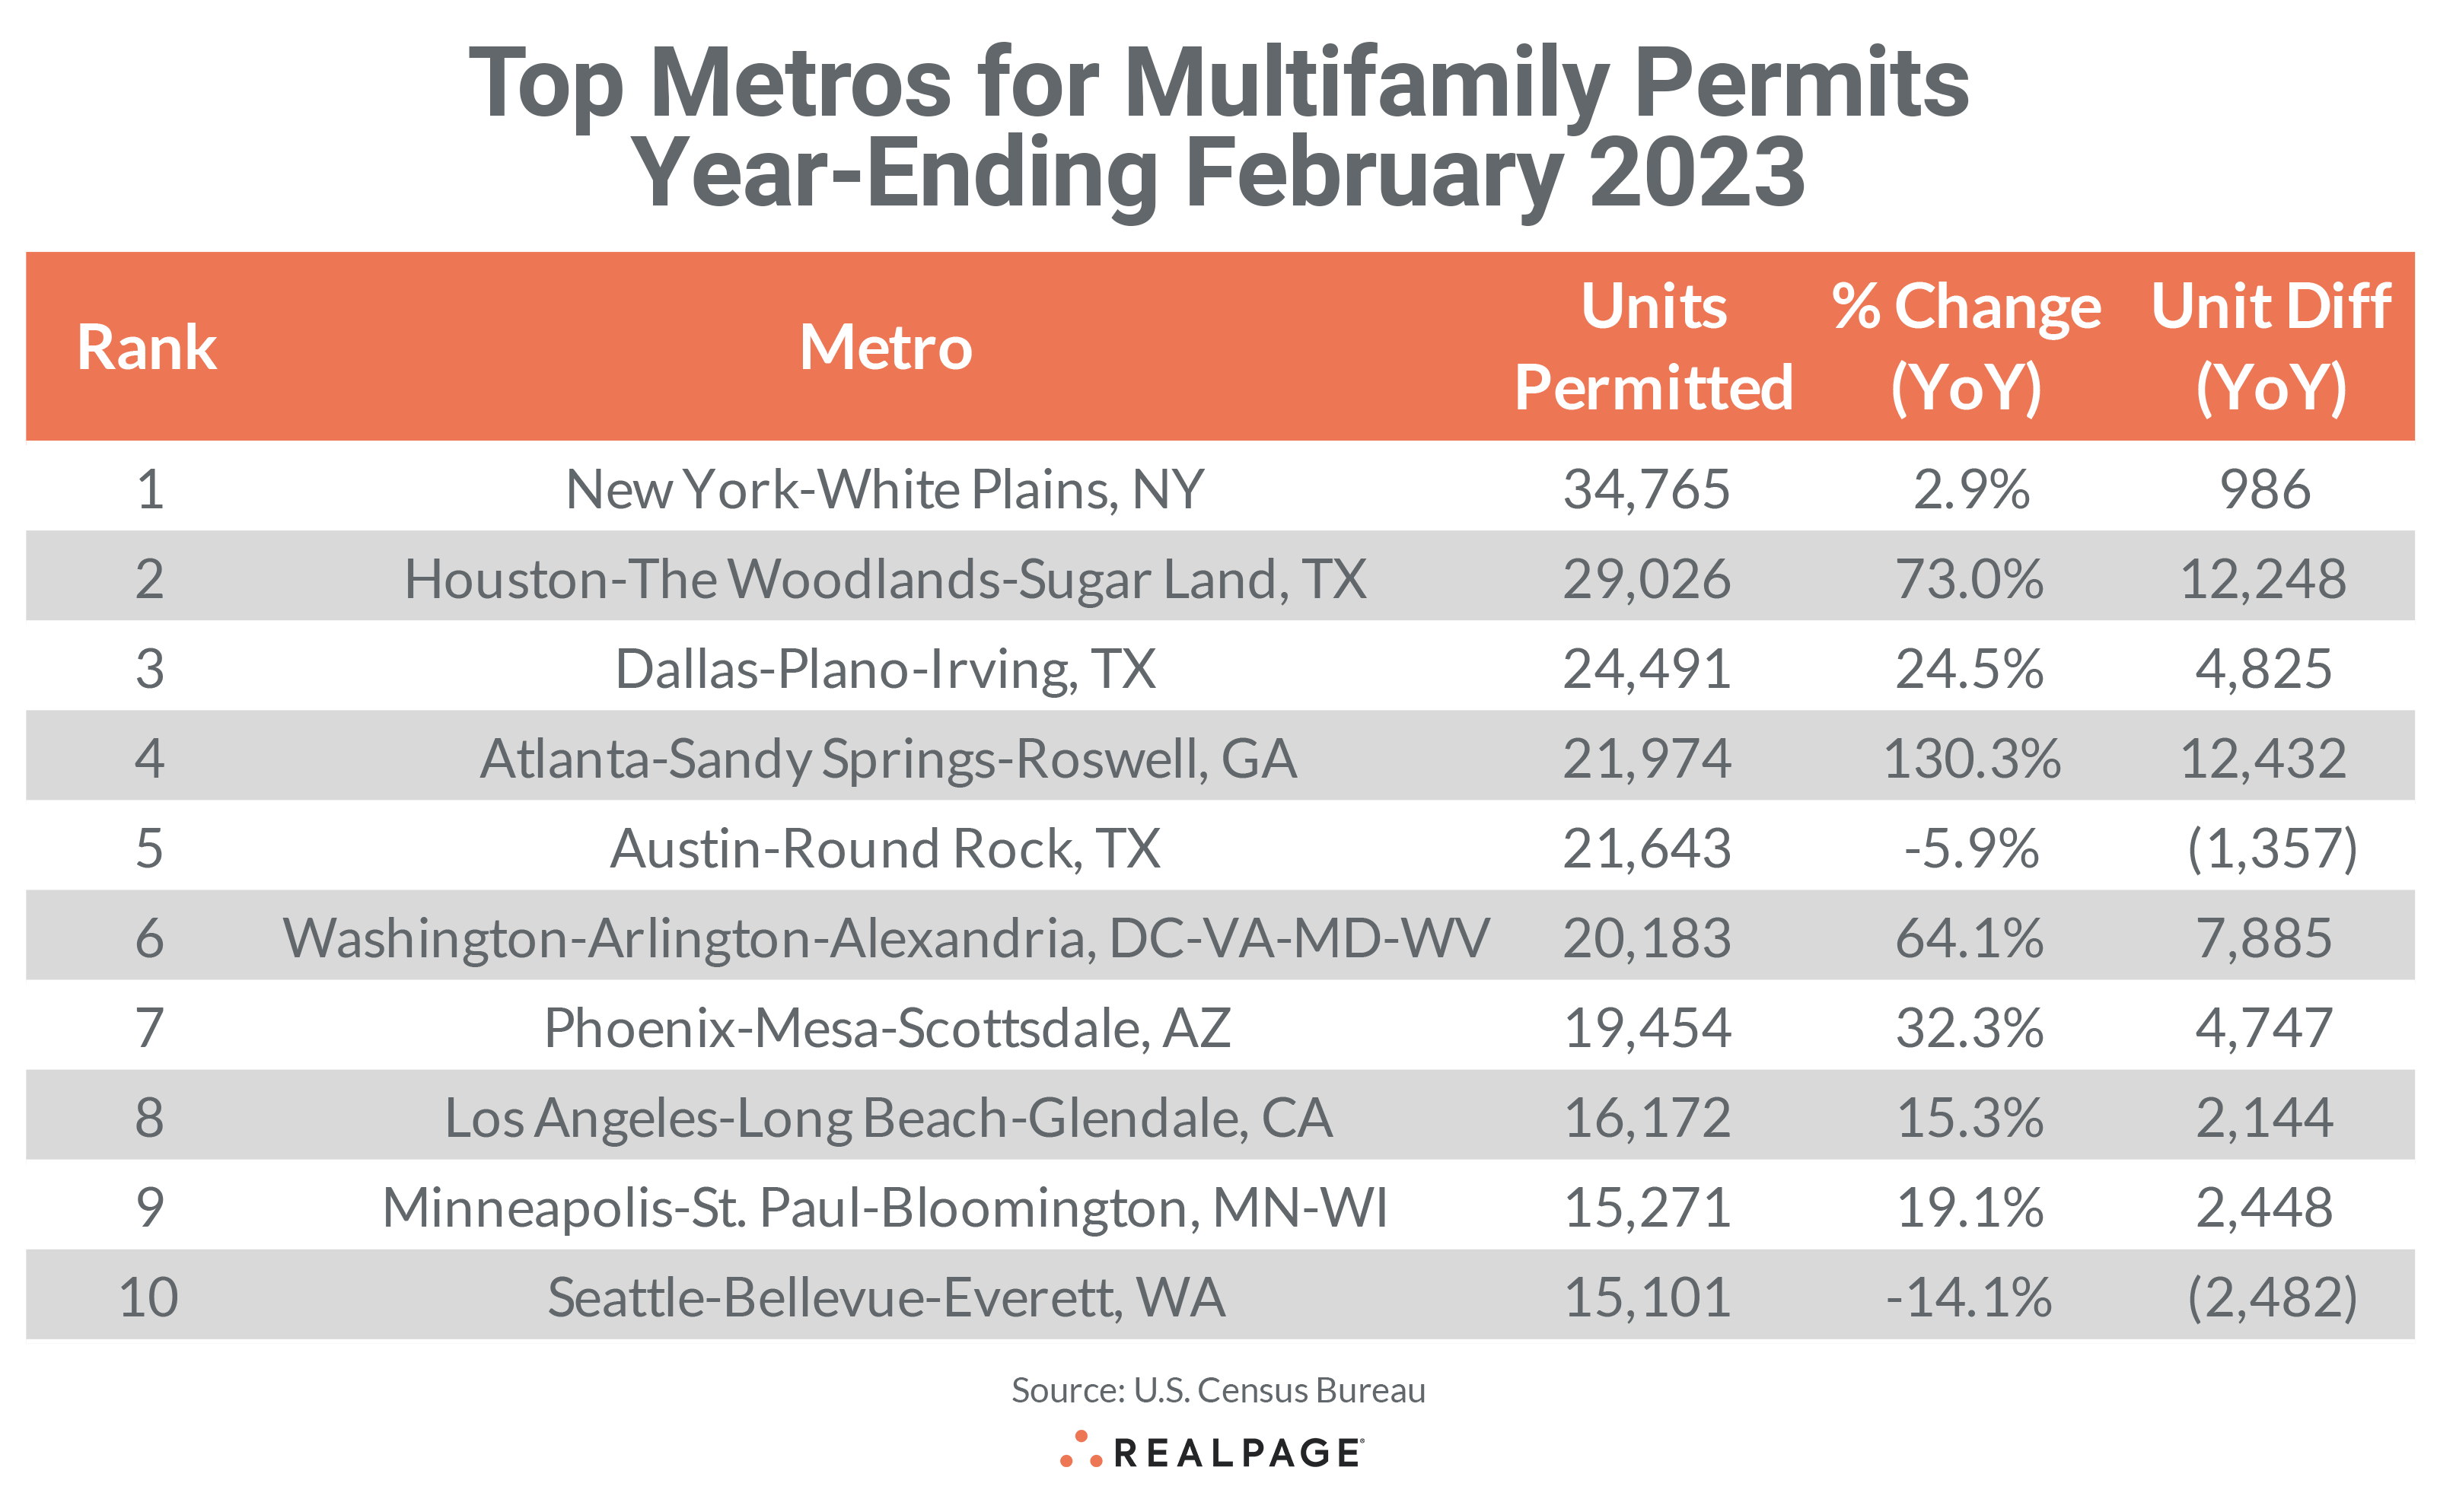
All the top 10 markets from January’s list returned in February with all remaining in order. New York continues to lead the nation in multifamily permitting, totaling 34,765 units through February, up by almost 1,000 units from last year but about 450 fewer than in January.
Houston returned at #2 with 29,026 units permitted, an incredible increase of 12,248 units from last year and the second-highest annual increase after Atlanta. Dallas retained the #3 spot with 24,491 units permitted in the past 12 months, increasing permitting by more than 1,000 units from January’s total and up 4,825 units from last year. At #4, Atlanta permitted 21,974 units in the year-ending February, surging by 12,432 units from the year before but up only 175 units from last month.
Multifamily permitting continues to cool slightly in the still hot #5 Austin market, dipping by 1,357 units for the year to 21,643 units total, while #6 Washington, DC jumped almost 7,900 units from last February to permit a total of 20,183 units for the year.
Phoenix remained in the #7 spot on the top 10 permitting list with 19,454 units permitted, about 4,700 more than last year. Los Angles also remained in the same spot as last month at #8 with 16,172 units permitted, 442 units less than in January but up 2,144 units for the year. Minneapolis-St. Paul and Seattle returned at #9 and #10, with Minneapolis increasing annual permitting by 2,448 units to 15,271 units, while Seattle slowed by almost the same amount to total 15,101 units through the 12-months ending February 2023.
Eight of the top 10 multifamily permitting markets increased their annual totals from the year before and they were generally large increases, ranging from a low of 986 units in New York to 12,432 additional units in Atlanta. Five of the top 10 markets increased multifamily permitting by at least 4,700 units over last year’s pace. Among the top 10 markets, only Austin and Seattle had decreases from last year.
Other large markets outside of the top 10 that saw significant year-over-year increases in annual multifamily permitting in the year-ending February were Tampa (+8,712 units), San Antonio (+4,766 units), Raleigh/Durham (+4,585 units) and Richmond (+2,913 units).
Smaller markets with big increases include Cape Coral-Fort Myers, FL (+2,079 units), Sioux Falls, SD (+1,894 units), Deltona-Daytona Beach-Ormond Beach, FL (+1,872 units) and Crestview-Fort Walton Beach-Destin, FL (+1,656 units).
Significant slowing in annual multifamily permitting occurred in Philadelphia (-18,668 units), Nashville (-10,624 units), Denver (-2,857 units), Charlotte (-2,656 units), Boston (-2,280 units), Salt Lake City (-2,270 units) and Oakland (-2,003 units).
The annual total of multifamily permits issued in the top 10 metros – 218,080 – was about 25% more than the 174,204 issued in the previous 12 months. The total number of permits issued in the top 10 metros was almost equal to the number of permits issued for the #11 through #37 ranked metros.
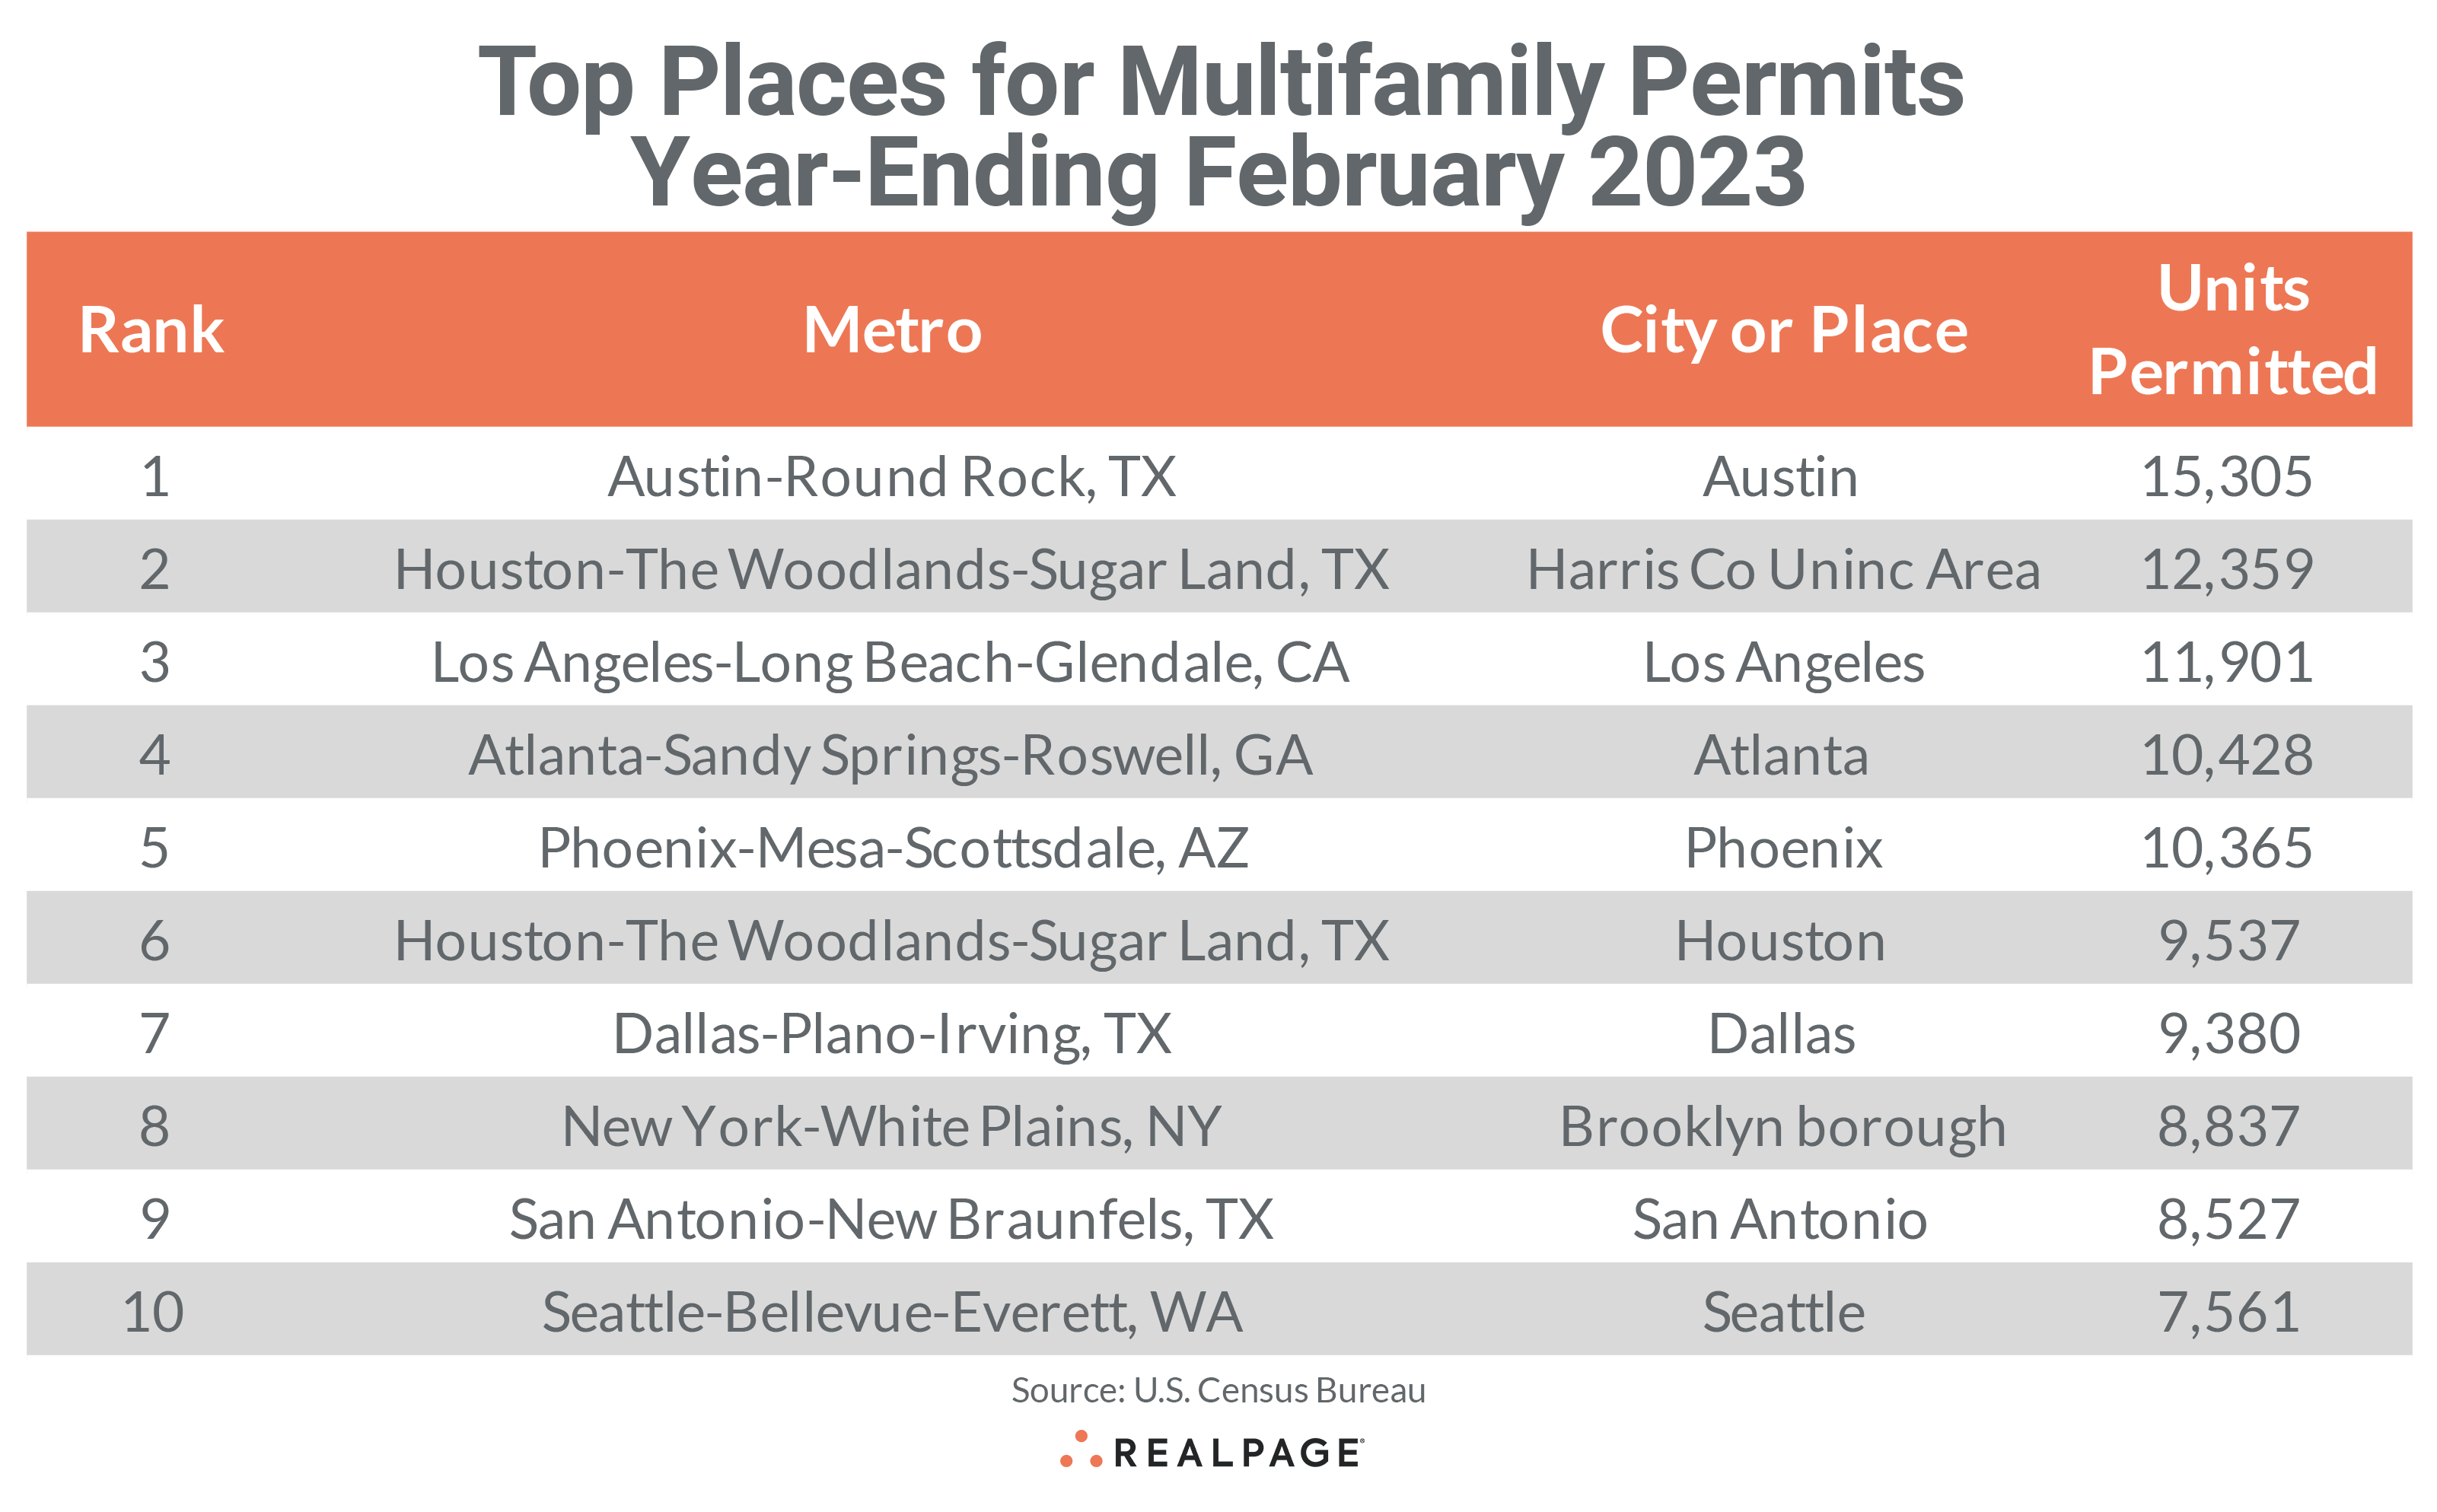
Below the metro level, all but one of last month’s top 10 permit-issuing places returned to this month’s list with the first four remaining in the same place and several others changing places. The list of top individual permitting places (cities, towns, boroughs, and unincorporated counties) generally include the principal city of some of the most active metro areas.
The city of Austin remained in the top spot with a permitting total of 15,305 units, about 1,000 units more than in January. The unincorporated portion of Houston’s Harris County remained at #2 with 12,359 units permitted, while the city of Los Angeles was close behind with 11,901 units permitted for the year. The #4 market – Atlanta – saw a decline of more than 700 units from last month’s total to 10,428 units.
The cities of Phoenix and Houston switched places at #5 and #6 with Phoenix permitting 10,365 units for the year to Houston’s 9,537 units. The city of Dallas moved up two spots to #7 with 9,380 units permitted and the Brooklyn borough and city of San Antonio slipped one spot each but permitted 8,837 units and 8,527 units, respectively. The city of Seattle moved up two spots to #10 with 7,561 units permitted, knocking Denver out of the top 10 in February.
Unincorporated Harris County (Houston) and the cities of Los Angeles, Atlanta, and San Antonio were the only top 10 permitting places on February’s list to see a decline in permitting from January’s annual total. The city of Phoenix increased annual permitting by 1,353 units from last month’s annual total.


