While we often compare suburban apartments to urban apartments for various analyses, that can be limiting when considering that suburban apartments make up the vast majority of rental housing stock. In fact, more than 85% of apartment properties across the country fall within suburban submarkets. Thus, we have bifurcated suburbs into two categories – high rent suburbs and low rent suburbs – to consider multifamily in a deeper way.
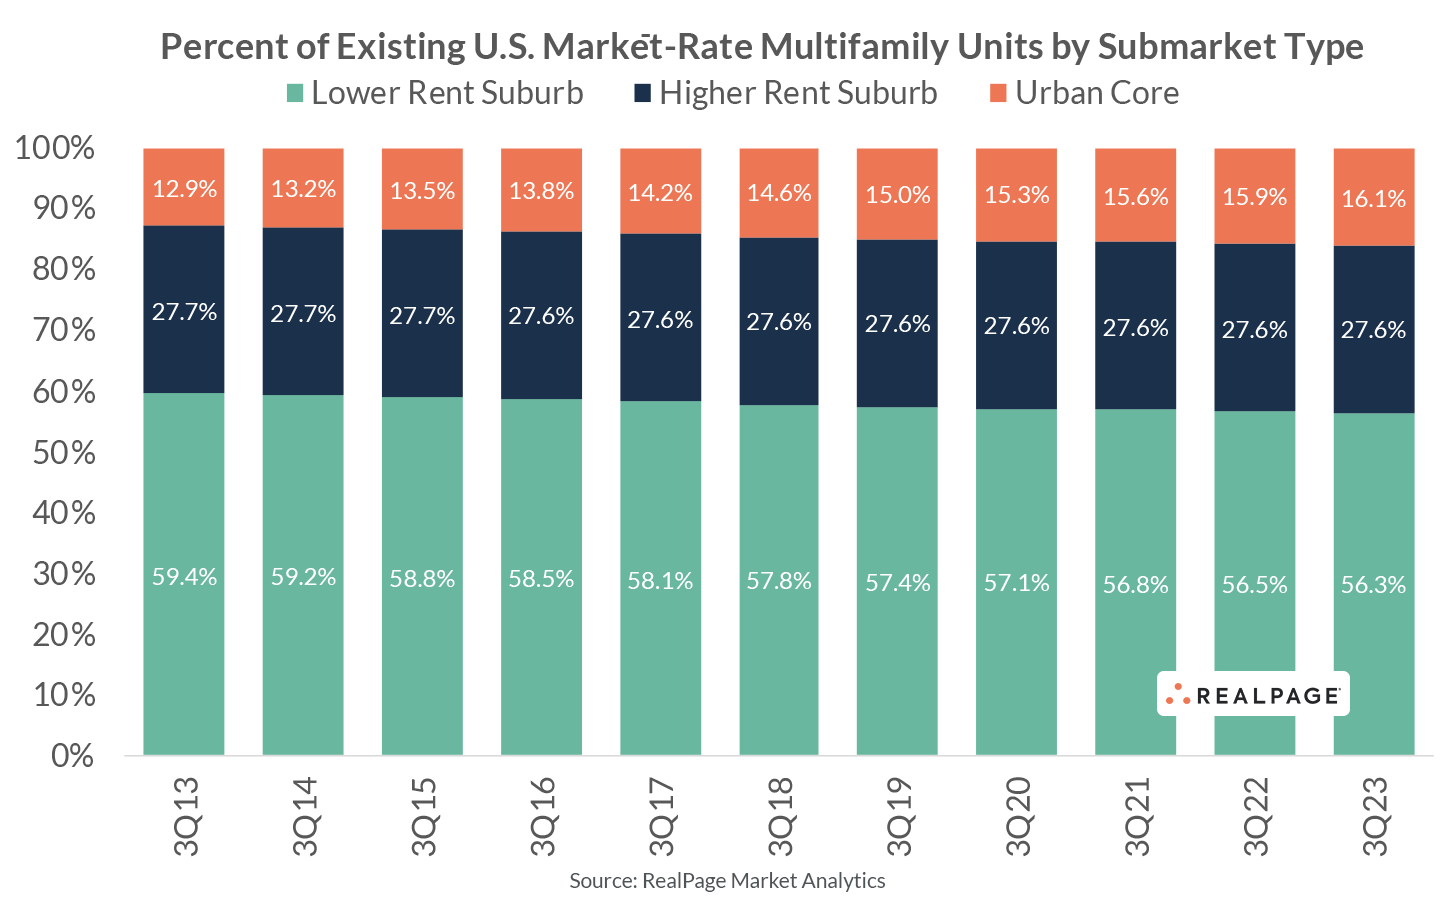
Suburban product with an average effective rent less than the market average makes up more than half of national housing stock among the nation’s top 50 apartment markets, according to RealPage Market Analytics. Low rent suburbs make up about 58% of total existing units over the last decade. Meanwhile, a little more than a quarter of market-rate multifamily housing units are in higher rent suburbs, averaging over 27% in the last decade. Finally, urban cores garner the final fraction of existing units, averaging more like 14.5% over the last decade.
Almost all urban core submarkets exhibit a rent well above their home market average. As a result, the suburban comparison will inherently skew more toward submarkets where the average rent is below a market norm.
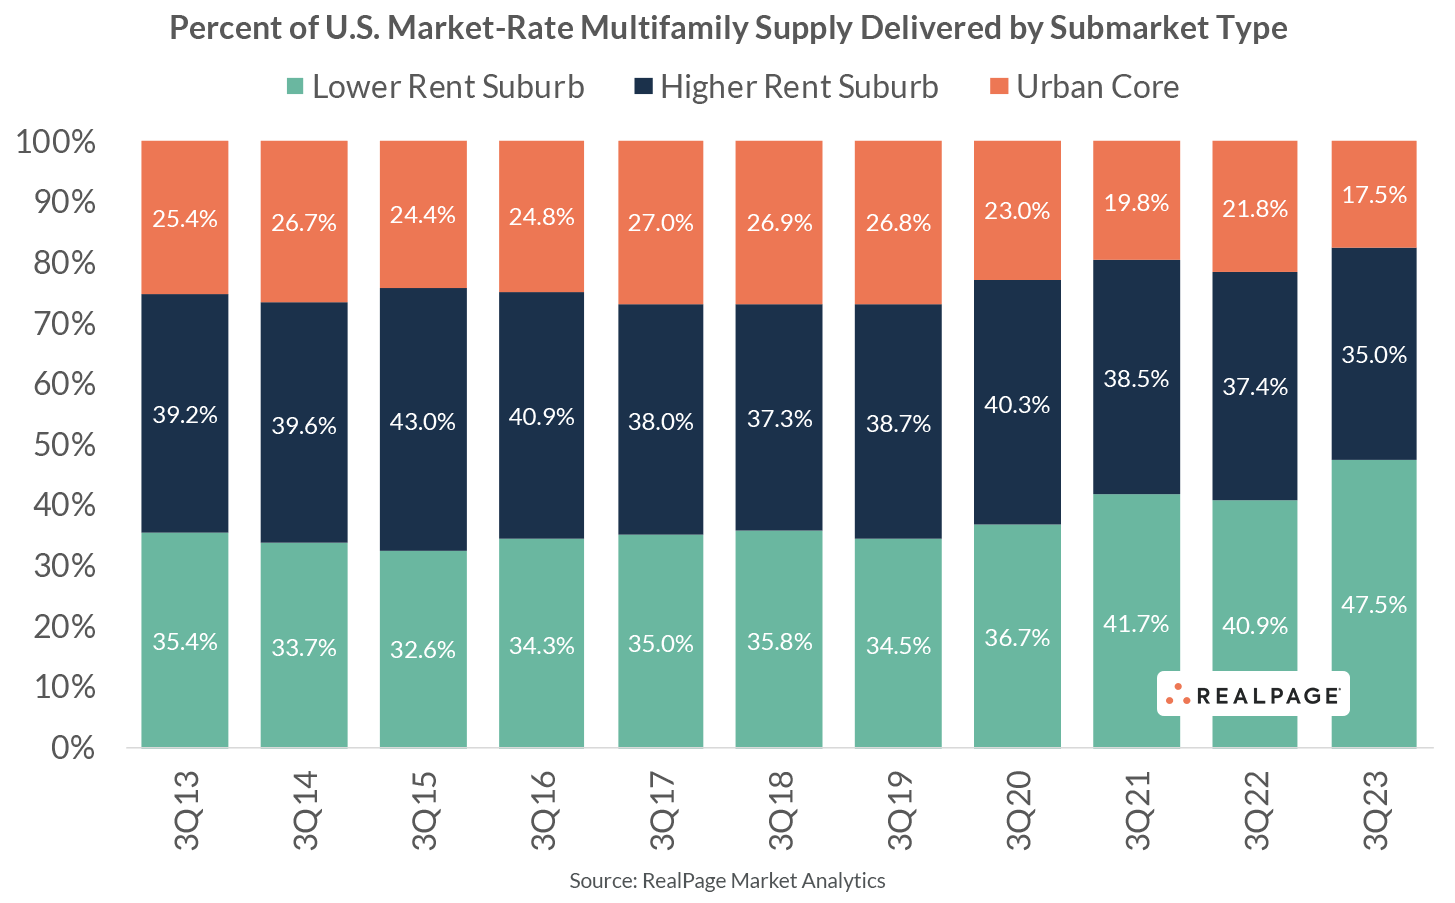
Comparing supply demonstrates how new supply largely skews towards suburban submarkets with higher rents. Arguably the most noteworthy difference between higher rent suburbs and lower rent suburbs is the share of new suburban development captured by the former versus the latter.
Though higher rent suburbs comprise just a third of the nation’s market-rate multifamily housing stock, those same suburbs were consistently delivering about 40% of all suburban construction over the past decade. Urban cores meanwhile make up about a quarter of all supply delivering (despite accounting for just 15% or so of existing stock).
In some ways, this is self-fulling prophecy. New development is almost always at the top of a geography’s price spectrum and is therefore concentrated in areas where higher rents are achievable. In this case, that favors urban cores and higher rent suburbs.
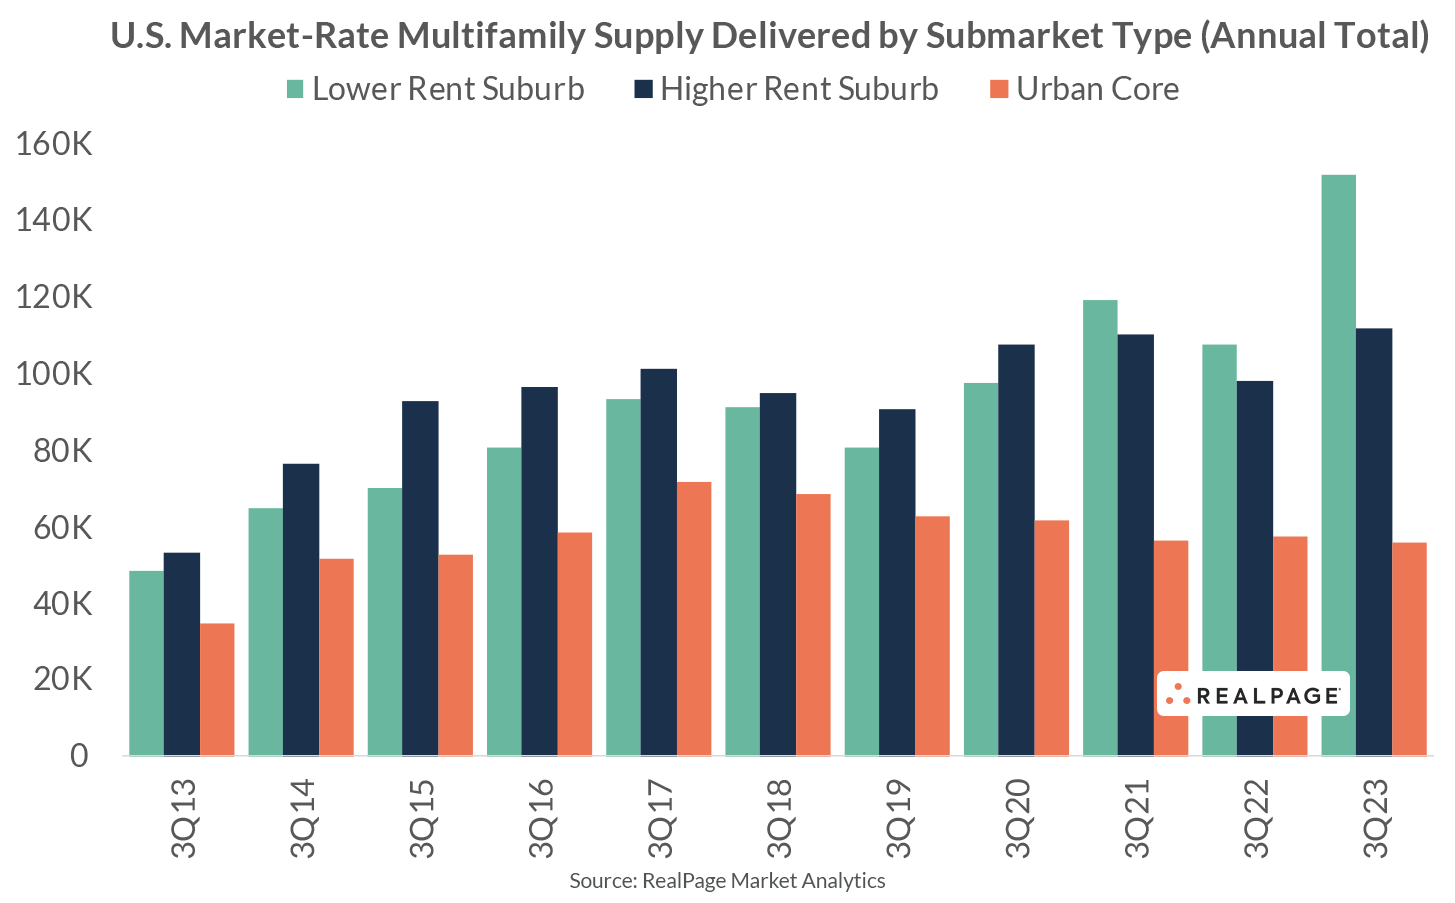
But there has been some recent deviation from that trend. For the first time in at least a decade, the amount of supply delivering in lower rent suburbs is far greater than that of higher rent suburbs. Though this trend began to emerge in 2021 and held through 2022, the 2023 figure shows that close to 50% of market-rate multifamily units delivered to lower rent suburbs.
More development in lower rent suburbs can be attributed to several factors. For one, land prices naturally play a role in dictating where supply delivers. In other words, as land prices increase in more established (and in turn, higher rent) suburban areas, then development moves further out.
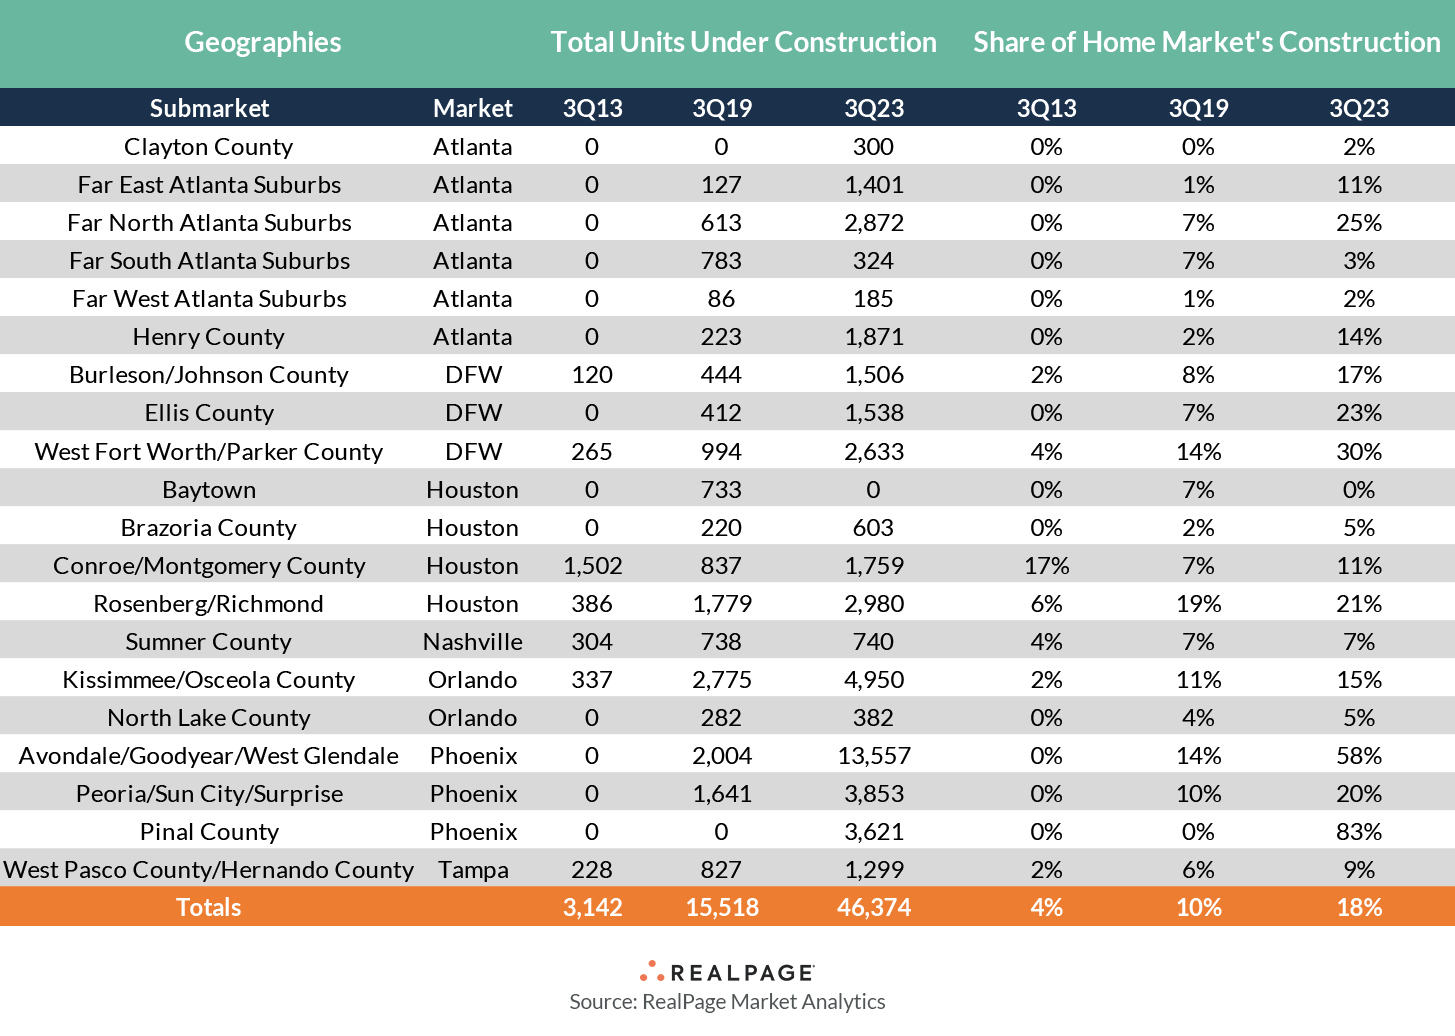
The following collection of submarkets highlights several markets known for urban sprawl. Far outer lying submarkets (arguably even “exurban” 10 years ago) in these markets informed just 4% of their markets’ share of development in 2013. That jumped to 10% as of 2019 but has since shot up to nearly 20% as of 2023.
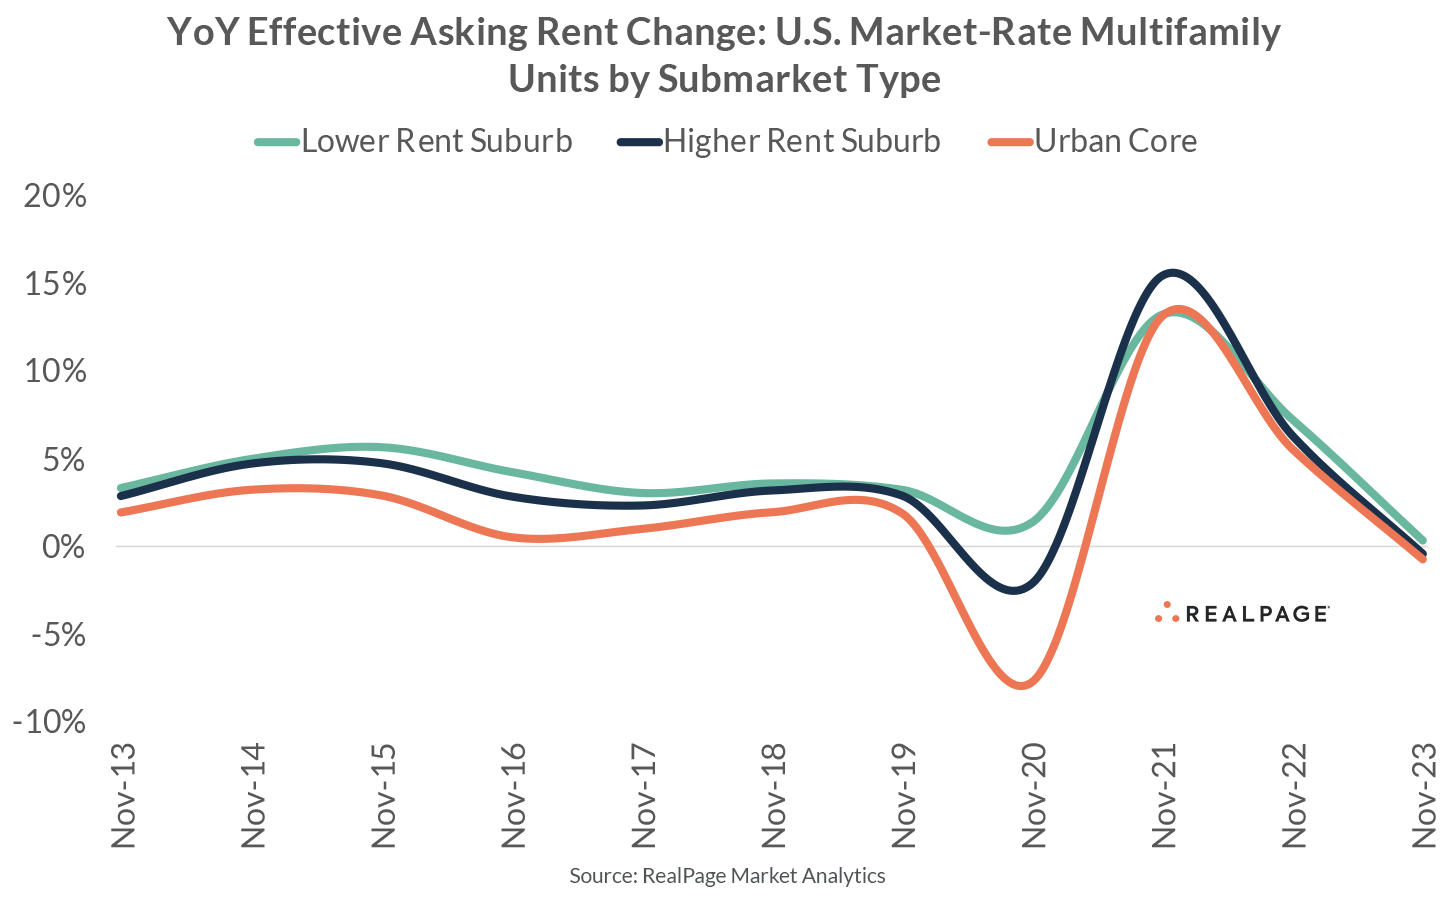
Rent growth in low rent suburbs has outperformed higher rent suburbs (and urban core) counterparts over the past 12 months – albeit to a modest degree. The increased volume of supply in areas with lower rental rates could be one of the driving forces behind the slowdown in Class B rent growth over the past 12 months. Class B units tend to be more concentrated in lower rent submarkets. Indeed, lower rent suburbs are seeing Class A rents grow by 1.0% as of November 2023, versus 0.3% for the submarket grouping on aggregate.
