Class A Rent Performance Weighing Down Some Apartment Markets

Across the U.S., apartment rent growth all but halted on an annual basis in August, though market-level readings varied.
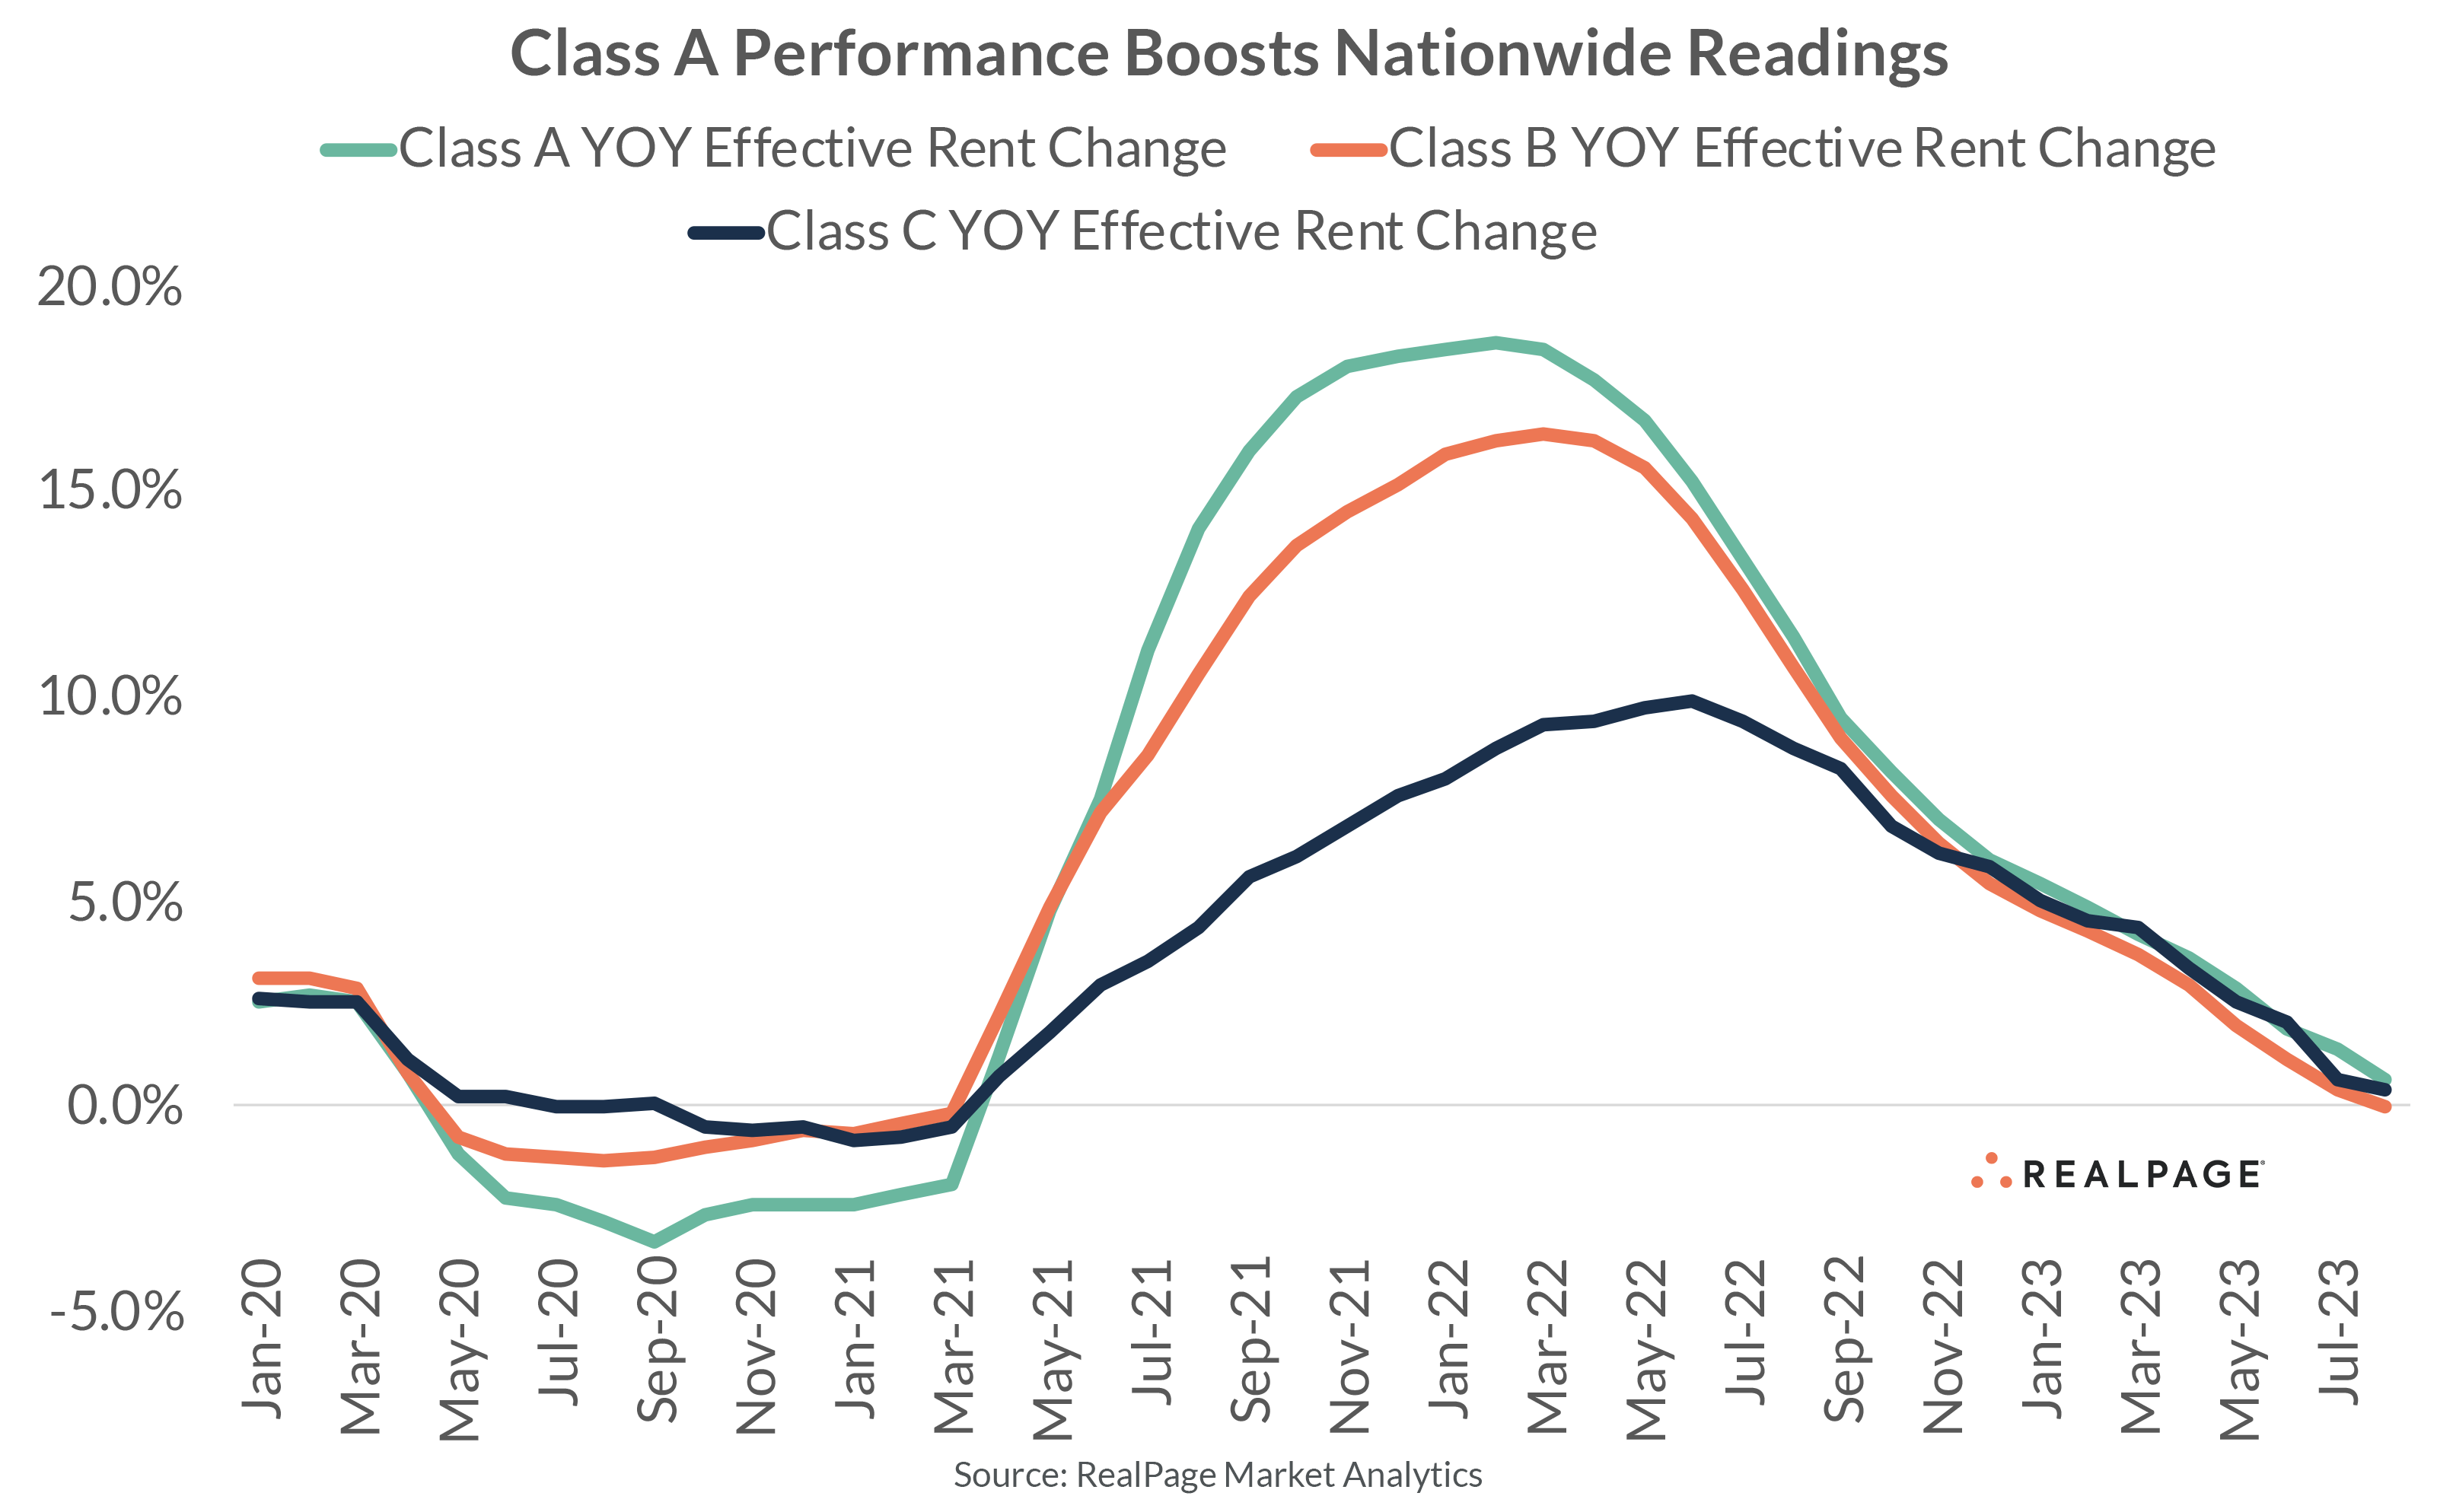
Class A rent change, however, boosted nationwide performance on aggregate. As of August, annual effective rents climbed 0.7% in the Class A space, followed by stagnant rent change (0.0%) in Class B units and a weaker reading (0.4%) in Class C units. Overall annual effective asking rent change was just 0.3% across the U.S. as of August, according to data from RealPage Market Analytics.

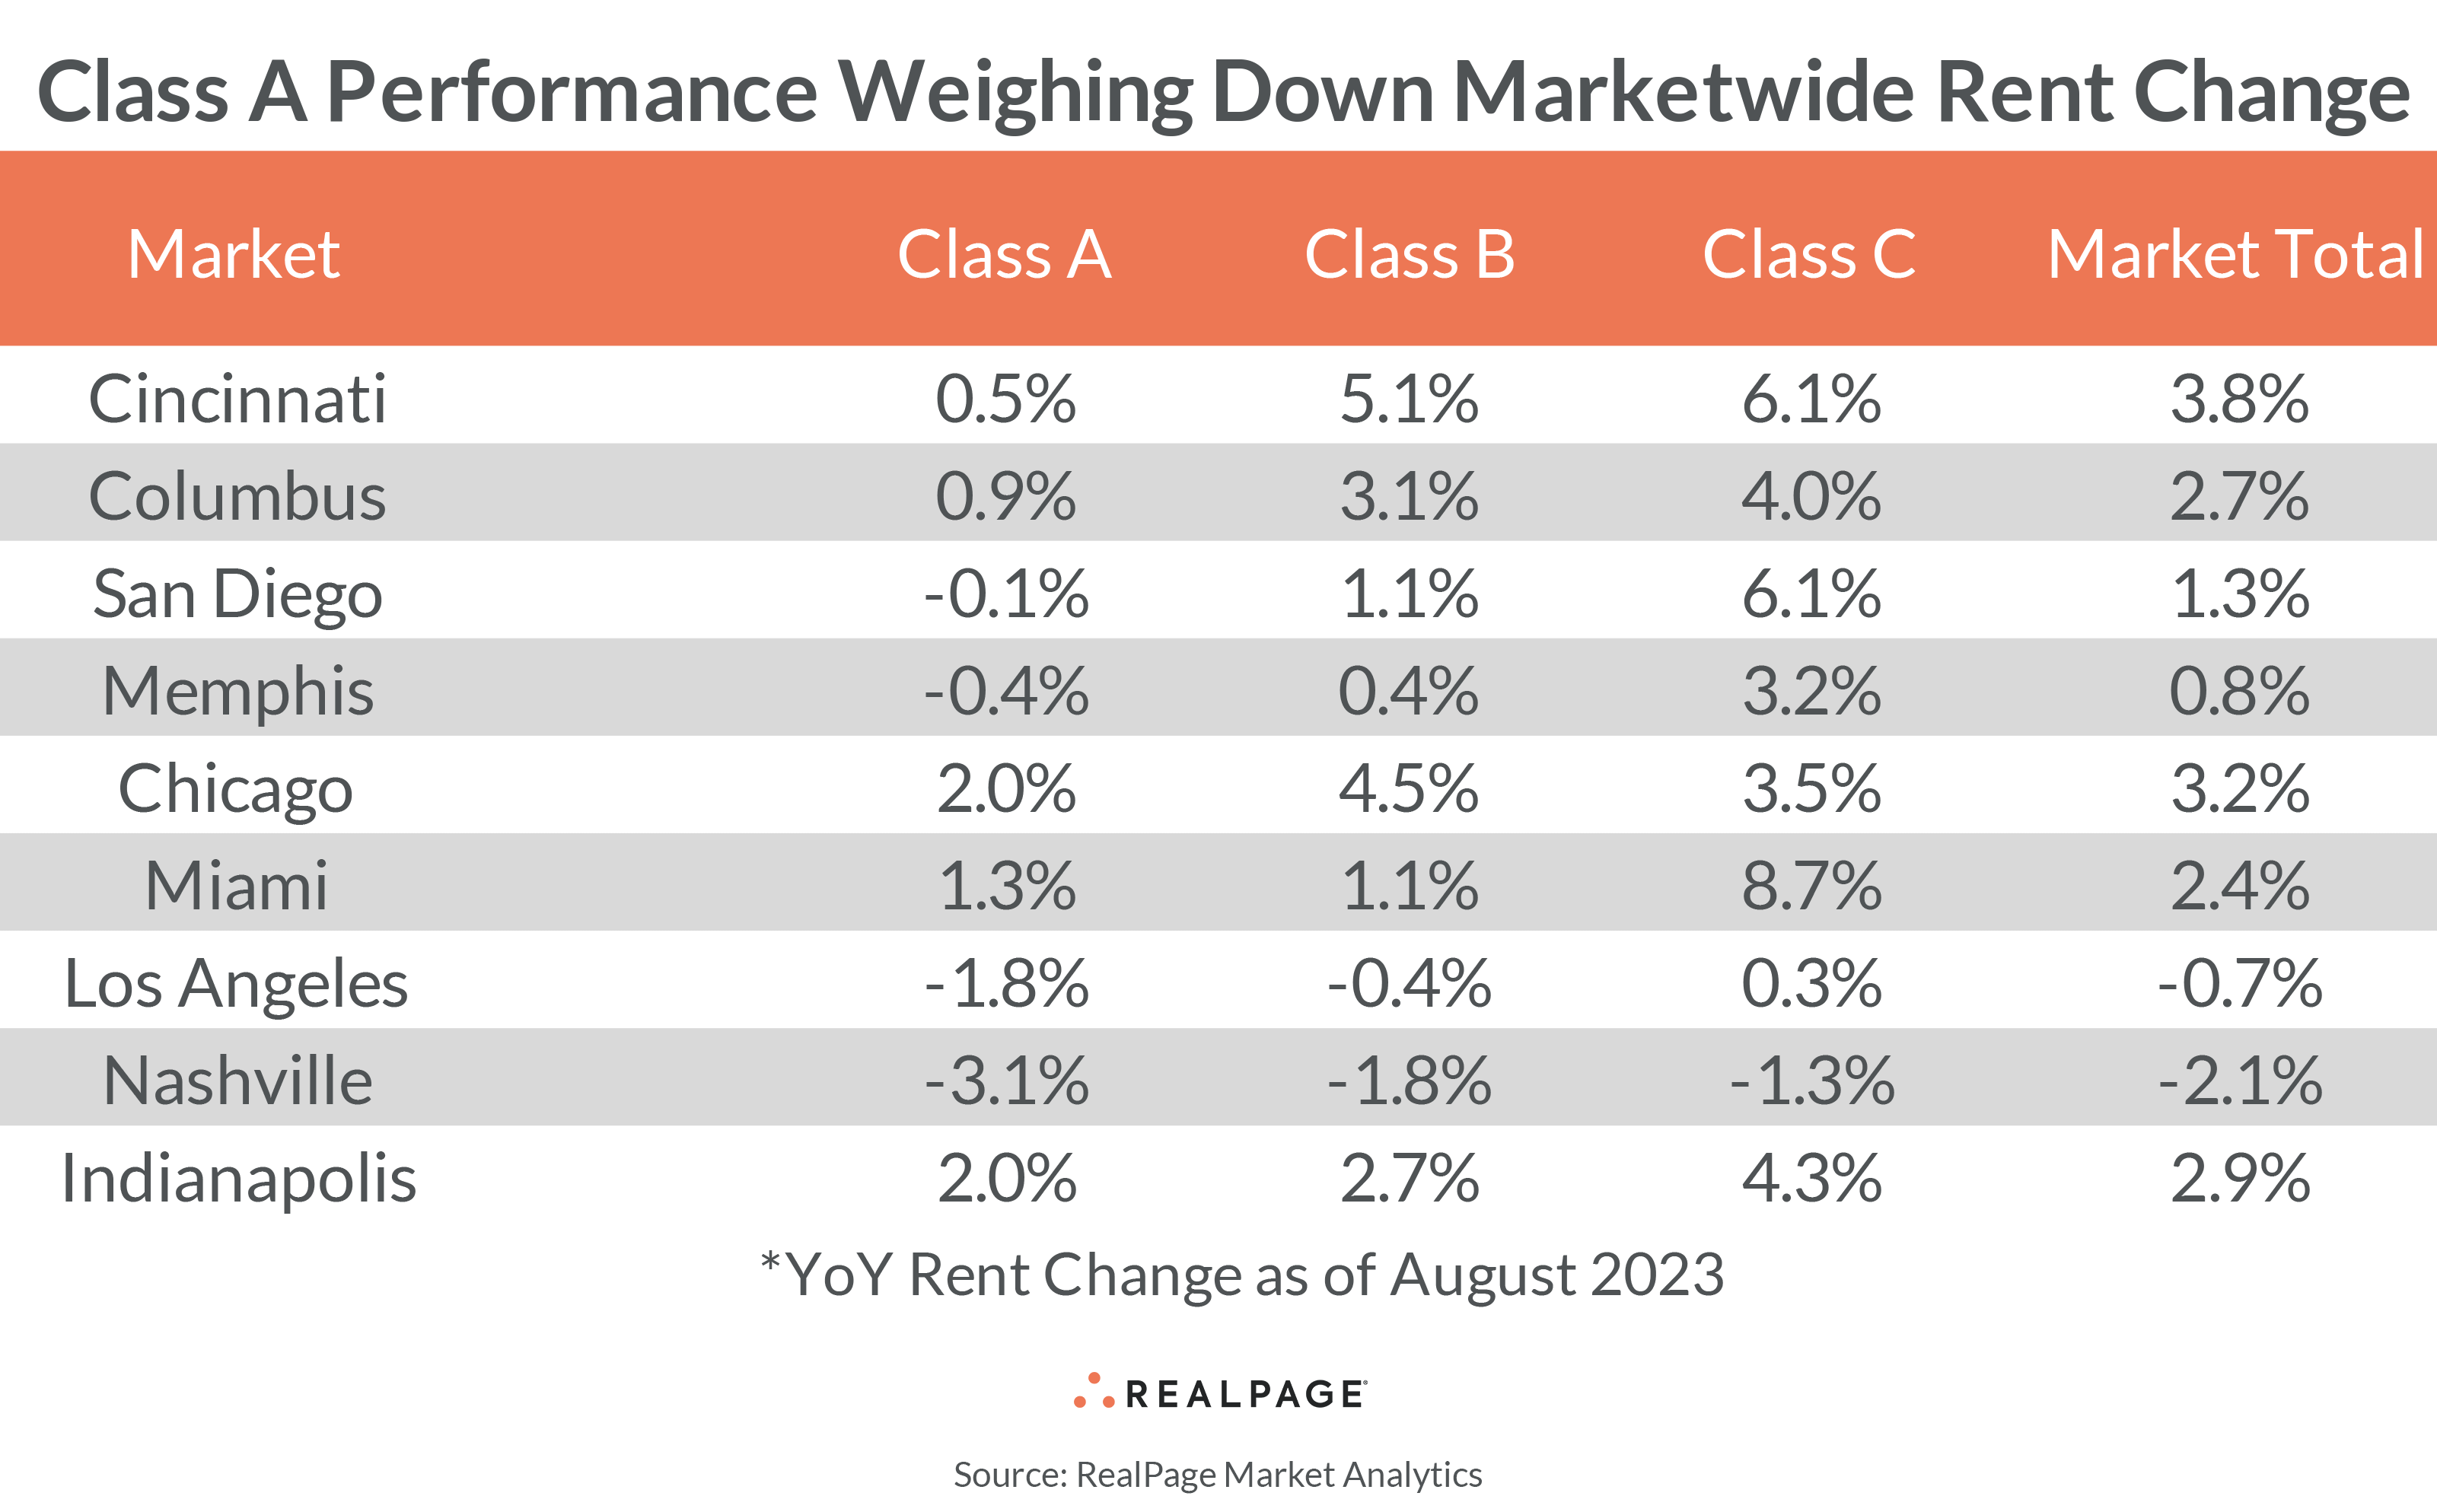
In some markets, however, that storyline runs counter to current rent performance by product class. In several of the nation’s largest apartment markets, rent change in Class A units – often a proxy for new supply – is weighing down marketwide readings. In some markets, Class A rent change runs 700-plus basis points (bps) below Class B and C readings and as deep as 300-plus bps below market averages.
Cincinnati marks arguably the most extreme example of this Class A underperformance. As of August, Class A rents were growing just 0.5% on an annual basis in Cincinnati, compared to readings above 5% in Class B and Class C units. At a 3.8% annual rent growth reading, Cincinnati is one of the nation’s top rent growth performers in August, ranking no. 2 among the nation’s 50 largest markets, behind only Newark.
About half the markets on this list follow a similar trend. Columbus, Chicago, Miami and Indianapolis all rank among the top 10 markets nationwide for rent change in the year-ending August. The Midwest markets on this list also generally have low supply pressure that tends to impact Class A rents more than less expensive product classes.
The remaining markets present a mixed bag of results. The West Coast continues to see the highest share of markets posting rent cuts, though San Diego remains a strong performer by regional standards. San Diego is one of the nation’s most expensive apartment markets with average rent hitting $2,861 in August. Average Class A rents in San Diego ($3,303) run at a nearly $1,200 premium to average Class C rents ($2,187). Thus, San Diego might be better characterized as a market where Class C units outperform than as a market where Class A underperforms.
The same could be said in Miami, where average Class C rents ($1,778) run about 45% less expensive than Class A ($3,208) counterparts.
Nashville may seem like a wildcard on this list until layering in the context of its simply massive supply pipeline. In the year-ending 2nd quarter 2023, Nashville added over 10,000 new units, growing existing inventory over 6%. And another 29,000 units are under construction in Music City, with about 13,000 of those expected to come online over the next four quarters. Class A rent cuts of 3.1% in August were likely a result of operators preserving occupancy amid lease-up pressure from new product.
Meanwhile, a handful of markets demonstrate the opposite storyline. In Sacramento, Tampa and West Palm Beach, Class B and C product classes reported annual rent cuts in August while Class A product reported rent growth, clearly boosting marketwide rent performance.


