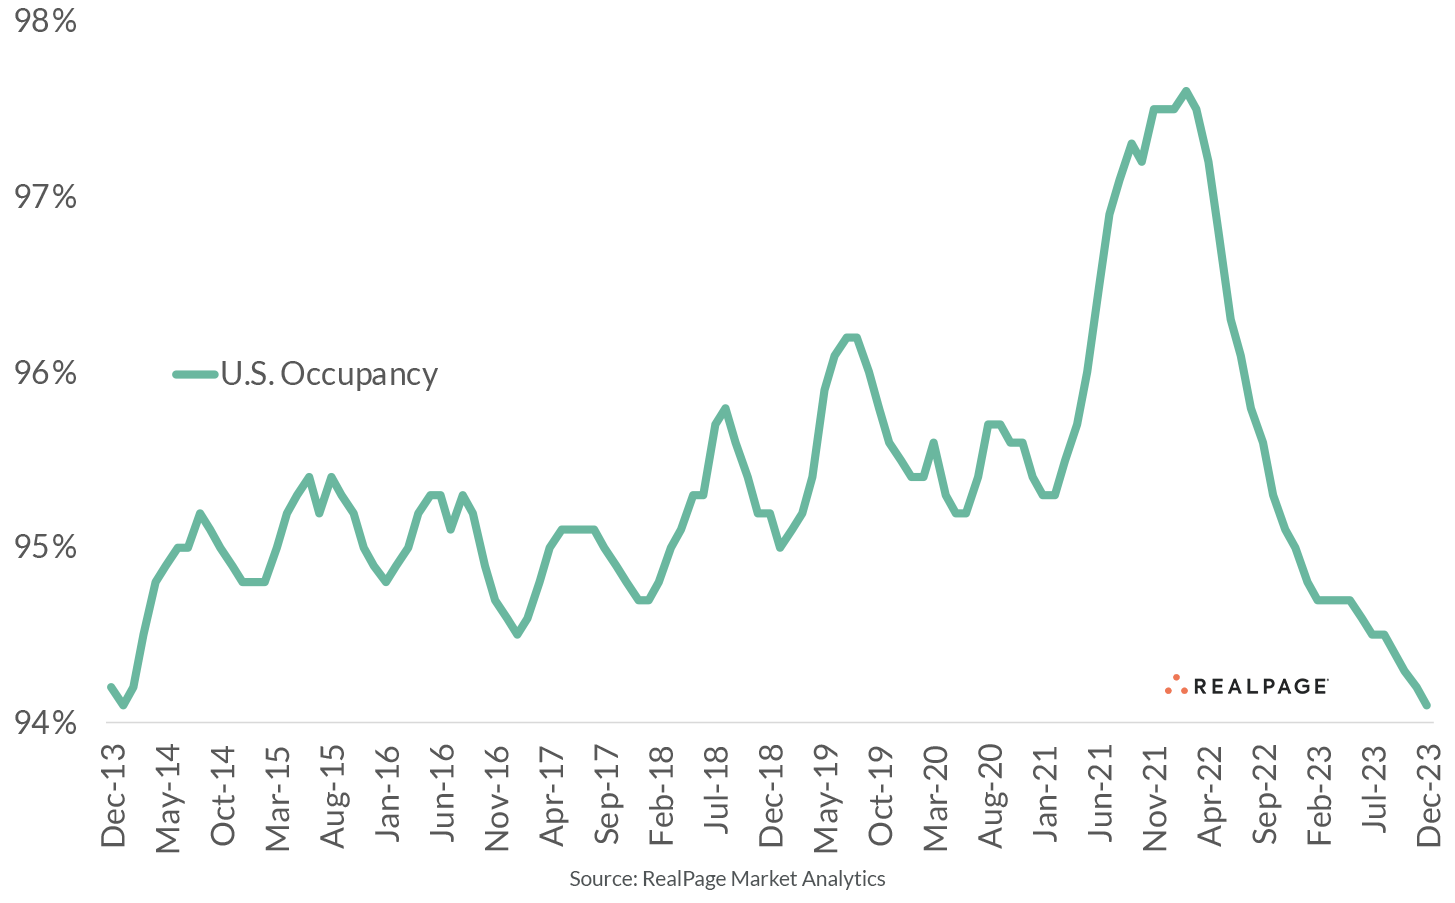
U.S. apartment occupancy hit a 10-year low at the end of 2023, as sizable new supply volumes weighed on market fundamentals. But some markets bucked that trend.
After the worst of the COVID-19 pandemic, as the country started to open back up at the end of 2021 and the first few months of 2022, apartment occupancy – and prices – saw a drastic hike. Feeling renewed, developers rushed to permitting offices nationwide to have projects approved for construction, resulting in one of the most intense apartment supply pipelines since the 1980s.
Amid those record deliveries hitting the market, however, the landscape has changed. At 94.1%, December 2023 occupancy was the lowest the nation has recorded since January 2014, when the rate was also at 94.1%, according to data from RealPage Market Analytics. December 2023 occupancy registered more than 100 basis points (bps) behind the nation’s decade average of 95.4%.
However, December occupancy stood a few ticks above the 10-year norm from the 2004-2014 decade (93.9%), despite the U.S. apartment market undergoing an accelerated construction boom since then.
Across the nation, most apartment markets logged December 2023 occupancy below their 10-year averages. Only a handful of exceptions existed, and all of those were smaller apartment markets that have undergone a rapid transformation in the last decade. Even more rare were markets with occupancy well ahead – by over 100 bps – of decade norms. That group is very small, including college towns Champaign-Urbana, College Station-Bryan, New Haven-Milford and boom/bust prone Midland/Odessa.
Most of the largest 50 apartment markets, on the other hand, logged occupancy behind their 10-year averages. And supply has been the clear culprit in these markets.
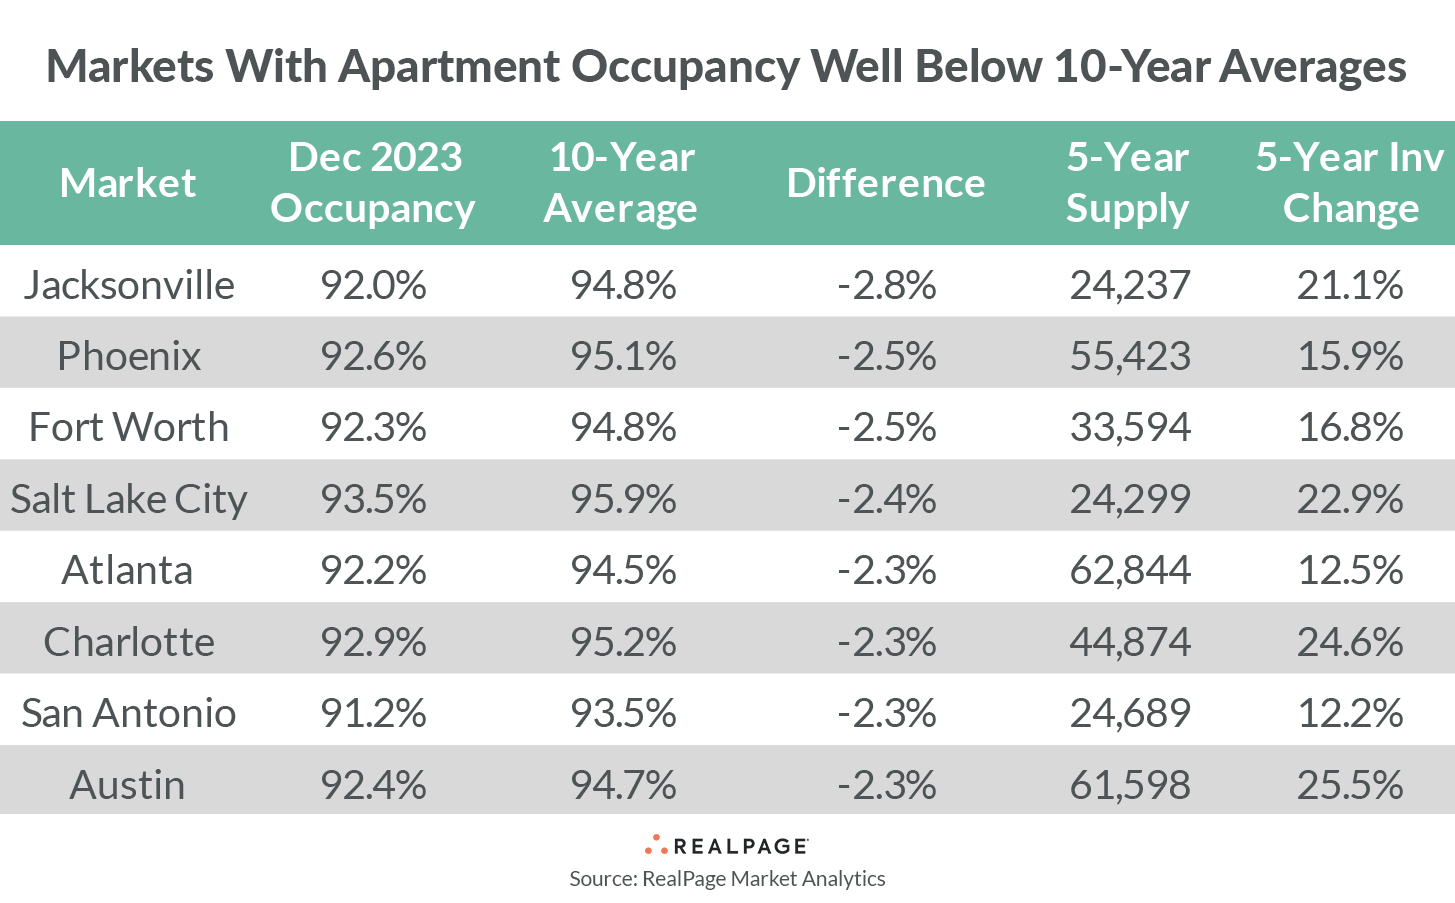
In the worst showings, December 2023 occupancy registered below 10-year averages by 230 bps or more in Jacksonville, Phoenix, Fort Worth, Salt Lake City, Atlanta, Charlotte, San Antonio and Austin. Still, December 2023 occupancy in these markets was not terrible, ranging from 91% to nearly 94%.
It’s not surprising to see several Sun Belt markets on this list. While apartment demand across the Sun Belt has been significant, rampant new supply volumes have outpaced demand in most cases.
Markets where December 2023 occupancy deviated most from 10-year norms tended to be high inventory growth markets. Austin and Charlotte have grown total apartment inventory more than any other markets nationwide in the last five years. Austin’s apartment supply surged by 25.5% in the past five years, while Charlotte’s has grown by 24.6%.
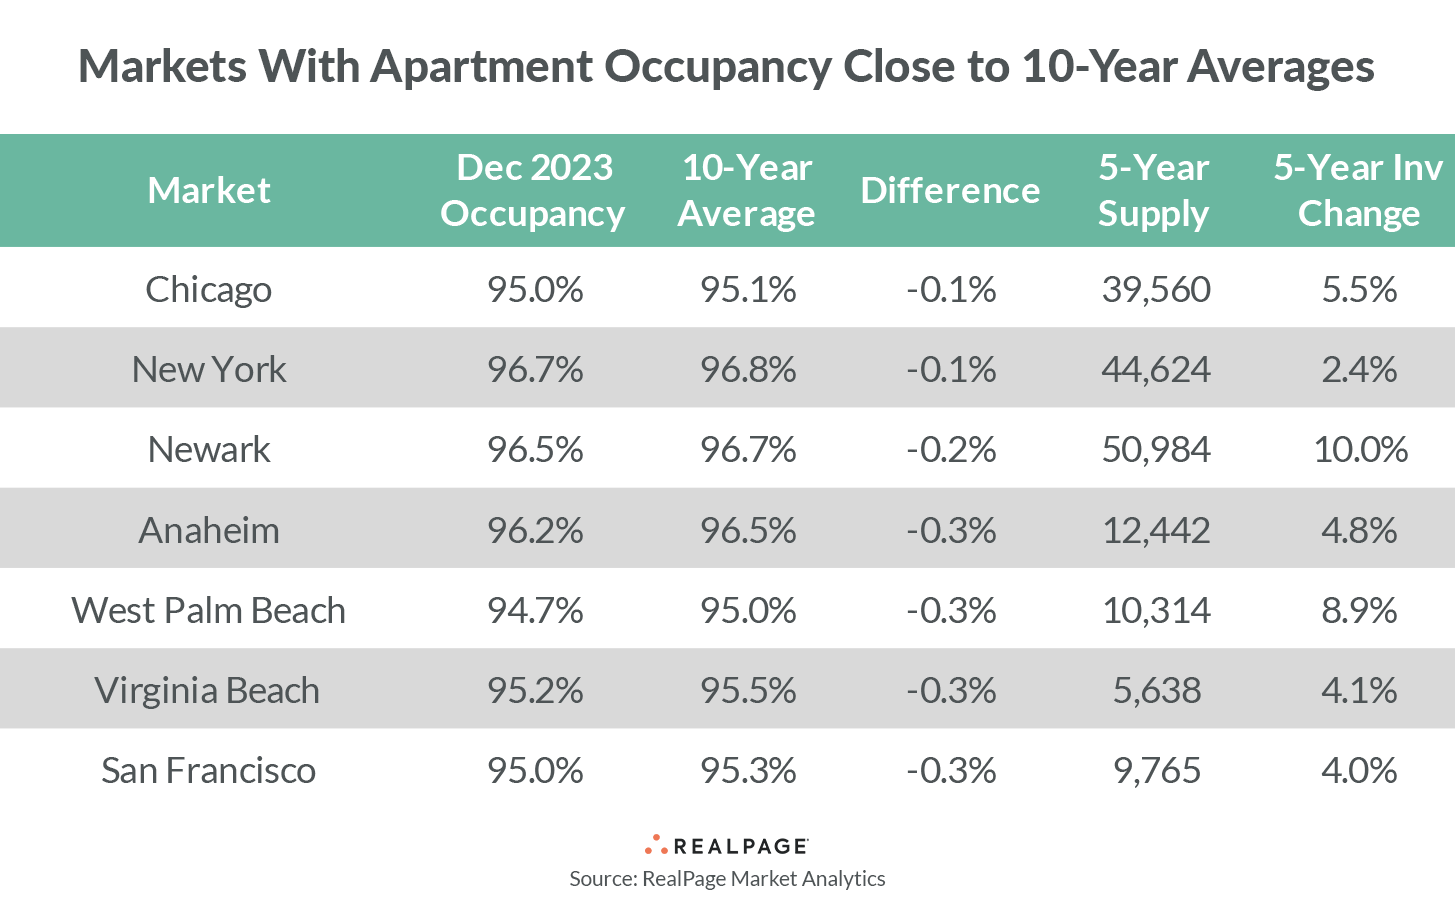
There are a handful of large markets, however, where December 2023 occupancy hit right in line with decade norms. The markets where occupancy was 30 bps or less behind the typical showing were Chicago, New York, Newark, Anaheim, West Palm Beach, Virginia Beach and San Francisco. In most of those markets, apartment inventory growth has been more mild over the last five years, growing less than 6% on average. The increases were a bit higher, but still manageable, in Newark (10%) and West Palm Beach (8.9%).
Markets with occupancy that hovered near their decade norms logged December 2023 occupancy rates between roughly 95% and 97%.


