Multifamily Permits and Starts Finish 2023 on Upswing

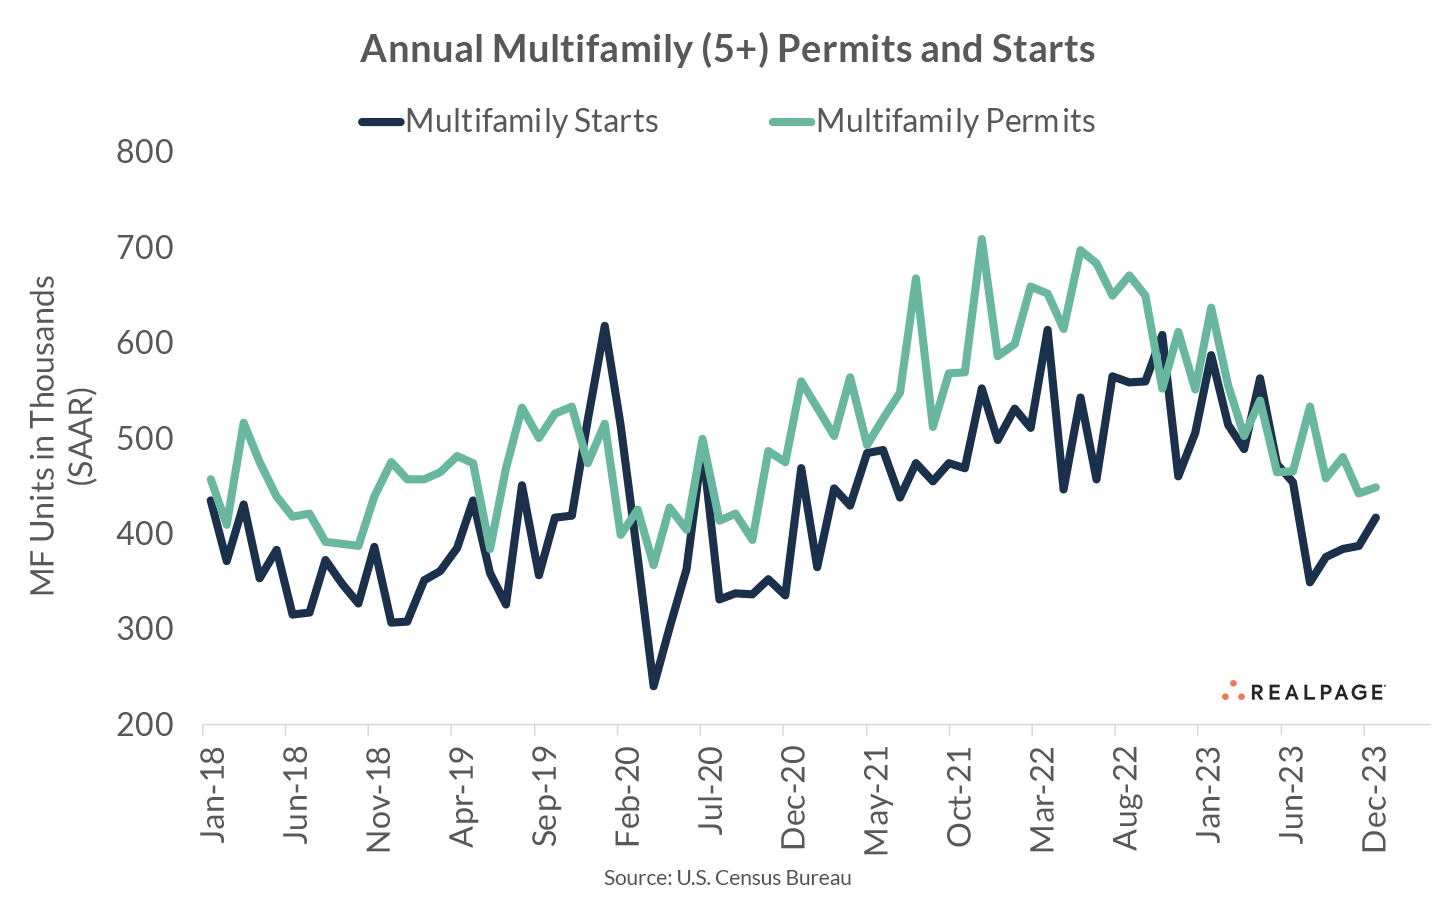
While still generally trending lower, the seasonally adjusted annual rates (SAAR) for both multifamily permitting and construction starts ticked up to end 2023 on an up note as developers may be trying to squeeze in one more project to close out the calendar year.
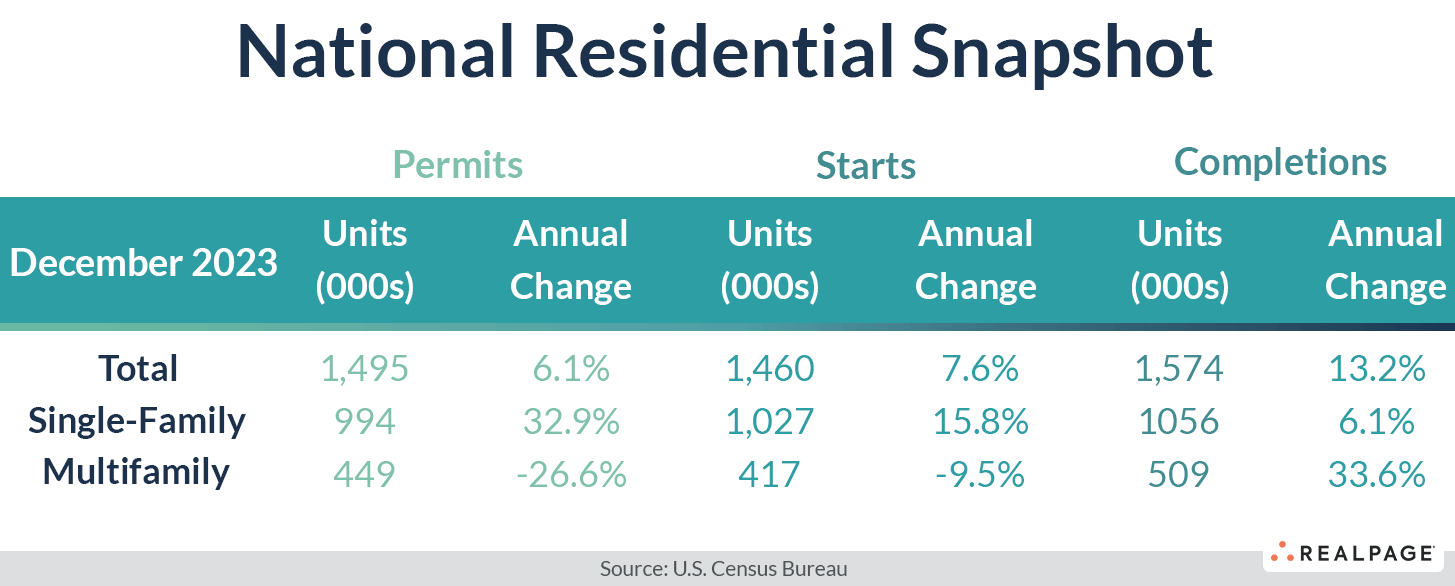
The December SAAR for multifamily permits increased 1.4% from November’s rate to 449,000 units and the annualized rate for multifamily starts jumped 7.5% from last month to 417,000 units. However, both series were below last year’s rates with permitting down 26.6% from last December and starts down 9.5%.
Meanwhile, the SAAR for single-family permitting was up slightly (1.7%) from last month but 32.9% higher than last year at 994,000 units. Single-family starts fell 8.6% from November’s annual rate to 1.027 million unit but were up 15.8% from last December.
Completions of multifamily units were up 11.1% from November to 509,000 units and increased 33.6% from last December. The number of multifamily units under construction was unchanged from November at 991,000 units but was up 7.4% from last year. Additionally, the number of multifamily units authorized but not started was down 11% at 121,000 units in December and down 18.8% from one year ago.
Single-family completions were up 8.4% for the month and 6.1% for the year to 1.056 million units. The number of single-family units under construction fell slightly (-1.2%) to 671,000 units, but that was 11.4% less than one year ago. Single-family units authorized but not started were virtually unchanged from November and last December at 140,000 units.
Together with the small 2-4-unit figures, total residential permitting ticked up 1.9% from last month but increased 6.1% for the year to 1.495 million units. November’s larger decrease in annual single-family starts brought the SAAR of total residential starts down 4.3% from last month to 1.46 million units but total starts were up 7.6% from last year.

Compared to one year ago, the annual rate for multifamily permitting decreased in all four Census regions, with the deepest decreases in the West (down 43.9% to 93,000 units) and Northeast (down 29.9% to 37,000 units) regions, while the South (down 19.8% to 254,000 units) and Midwest (down 15.3% to 65,000 units) regions had more moderate declines. Compared to the previous month, permitting was up in all but the West region.
Multifamily starts fell sharply in the small Northeast region (down 40.6% to 45,000 units) and were down moderately in the West (down 12.7% to 122,000 units) and South (down 8.3% to 195,000 units) regions. The Midwest region saw an increase of 67.9% in starts to 55,000 units. Compared to November’s SAAR, starts were down only in the Northeast, but up in the remaining three regions.
Metro-Level Multifamily Permitting
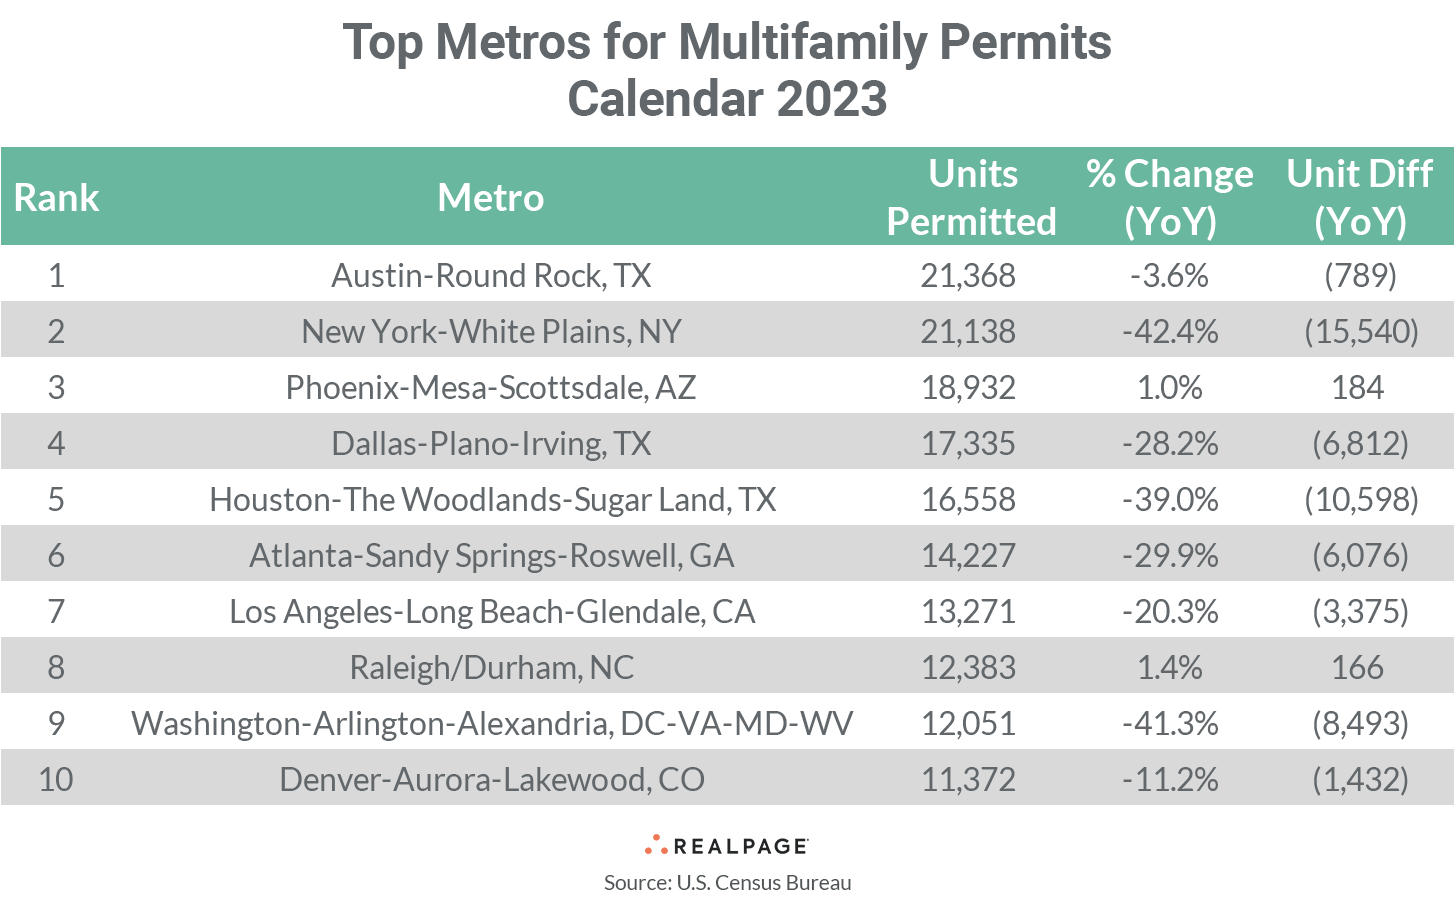
As with employment gain, New York has fallen off it’s top spot for multifamily permitting that it has held for the last several years. Austin edged out the Big Apple with 21,368 units permitted in 2023, which was 140 units more than New York’s 21,138 units. New York has slowed by more than 15,500 units from 2022’s pace.
Nine of the top 10 markets from November’s list returned in December with four remaining in order. After Austin and New York, Phoenix slipped one spot from last month to #3 in December with 18,932 units permitted in 2023, slightly higher than the market’s total last year.
Dallas remained in the #4 spot with 17,335 units permitted followed by Houston at #5 but both were down 30% to 40% from their totals for last year. Atlanta also held its spot from last month at #6, permitting 14,227 units for the year, but that was about 30% or 6,076 units less than in 2022.
Los Angeles returned at the #7 spot with 13,271 units permitted in 2023, which was 3,375 units fewer than last year. Raleigh/Durham moved up to the #8 spot from #10 in November with 12,383 units permitted, about even with last year but 1,170 units greater than last month’s annual total.
Washington, DC slipped one spot to #9 with 12,051 units permitted, down about 8,500 units from 2022 and 1,100 units from last month. Denver cracked the top 10 in the last spot with 11,372 units permitted in 2023, about 1,400 less than last year but up by 1,060 from November.
Only two of the top 10 multifamily permitting markets increased their annual totals from the year before and the size of the increases were minimal. On the other side, New York had the largest decrease in annual multifamily permitting of the top 10 (-15,540 units), followed by Houston (-10,598 units) and Washington, DC (-8,493 units). Dallas, Atlanta and Los Angeles had significant declines in multifamily permitting as well.
Other major non-top 10 markets with significant declines in permitting include Seattle (-7,272 units), San Antonio (-6,210 units), Minneapolis/St. Paul (-5,774 units), Orlando (-3,747 units), Fort Worth (-3,724 units), Tampa (-3,285 units) and Boston (-3,273 units).
Major markets with significant year-over-year increases in annual multifamily permitting in the year-ending December were Nashville (+6,414 units), Riverside (+3,671 units), Greensboro/Winston-Salem (+2,694 units), San Diego (+2,509 units) Miami (+2,246 units) and Charlotte (+2,133 units).
The annual total of multifamily permits issued in the top 10 metros – 158,635 – was about 25% less than the 211,400 issued in the previous 12 months and down about 4% from last month. The total number of permits issued in the top 10 metros was almost equal to the number of permits issued for the #11 through #32 ranked metros.
Below the metro level, nine of last month’s top 10 permit-issuing places returned to this month’s list with seven remaining in the same place and the rest changing places. The list of top individual permitting places (cities, towns, boroughs and unincorporated counties) generally includes the principal city of some of the most active metro areas.
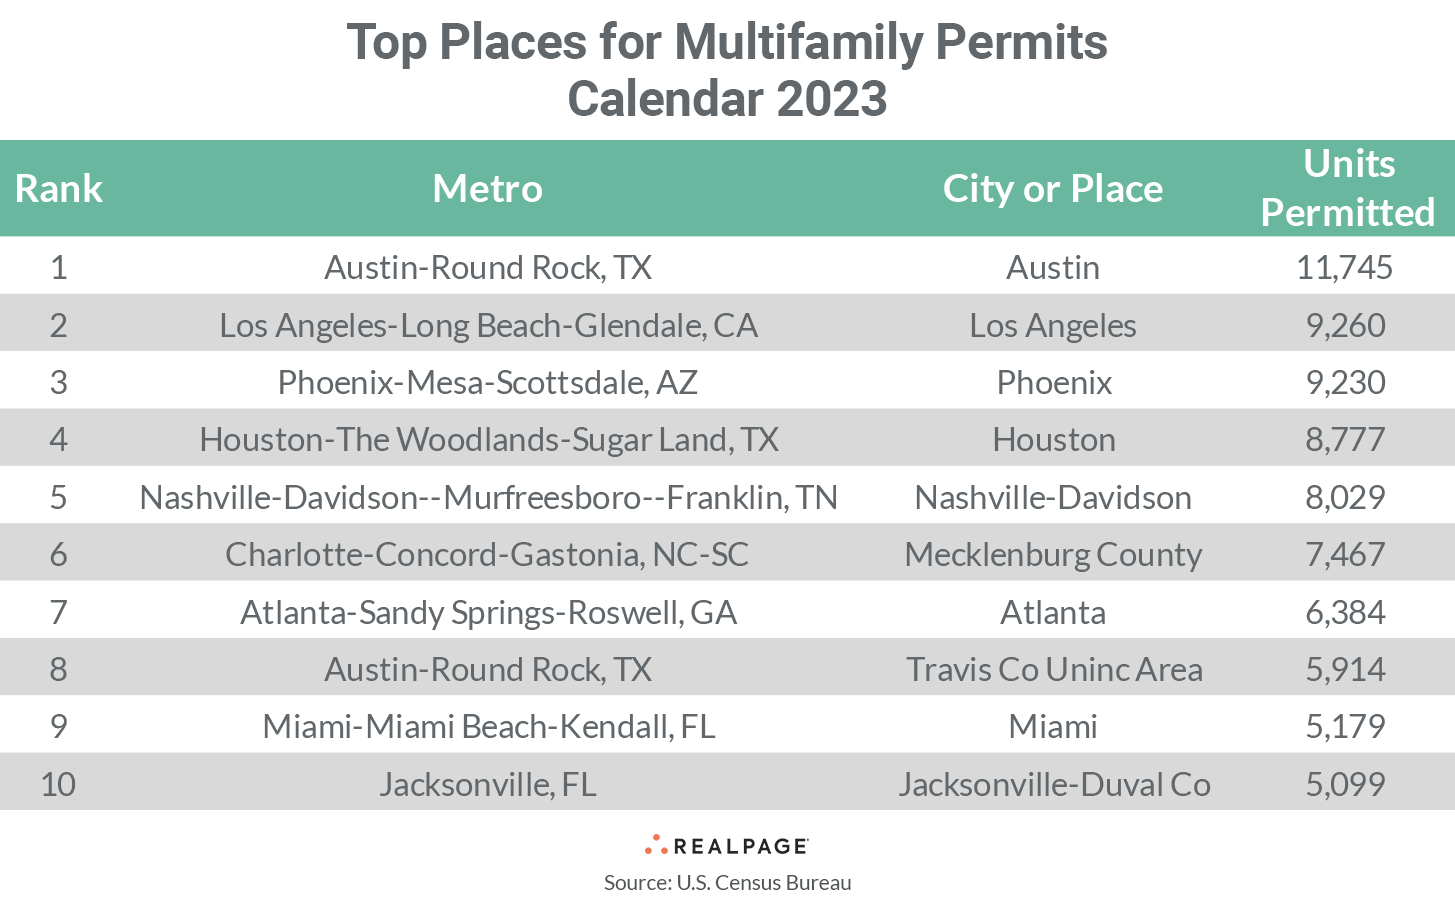
In December, the city of Austin remained in the #1 position with 11,745 units permitted, 379 more units than in November. The city of Los Angeles returned at #2 in December with 10,072 units permitted, 318 more than last month. The cities of Los Angeles and Phoenix changed places in December at #2 and #3 with both permitting about 9,200 units in 2023, a moderate decline from last month for both cities.
The city of Houston remained at #4 in December, permitting 8,777 units, while the city-county of Nashville-Davidson and Mecklenburg County (Charlotte) returned at #5 and #6 with totals of 8,029 units and 7,467 units, respectively.
The city of Atlanta and Unincorporated Travis County (Austin) also remained in place from last month at #7 and #8, but Atlanta slowed by 957 units from November while Unincorporated Travis County increased their 12-month total by 131 units. The city of Miami stayed in the #9 spot, permitting 5,179 units in 2023 and Jacksonville-Duval County joined the top 10 with 5,099 units permitted.
Of the top 20 permitting places, Texas has six representatives, Florida three, North Carolina and California two. Despite the general slowing of multifamily permitting nationwide, 19 of November’s top 20 permitting places returned in December with only the city of Chicago falling off, replaced by the city of Seattle.


