Ask anyone on the acquisitions side of the table who is active in the nation’s Sun Belt set of markets and they’ll be among the first to tell you how much more competitive the landscape is today than ten or even five years ago.
This increase is something of a double edge sword. From one perspective, the rise in attention has increased liquidity within the region among other positive factors. From another perspective though, it means rising purchase prices and generally tighter cap rates.
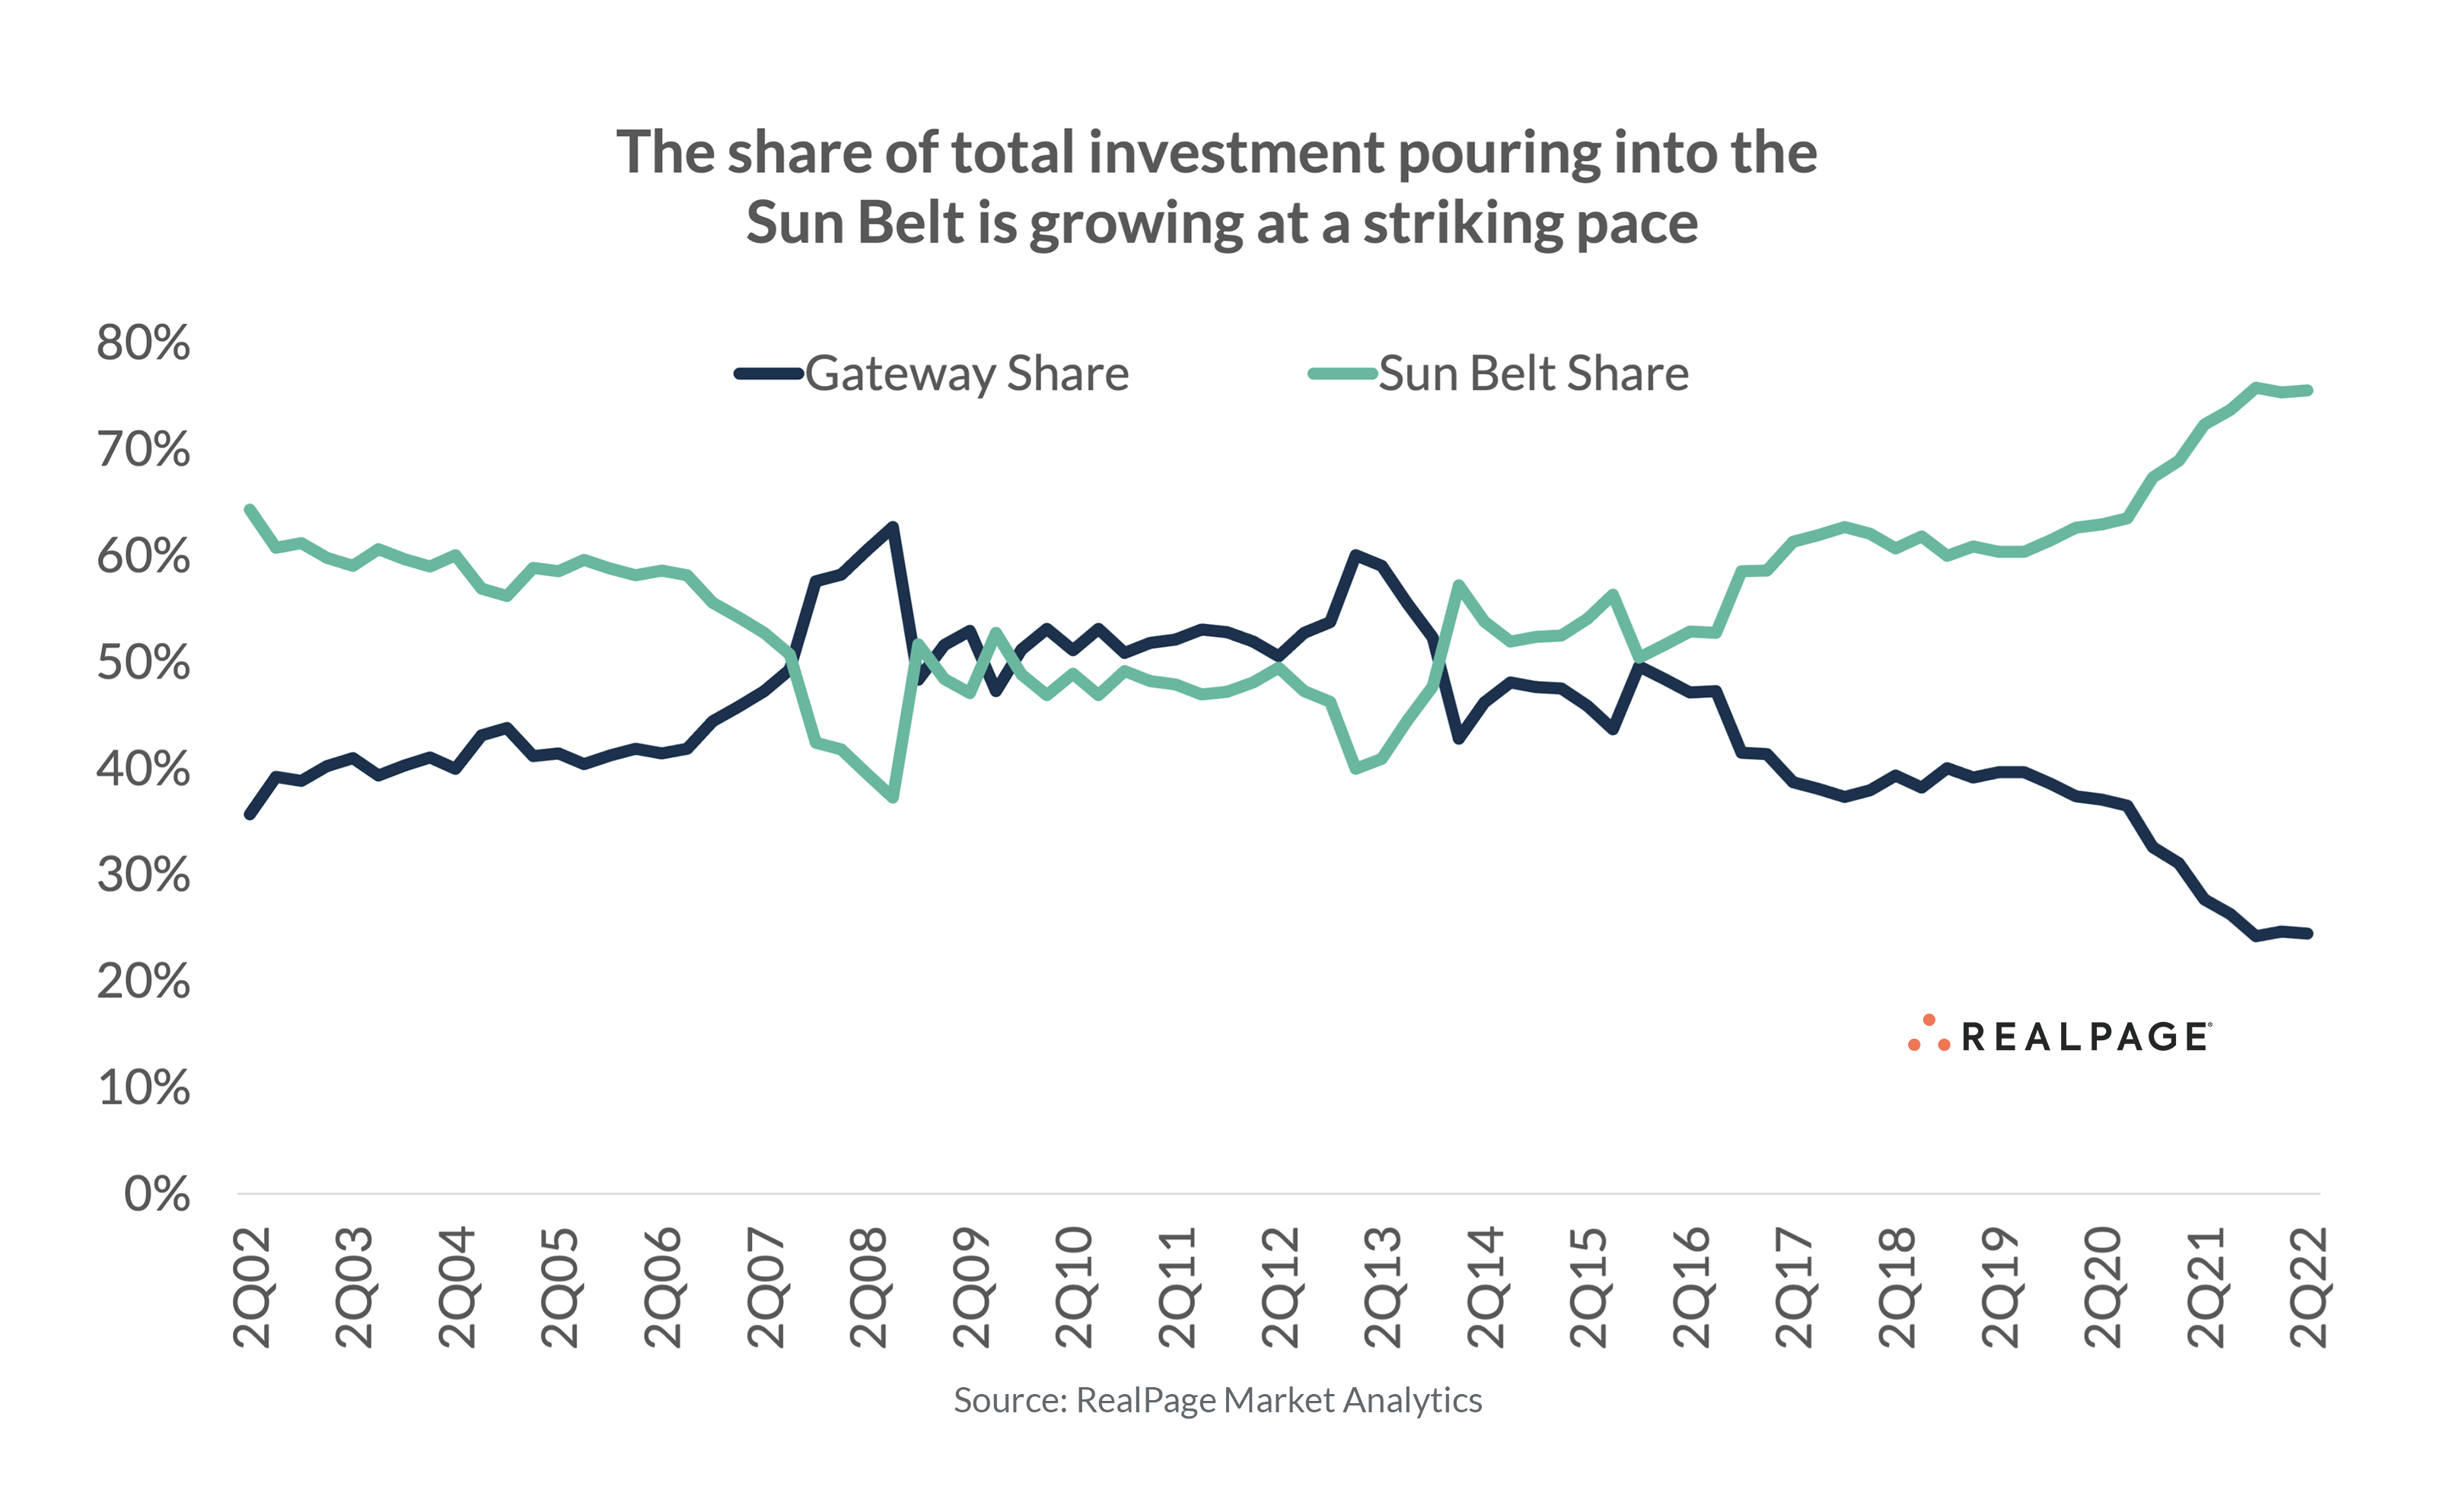
Opinions on whether the Sun Belt region or Gateway markets are better long-term investment strategies vary. Regardless of individual strategy however, the wave of capital flowing into the Sun Belt region today is easily an observable phenomenon. A quick glance at multifamily property sales volume shows that Sun Belt markets are growing overall volume (and therefore their share) faster than Gateway metros.
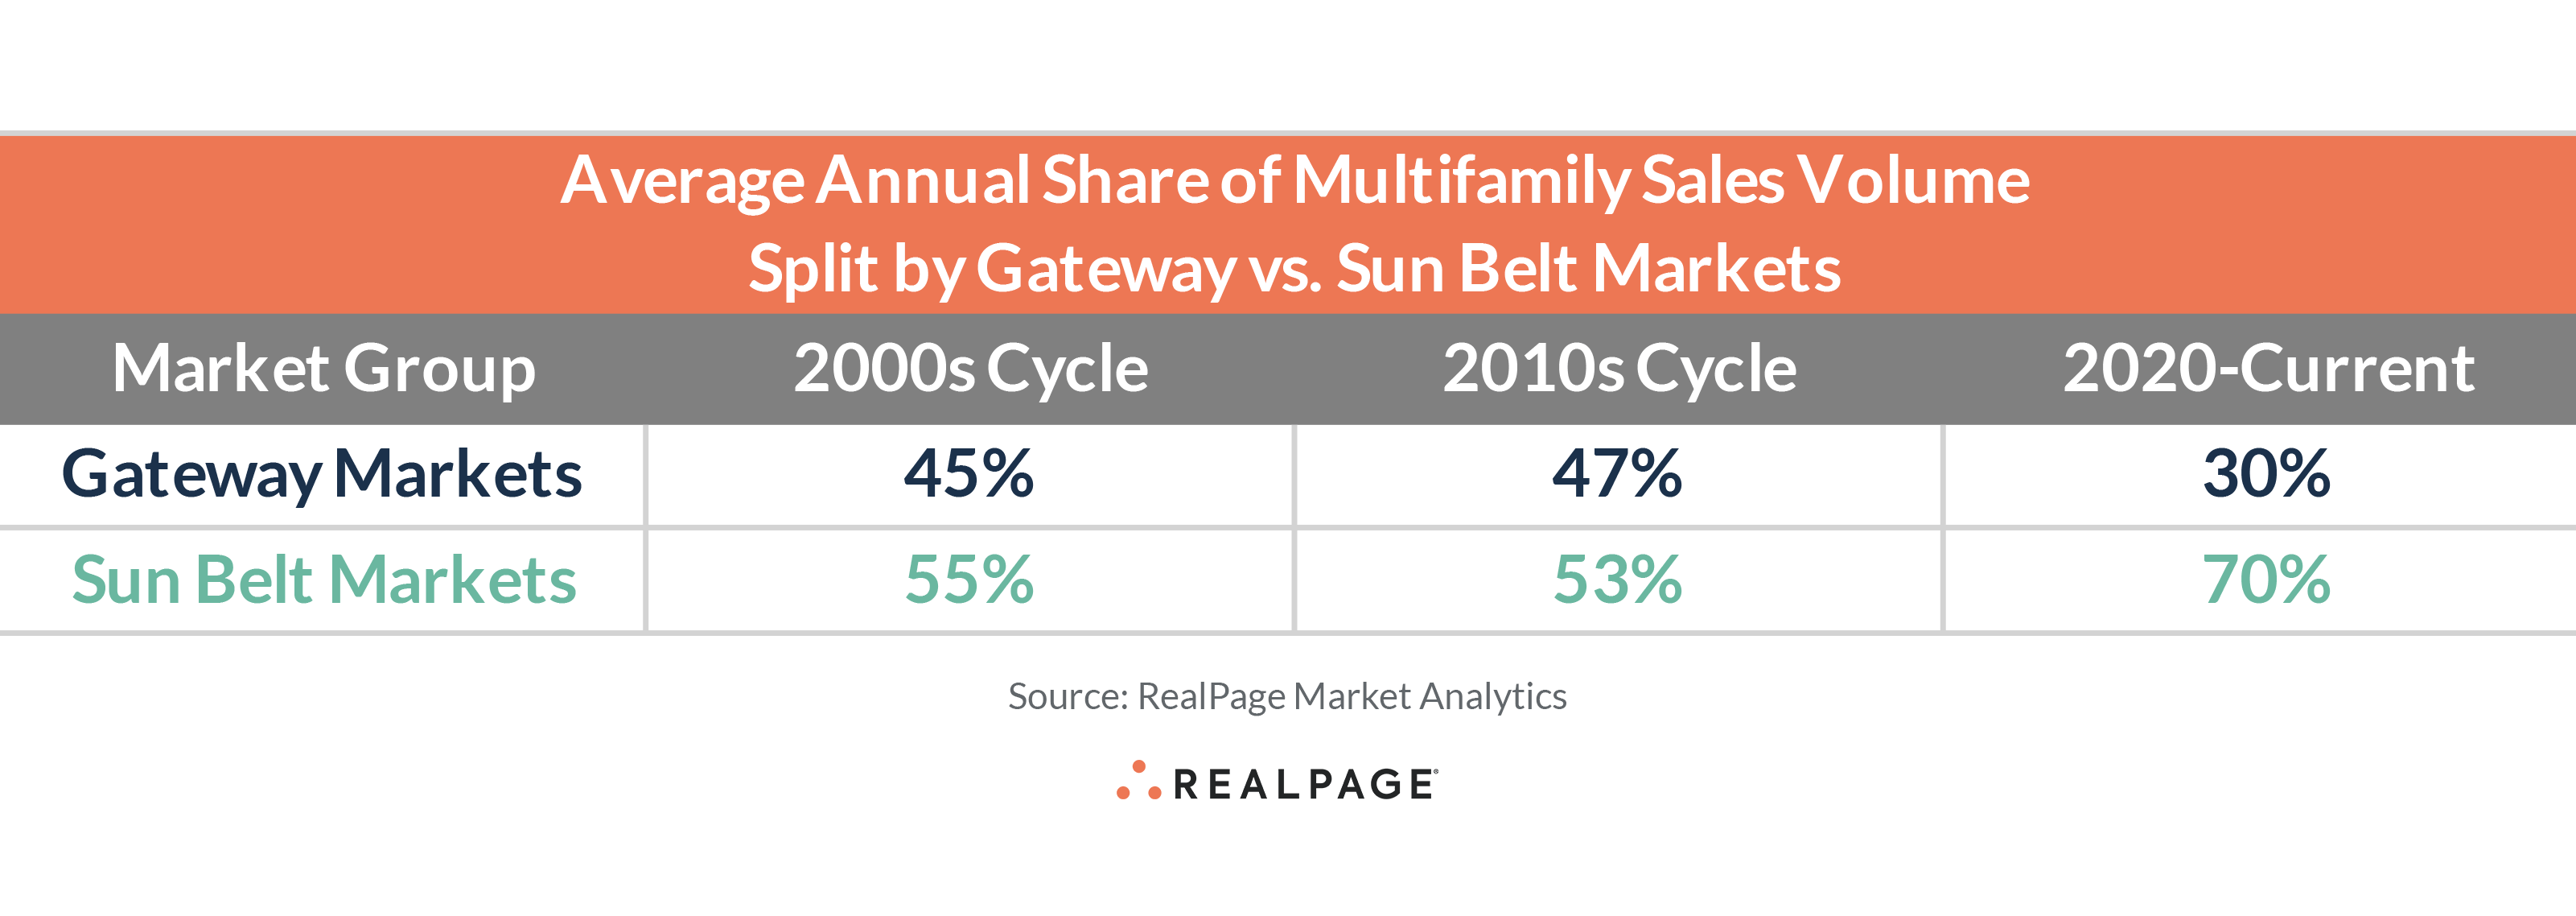
Interestingly enough, it wasn’t until the mid-2010s decade in which Sun Belt sales volumes began to break away from their Gateway counterparts. Prior to that period, there was a generally consistent split between the Sun Belt (which explained about 50% to 55% of total investment, with minor deviation circa 2007/2008 and once again in 2012/2013) and the Gateway markets (the remaining 45% to 50%).
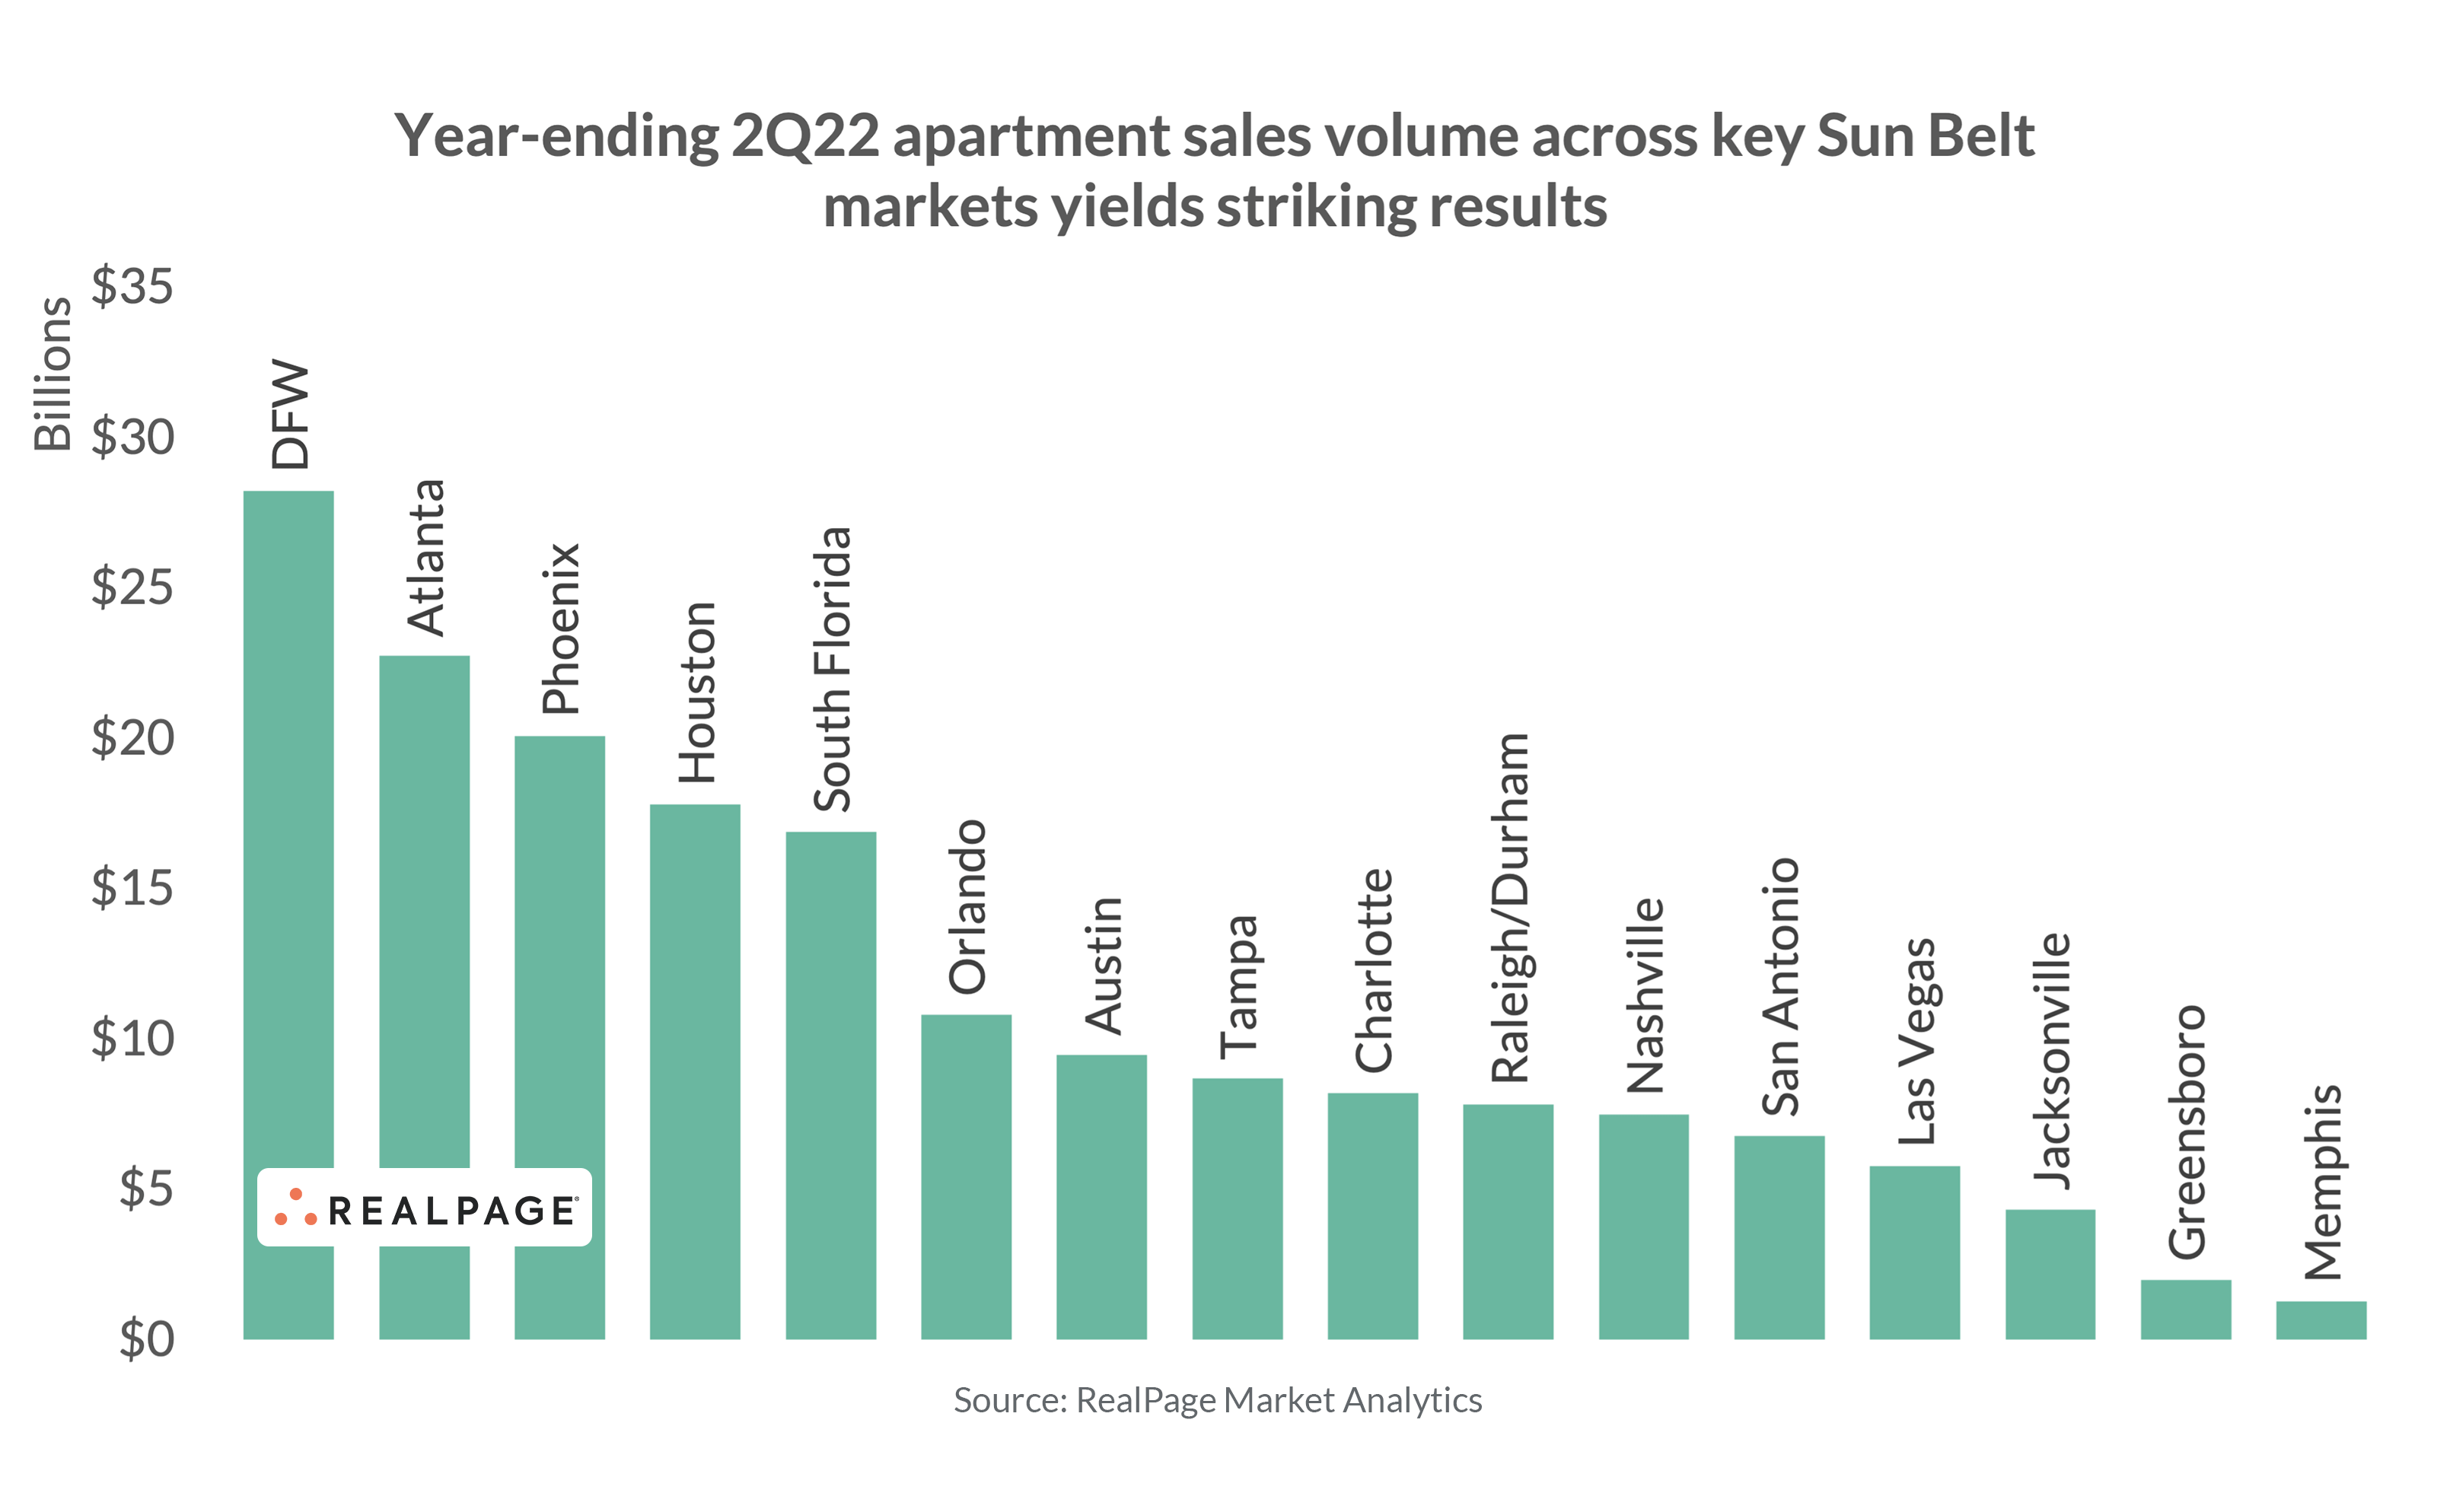
A quick comparison of trailing 12-month (or annualized) sales volume for Sun Belt markets shows that this increased investment volume phenomenon isn’t limited to a handful of markets, according to data from RealPage Market Analytics.
Places like Dallas/Fort Worth ($28.2 billion in the year-ending 2Q22) are seeing sales volumes more than double the local pre-pandemic peak ($11.1 billion), recording an increase of 155%. No market is more striking, however, than South Florida. Year-ending 2Q22 sales volume (some $16.9 billion) is more than four times this region’s pre-pandemic peak ($3.7 billion). Put another way, the past 12 months essentially saw four and a half years’ worth of investment if using 2019 as the benchmark.
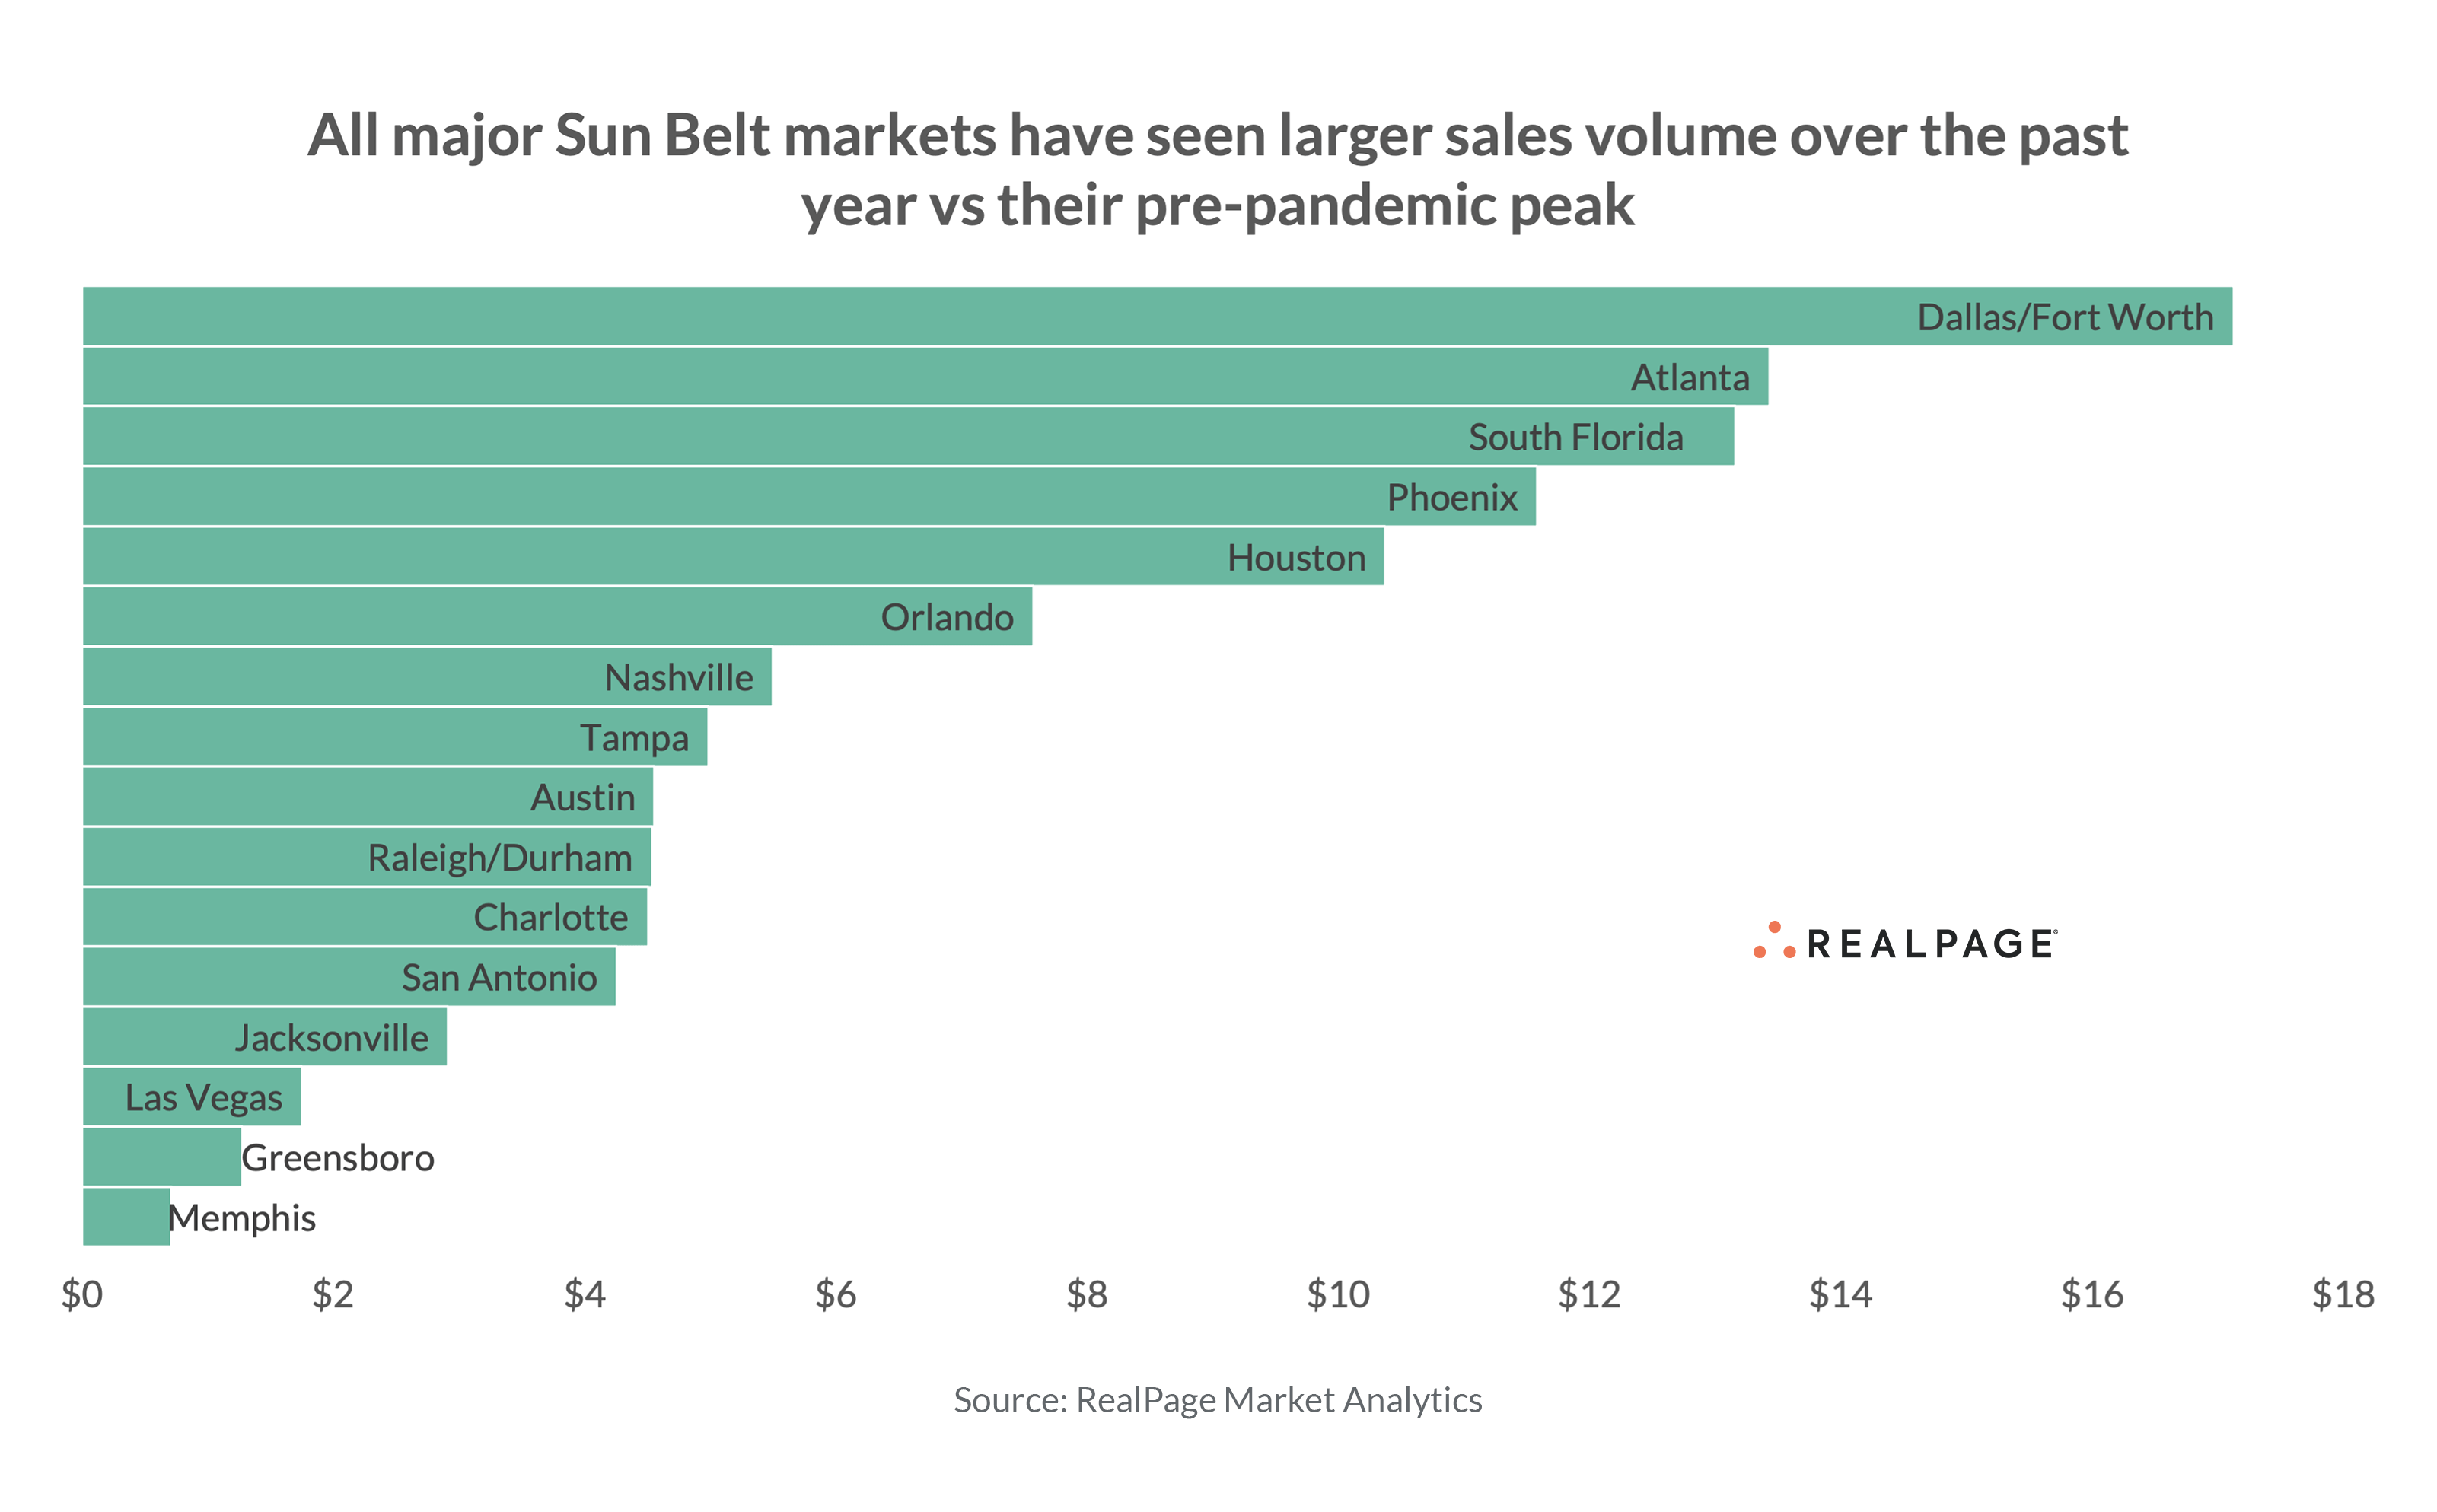
The data shows that every major Sun Belt market has seen an increase in the past 12 months versus local pre-pandemic peaks (or 2019 volumes) as well.
On the low end, Memphis, Greensboro, and Las Vegas round out the three lowest increases. On the high end, Dallas/Fort Worth, Atlanta, and South Florida (including Miami, Fort Lauderdale and West Palm Beach) have seen roughly $14 to $17 billion more in acquisition volume than pre-pandemic peaks.
With the increase in sales volume, though, comes the increase in average price per unit. In the past cycle, average Sun Belt market pricing has increased quite substantially. But it has been the past 12 to 24 months in which those prices have drastically risen.
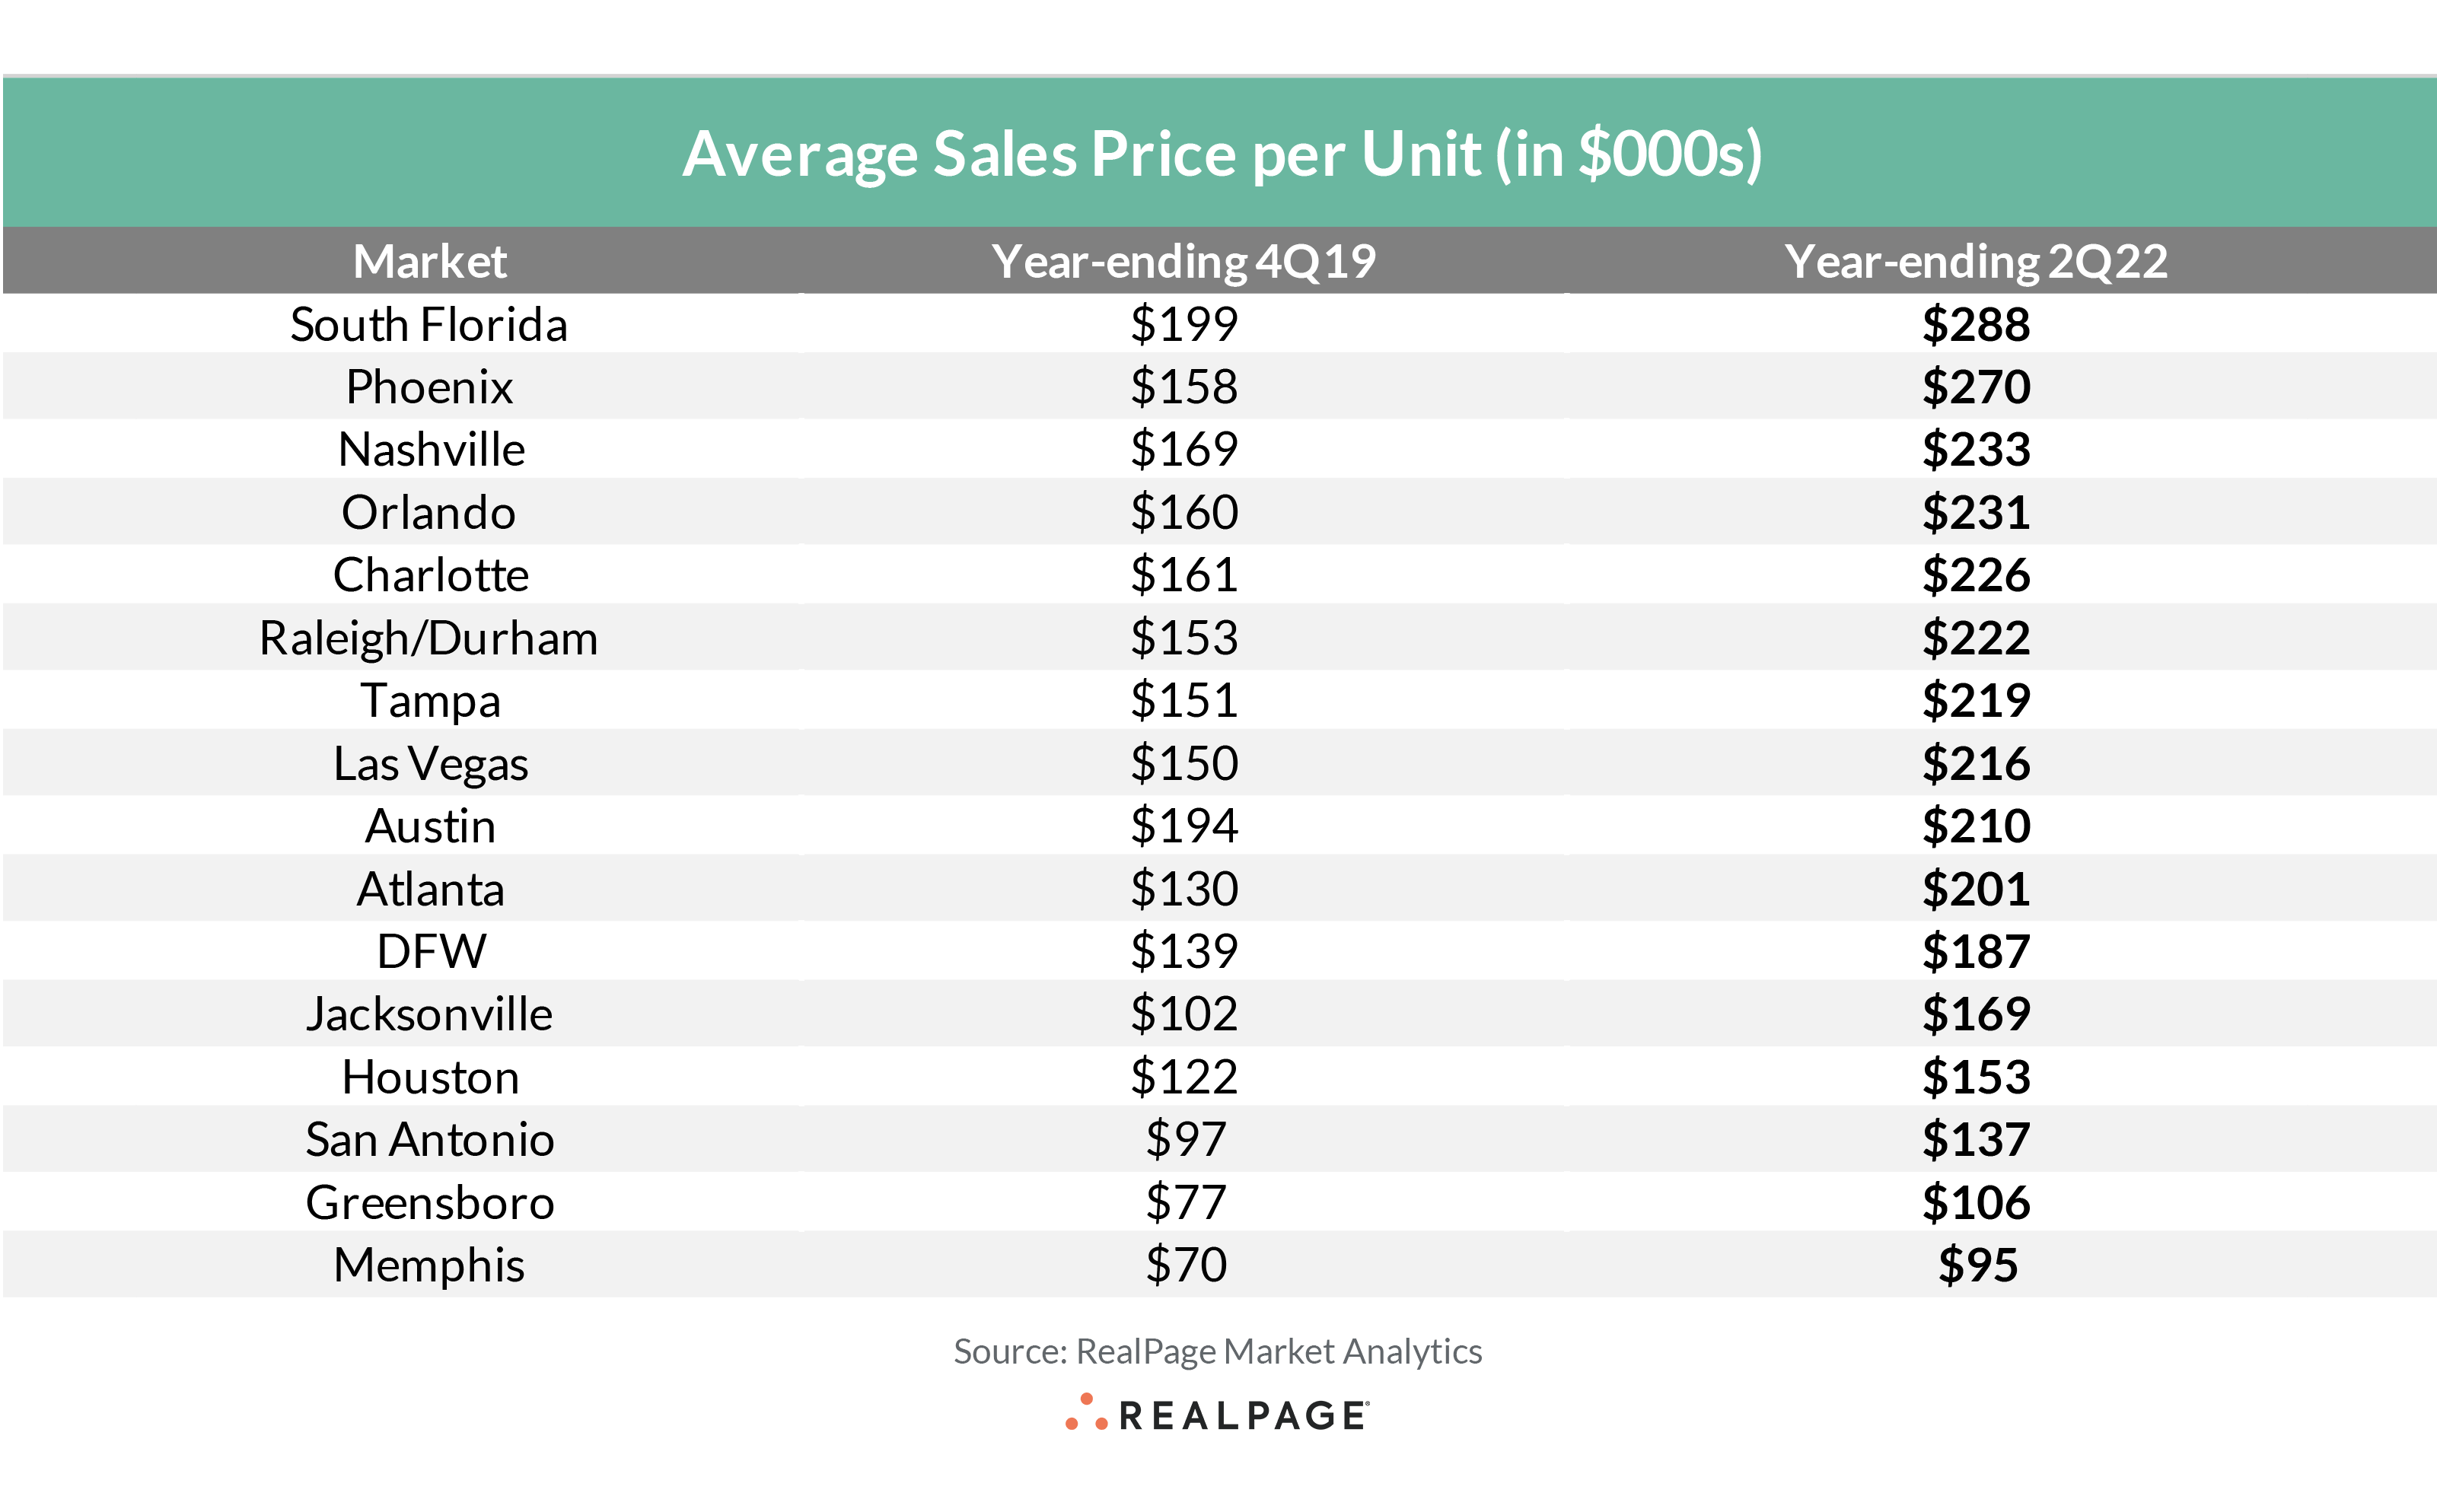
Looking at the average sales price per unit in 2019 and in 2022 among Sun Belt metros, South Florida, Phoenix and Nashville round out the three highest prices per unit. Meanwhile, Orlando barely missed out on the top three. Conversely, San Antonio, Greensboro and Memphis come in as the three lowest priced markets.
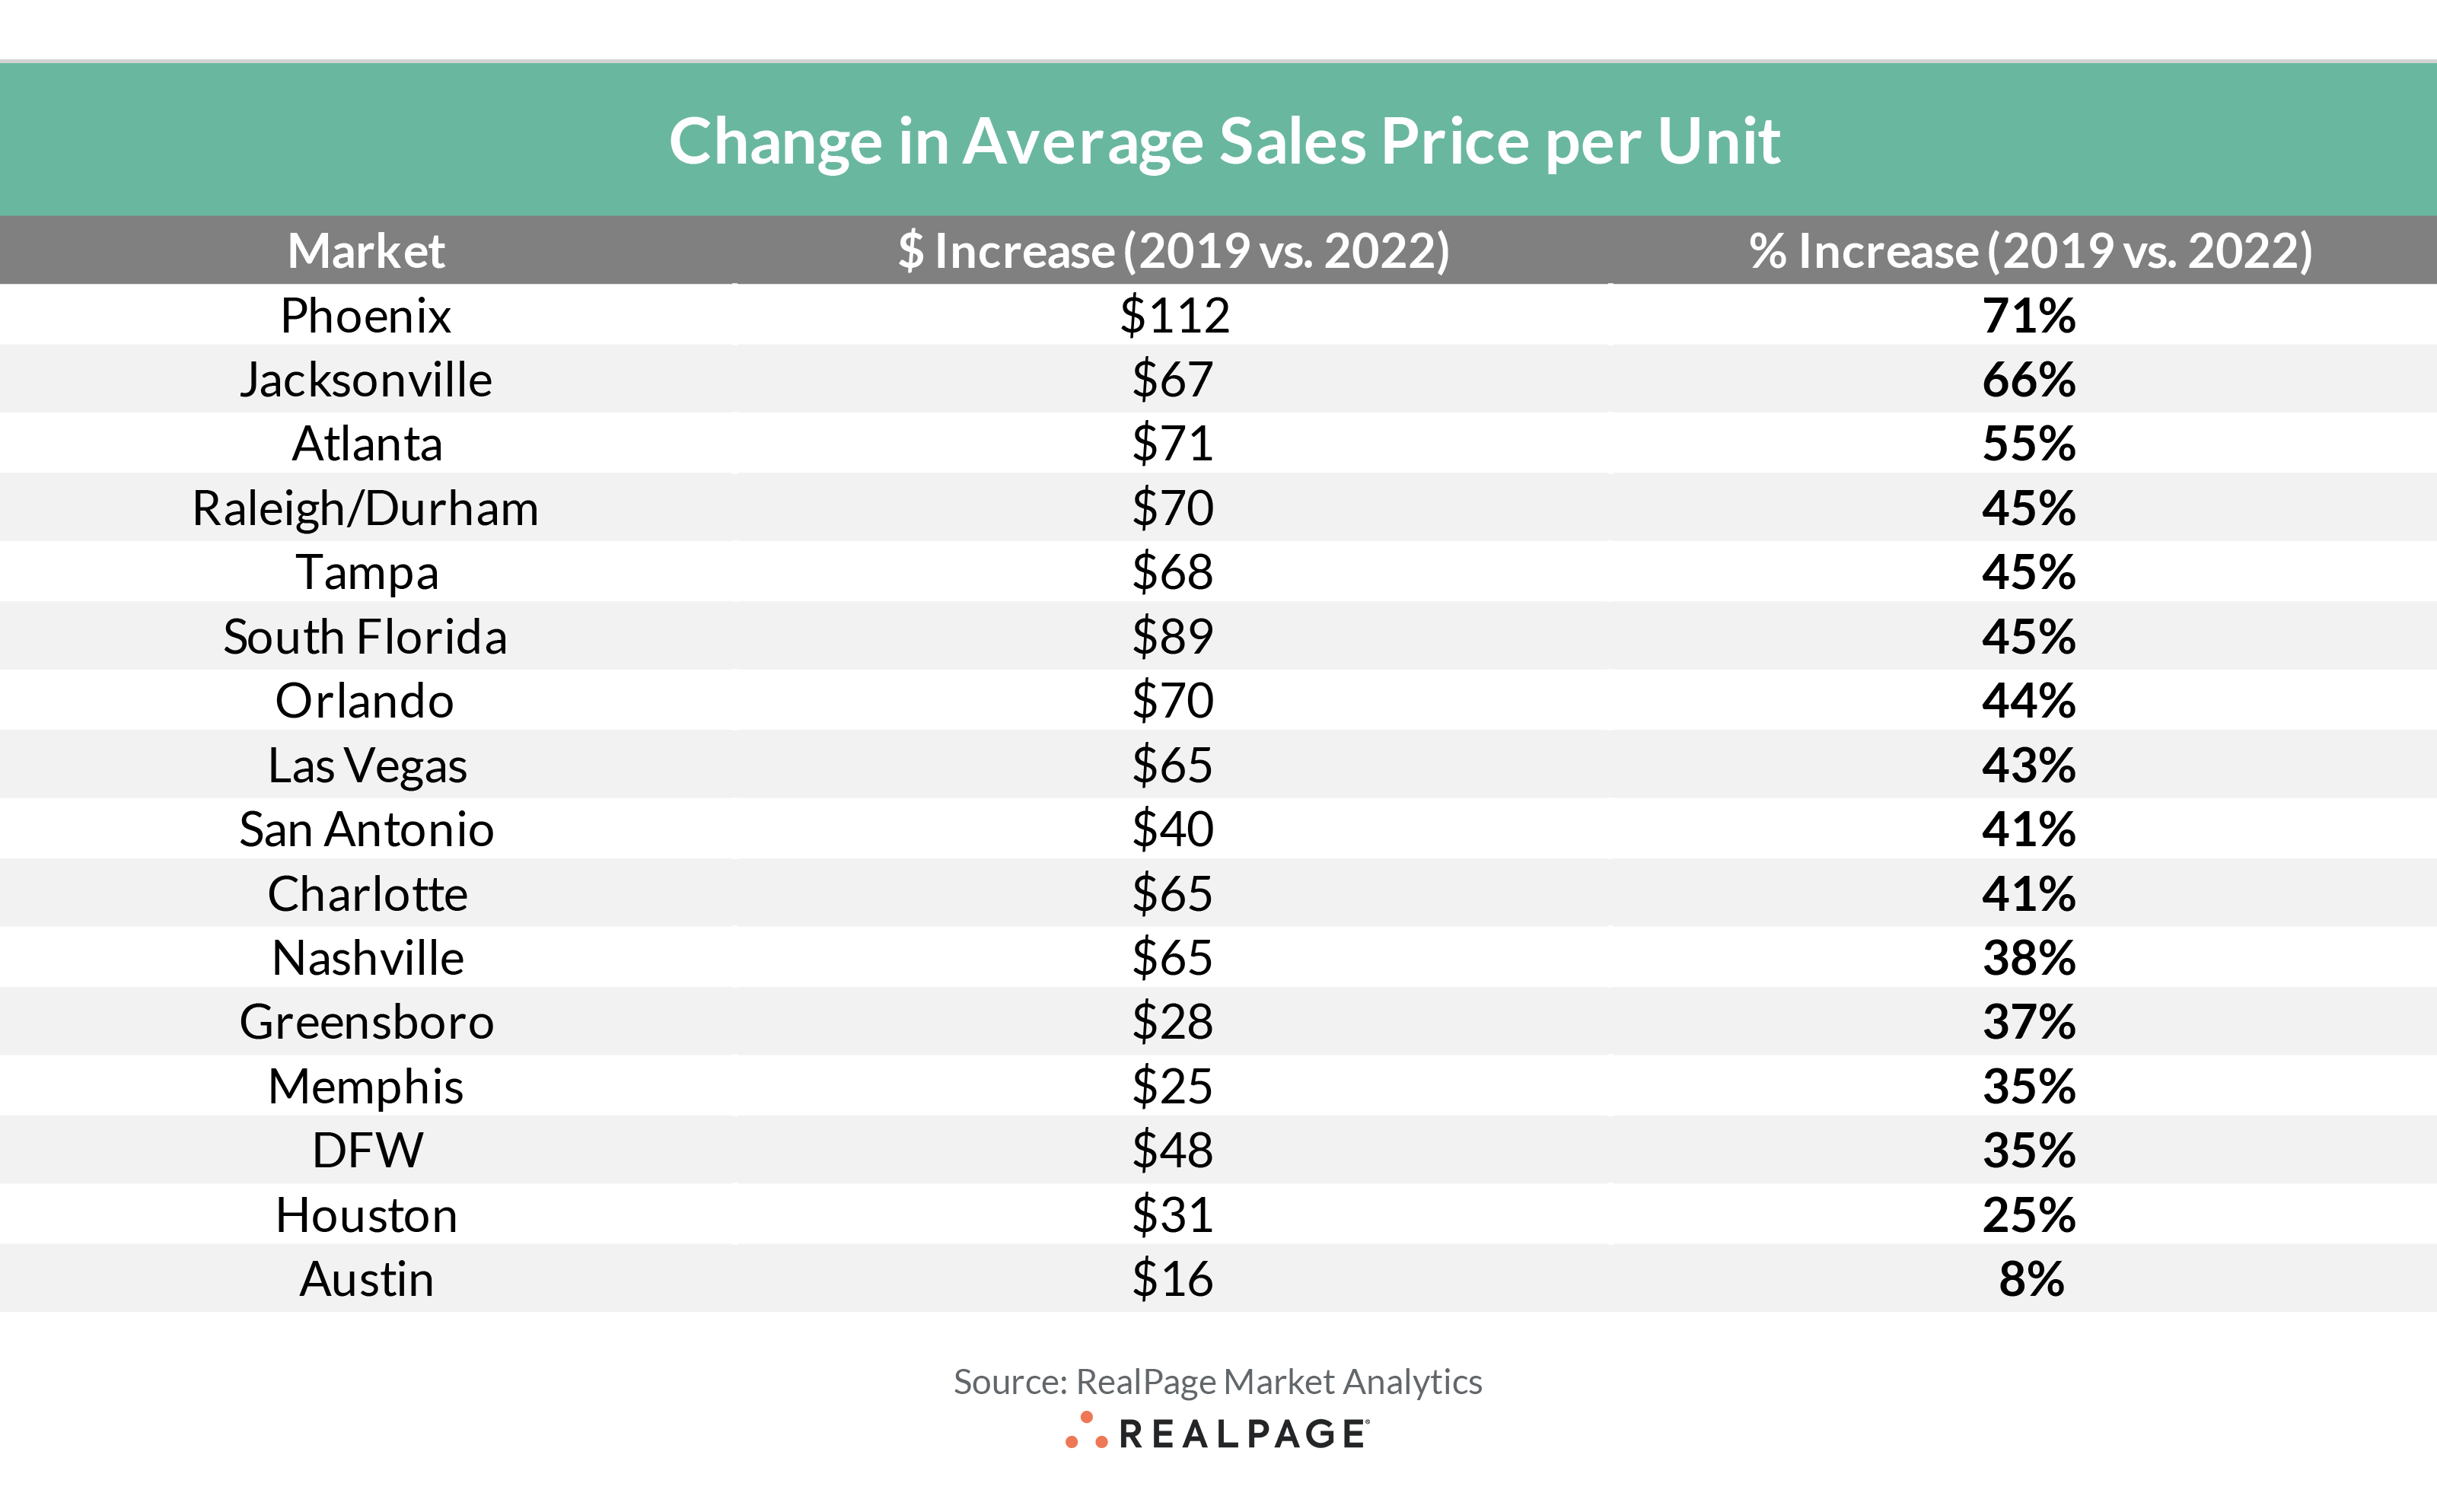
In relative terms, Phoenix has been the Sun Belt market with the highest increase in average sales price per unit today versus its pre-pandemic mark. In that market, the average price per unit has jumped some 71% (or $112k additional per unit).
Jacksonville (66%) and Atlanta (55%) round out the top three biggest relative increases, before a suite of markets clocks in with strikingly consistent increases between 35% and 45%. On the low end, Memphis and a trio of Texas markets (Austin, Houston and Dallas/Fort Worth) have all seen average prices grow by 35% or less.
There are a number of reasons why Sun Belt markets have become viewed in a more favorable light in the past real estate cycle in particular.
Macro conditions have long-indicated larger population growth in the Census-defined South region (especially true within key markets in those states) versus the Northeast and Midwest regions. And while West region states have seen generally solid population growth through the past real estate cycle, a number of qualitative factors such as political headwinds have influenced the appetite for investment to some degree.
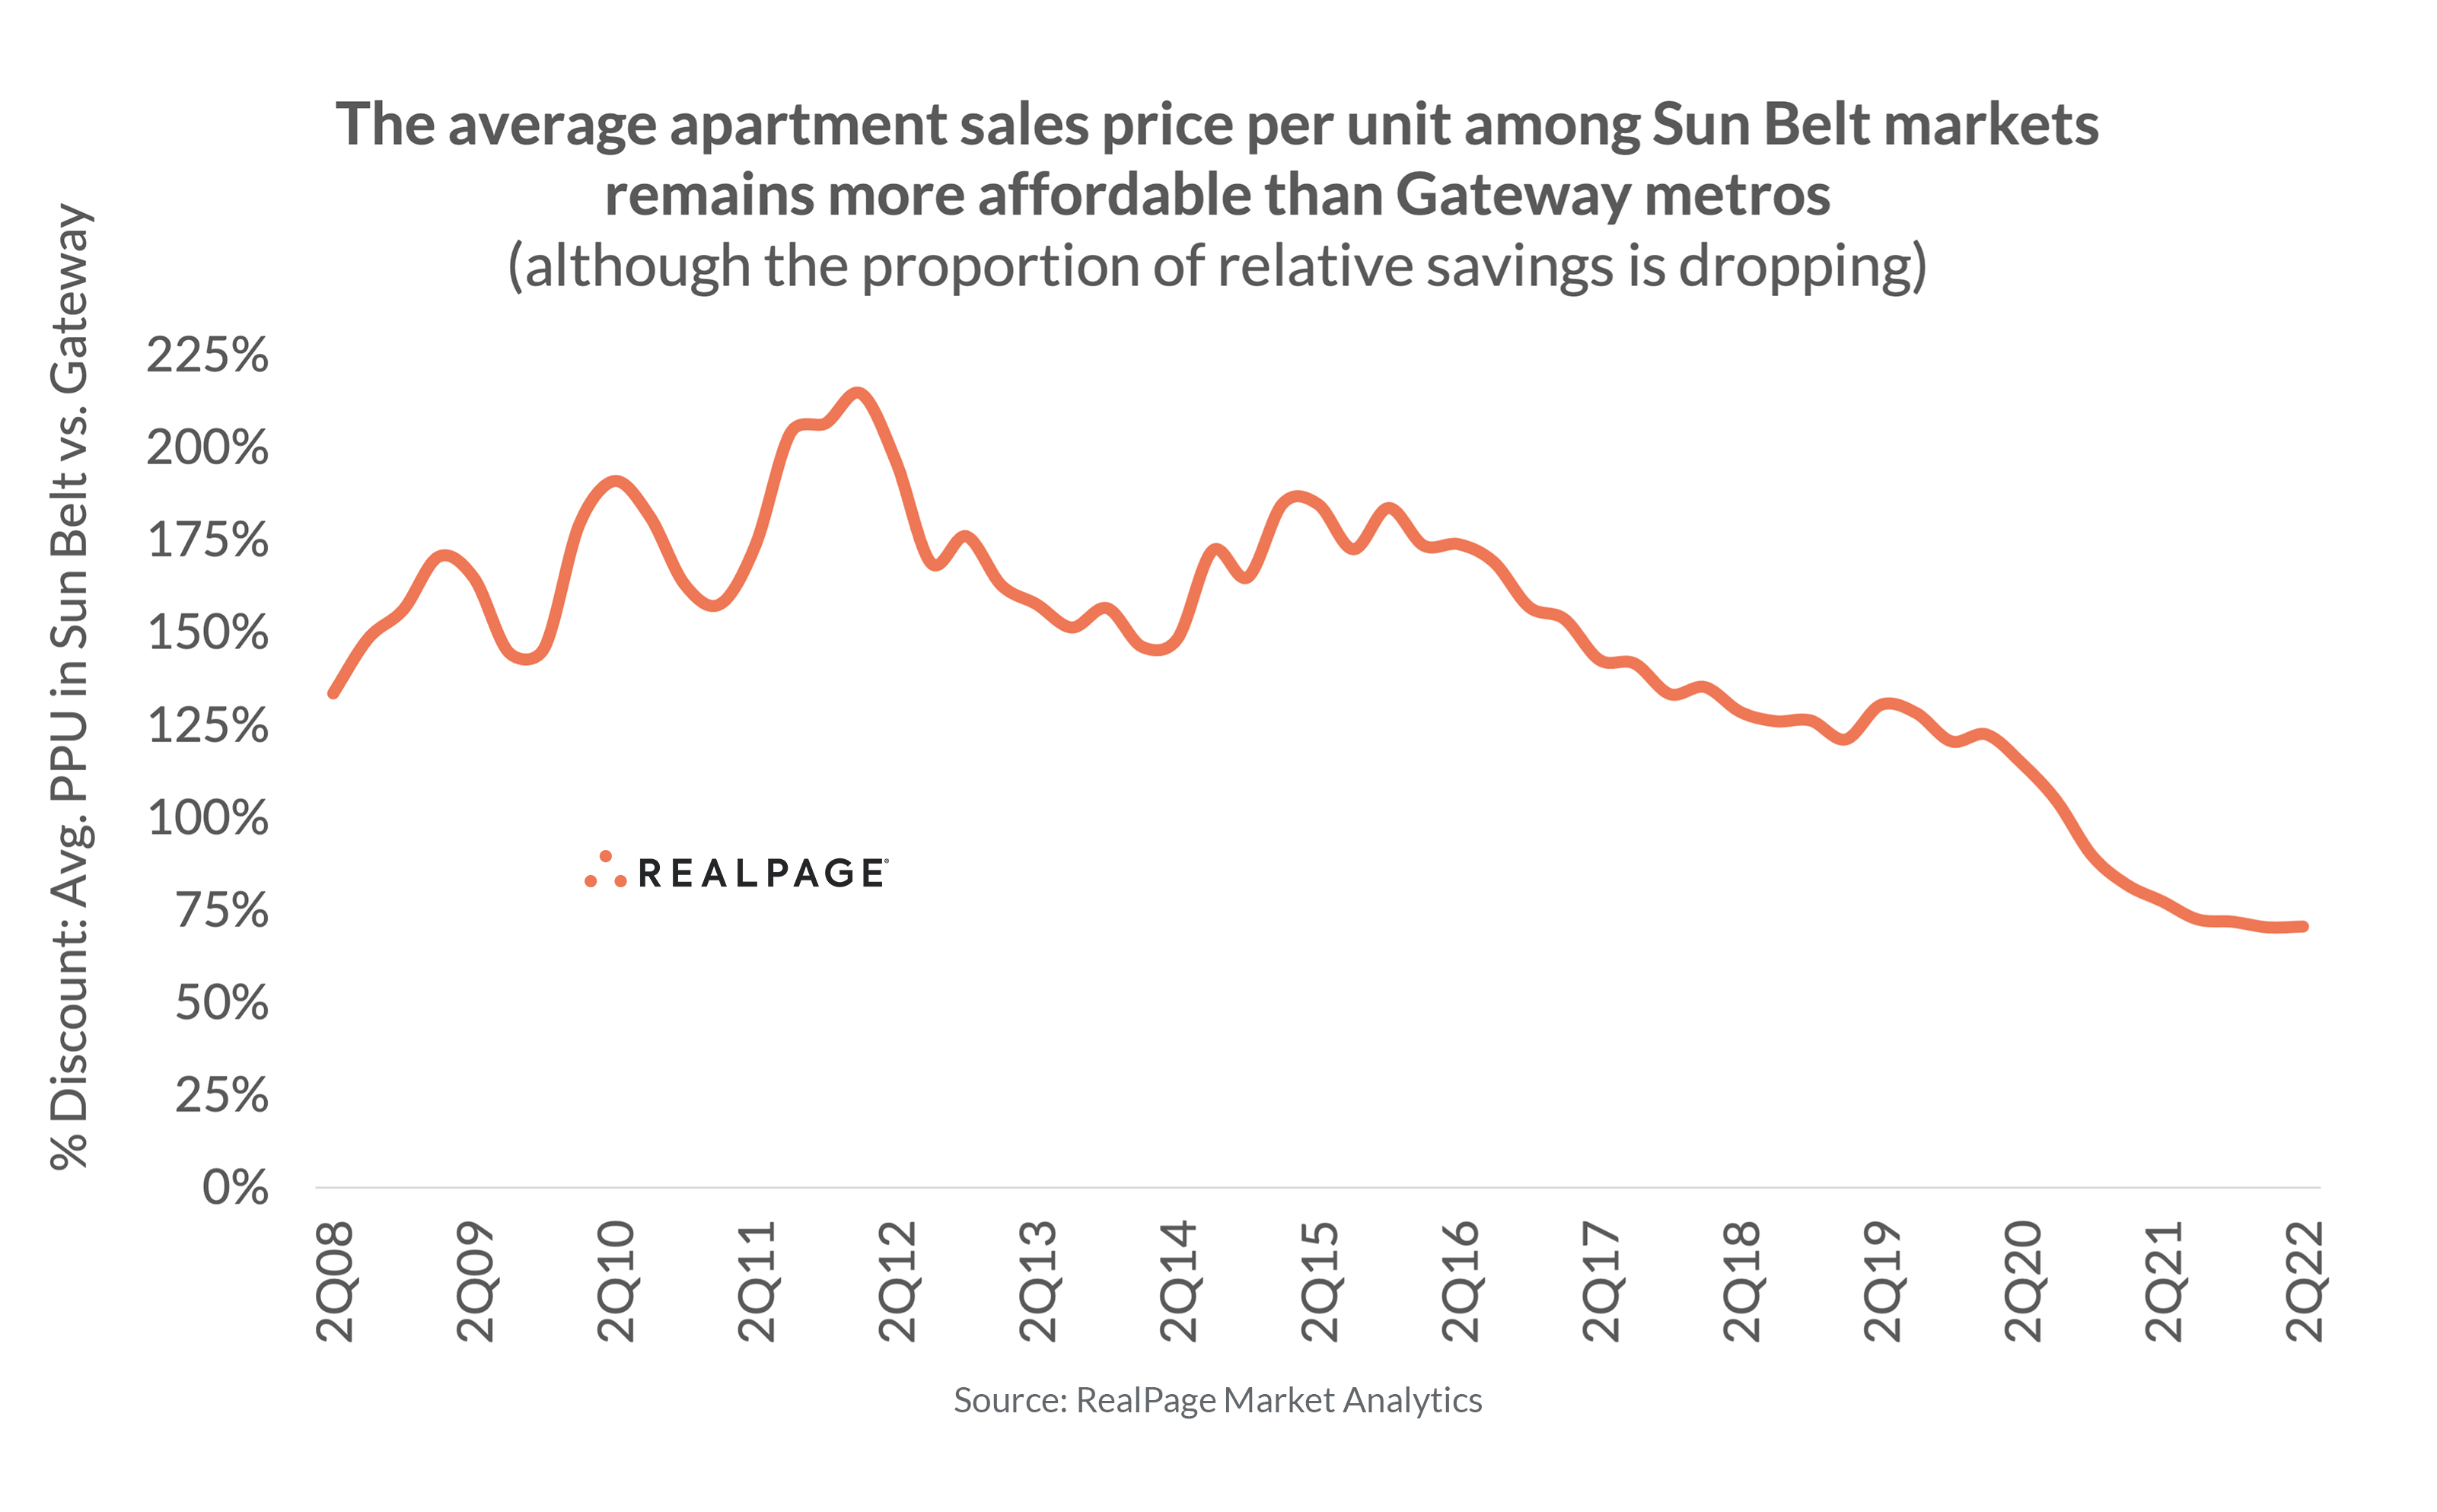
But one key driving force influencing this influx of capital is the purported relative savings of Sun Belt markets versus their Gateway counterparts. Although the relative share of Sun Belt pricing has eroded to an all-time low (about 70% today), savings still equal to 70% remains a sizeable discount.
Moving forward, this trend of relative savings among Sun Belt markets continues to evolve. It would take some time for another similarly sized erosion of relative savings to unfold. As such, there’s likely support for continued interest in the Sun Belt from an investment perspective assuming that performance fundamentals remain solid.


