Solid Job Growth Keeps Philadelphia Apartment Market Fundamentals Afloat

Philadelphia’s apartment market has historically been one of the nation’s most consistent performers, maintaining relatively solid fundamentals even during tumultuous times. Like most apartment markets across the country, Philadelphia experienced deflating market fundamentals after a surge in occupancy and rents in 2021 and 2022. However, the Philadelphia apartment market has been exceeding U.S. norms for both occupancy and rent growth recently, even as elevated supply levels dampen the market’s performance.
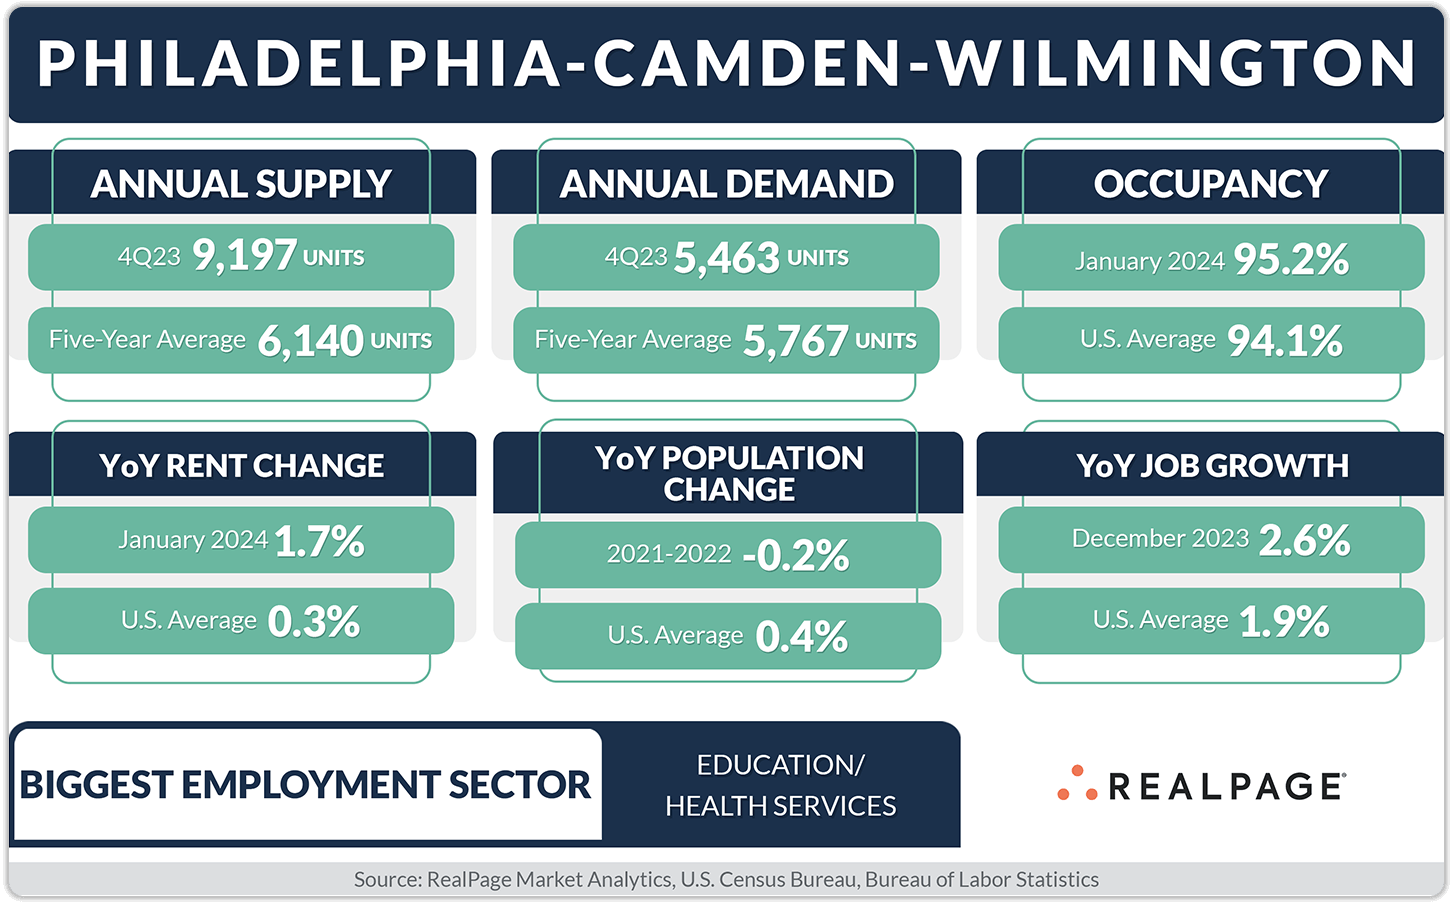
Philadelphia, in the southeast corner of Pennsylvania, is situated between Baltimore to the southwest and New York to the northeast, both less that a two-hour drive away. Philadelphia is the seventh most populated metro area in the country with roughly 6.2 million residents, while it has the nation’s 10th largest apartment market with just over 413,000 existing units. The economy in the City of Brotherly Love consists of slow growing but stable industries, many of which are in the higher education and health care sectors. In fact, the Education/Health Services sector is the metro’s largest employer.
Philadelphia is home to 12 Fortune 500 companies, including AmerisourceBergen, Comcast, Rite Aid, Lincoln National, DuPont, Aramark, Universal Health Services, Toll Brothers, UGI, Burlington Stores, Campbell Soup and Avantor. The metro area also has a large concentration of hospitals and universities. Philadelphia is home to the University of Pennsylvania, Temple University and Drexel University among others. As of 2022, there were more than 180,000 students enrolled in the 32 colleges and universities in the area that have an undergraduate enrollment greater than 500 students.
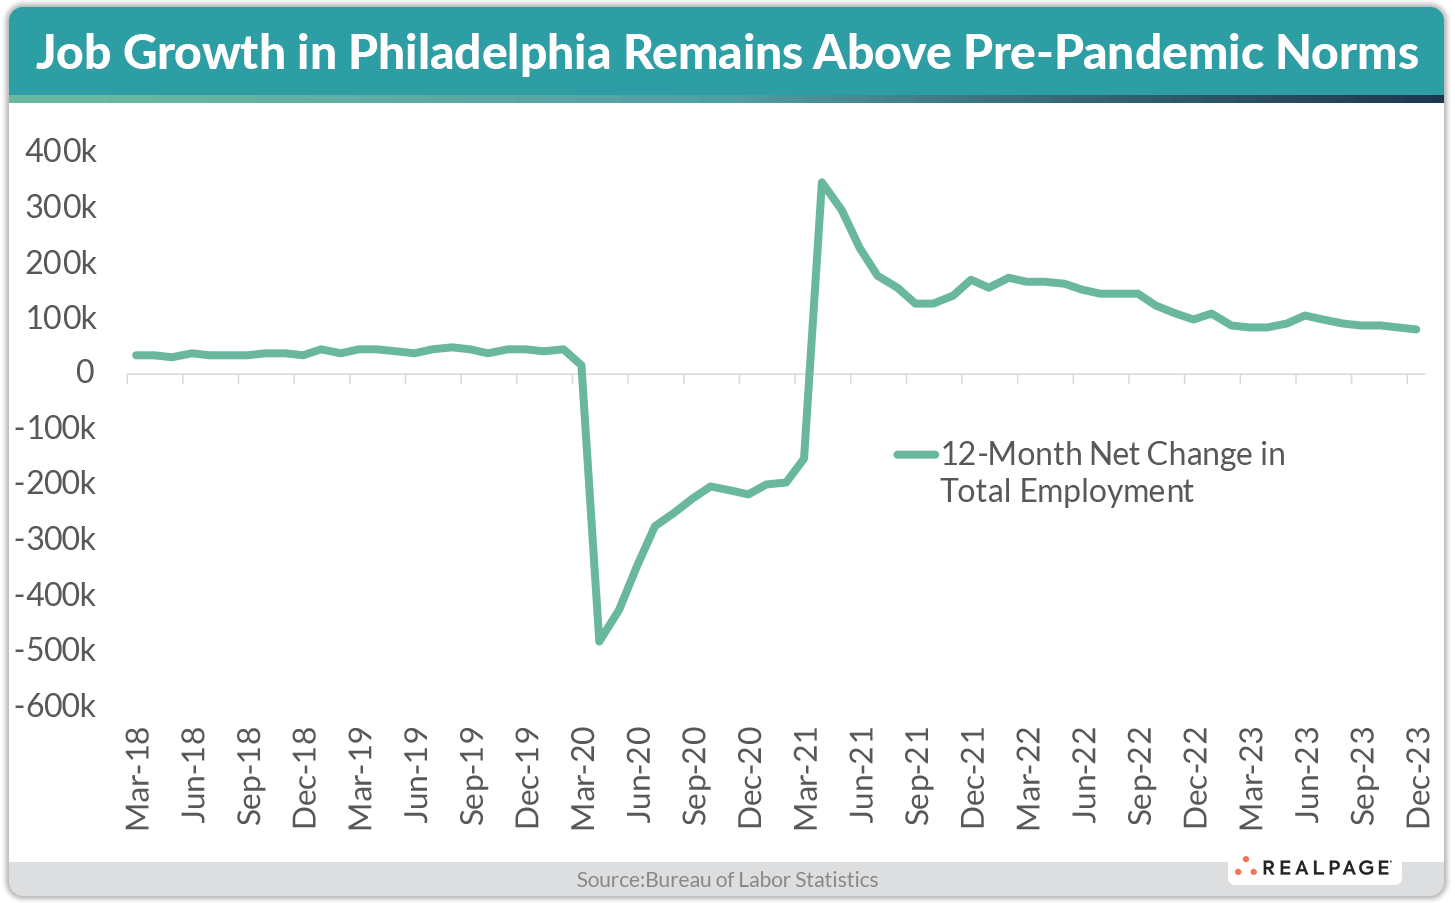
With Philadelphia’s slow and steady economy, the apartment market has historically been a middle-of-the-road performer, but fundamentals have remained above U.S. norms in recent months, propped up by solid job gains. During 2023, Philadelphia posted a net gain of 81,100 jobs, ranking #3 nationally after only Dallas (101,000 jobs) and Los Angeles (95,800 jobs), according to data from the U.S. Bureau of Labor Statistics. Philadelphia’s recent job additions were nearly double the pre-pandemic average. From 2015 to 2019, Philadelphia’s labor market added an average of 41,300 jobs annually. As of December 2023, Philadelphia’s employment base sat roughly 184,000 jobs, or about 6%, above the pre-pandemic level from February 2020. For comparison, the U.S. overall is only 3% above its pre-pandemic job level.
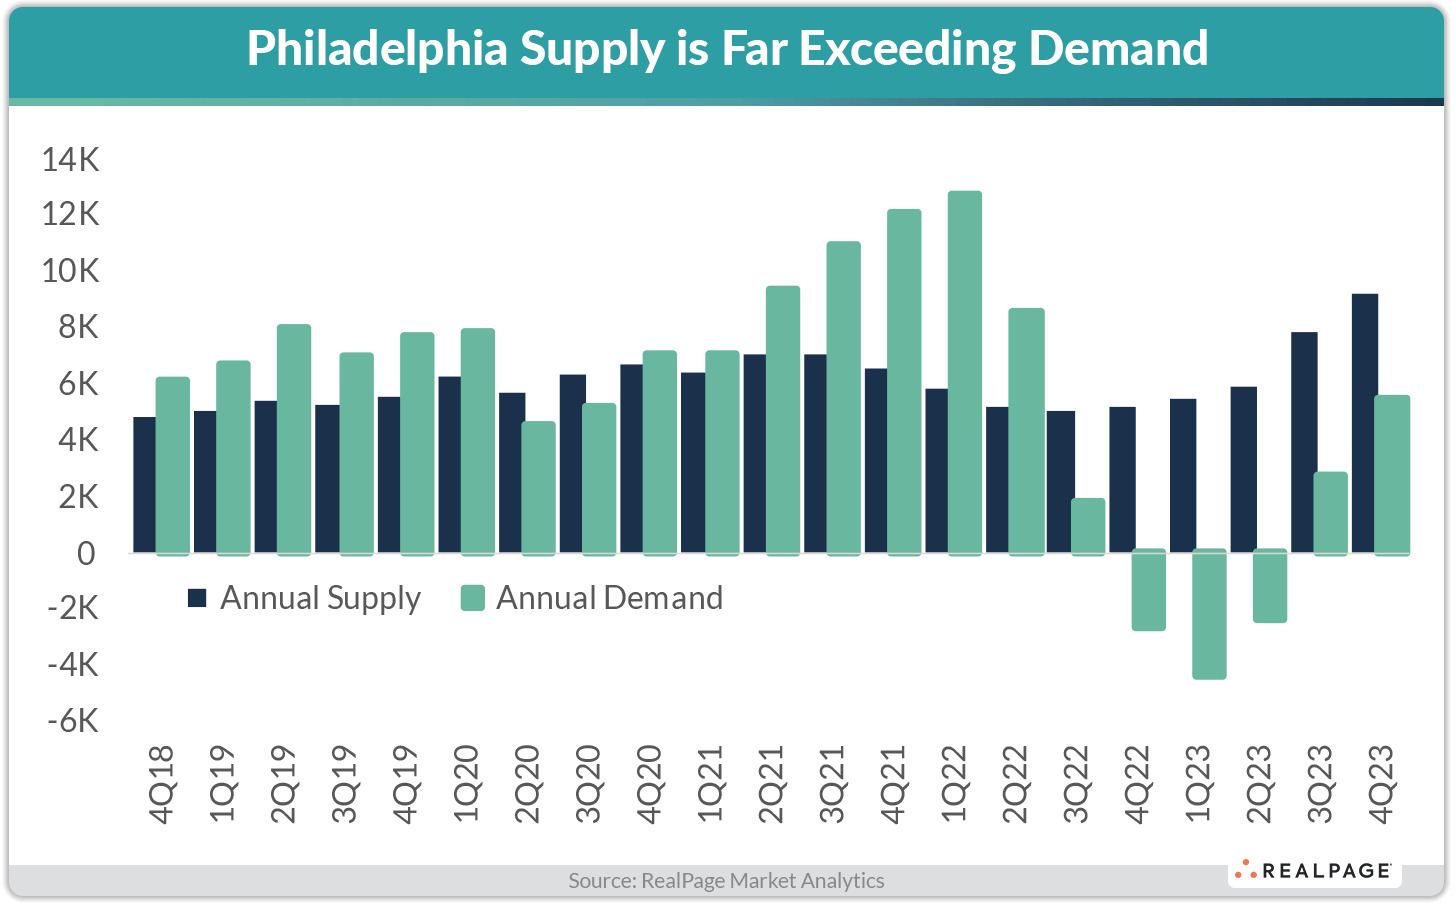
After faltering in late 2022 and into the first half of 2023, apartment demand in Philadelphia continued to improve in 4th quarter with absorption of 1,571 units during the October to December time frame, according to data from RealPage Market Analytics. That was nearly five times the average 4th quarter apartment demand from 2015 to 2019 (roughly 330 units).
On an annual basis, Philadelphia recorded absorption of 5,463 units. That demand volume, while below the peak seen in early 2022, was in line with the pre-pandemic annual average from 2015 to 2019 (5,646 units). Still, improved market demand fell well short of concurrent new supply. In 2023, a total of 9,197 units came online in the market, the highest level since RealPage began tracking the market more than 20 years ago.
Among Philadelphia’s 16 submarkets, 11 posted positive absorption over the past year. The fast-growing Center City Philadelphia neighborhood remained the market leader for both demand (2,316 units) and new supply (2,488 units) in 2023.
The pace of new apartment supply is expected to ramp up as 18,610 units were underway at the end of 2023, with about 13,400 of those units slated for delivery in 2024 – by far the highest level on record since RealPage began tracking the market in 1999. Construction remains largely concentrated in the Center City Philadelphia submarket, which has about 40% of all units currently underway.
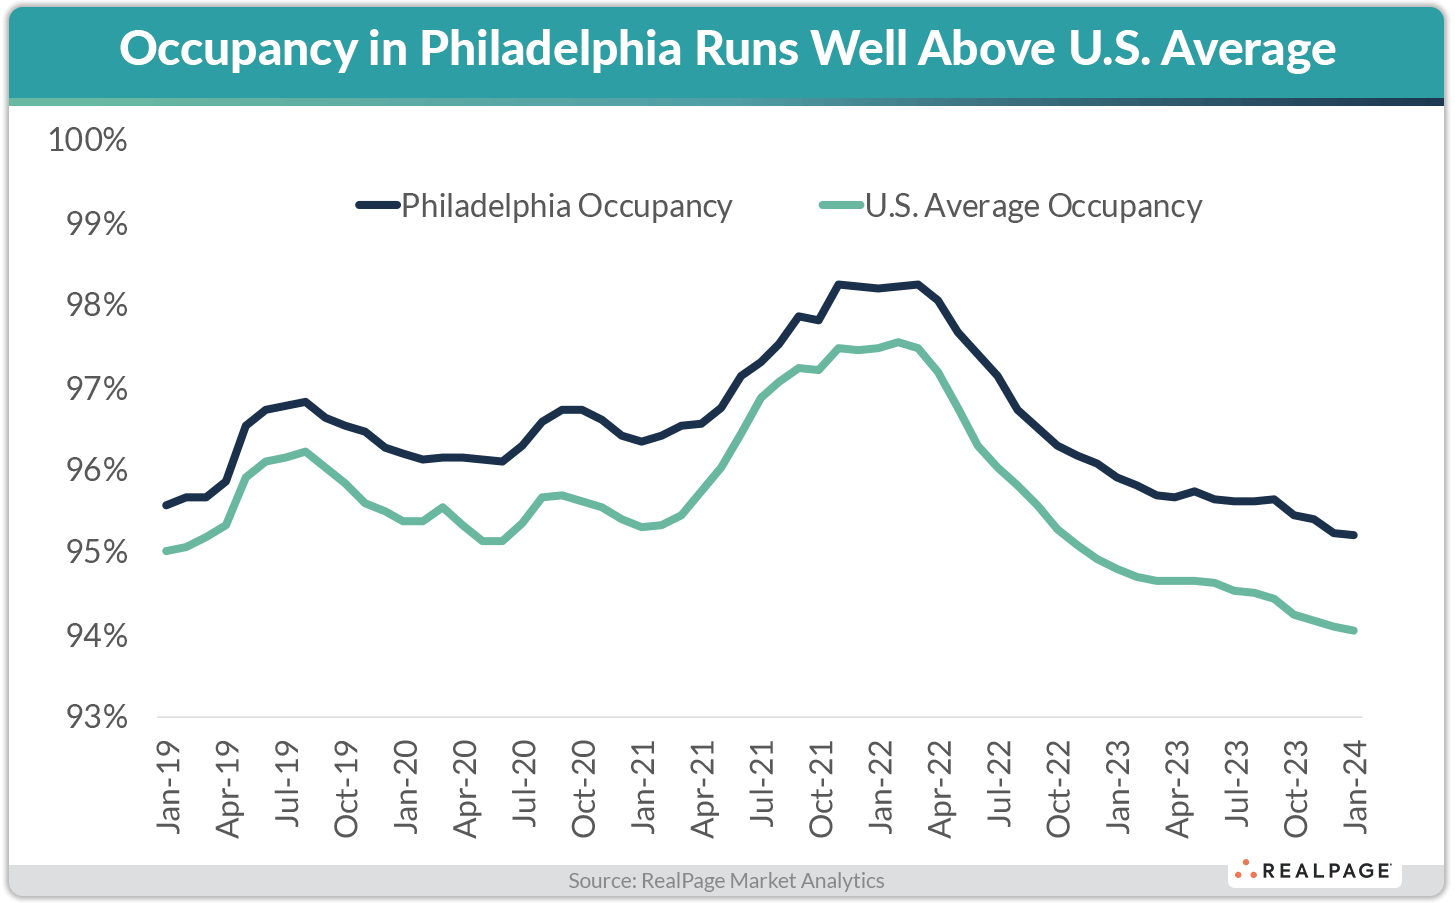
With Philadelphia’s annual supply far exceeding concurrent demand, marketwide occupancy fell 70 basis points (bps) year-over-year but remained solid at 95.2% in January. While that rate was a five-year low and registered 140 bps below the market’s five-year average (96.6%), it was 110 bps above the national norm (94.1%). In addition, Philadelphia’s January occupancy rate ranked #8 among the nation’s 50 largest markets and was just 20 basis points below the pre-pandemic average of 95.6% from 2015 to 2019. Despite the recent softening, Philadelphia has remained a tight occupancy market, with occupancy above the essentially full mark of 95% for nearly six years and exceeding the U.S. norm for eight years.
Occupancy levels by product class in January 2023 reflected typical local norms, with Class C product tightest at 96.2%, followed by Class B units at 95.3%. Class A stock, which is the most impacted by new supply, trailed at 94.3%. Of Philly’s 16 submarkets, 11 posted occupancy at roughly 95% or higher. The weakest reading of 94% was in the high-supply Center City Philadelphia submarket and the strongest reading of 97.2% was in the low-supply Bucks County submarket. Over the past two decades, Bucks County has seen just 1,624 units come online. Center City Philadelphia has delivered more than that level just in the past two quarters.
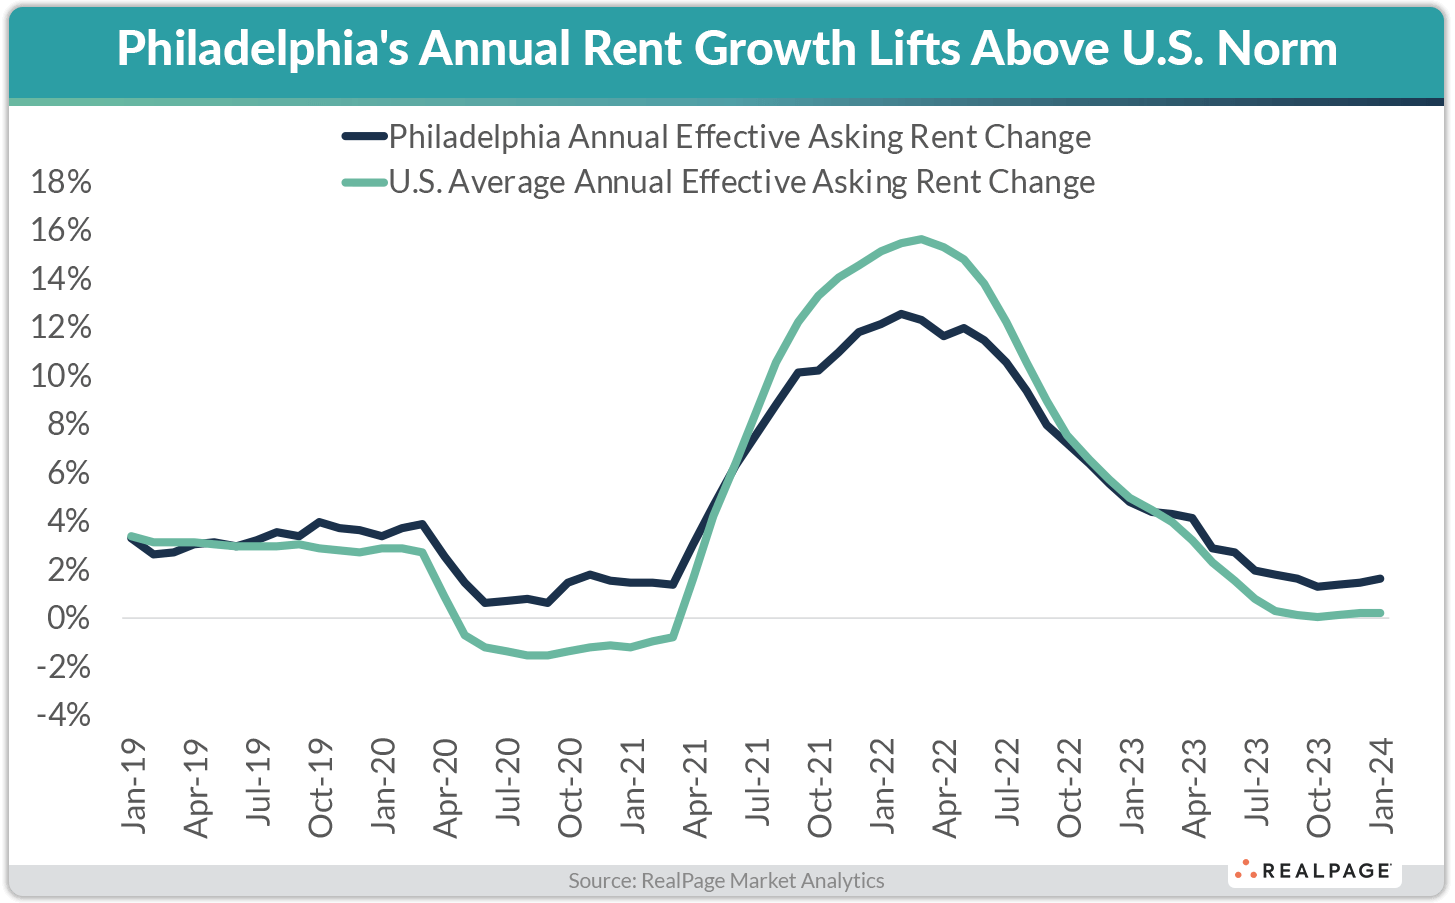
With marketwide occupancy trending down and more supply on the way, apartment operators in Philadelphia have eased up on rent hikes. After reaching unsustainable double-digit annual rent growth from late 2021 and into the first half of 2022, prices have been rising at slower and slower rates. As of January, annual rent growth was marginally below Philadelphia’s pre-pandemic average of 2.6% from 2015 to 2019. Still, the 1.7% year-over-year rent growth the market achieved in January 2024 far outpaced the national average of 0.3% and ranked #16 among the nation’s 50 largest apartment markets.
Despite occupancy remaining comparatively tight in Philadelphia’s Class C product, operators of that asset class only achieved rent growth of 0.8% in the year-ending January. Annual rent growth was higher in Class A and B stock, at 1.4% and 2.3%, respectively. Among submarkets, Southwest Philadelphia was the only one to see rent cuts over the past year, though the decline was mild at 0.2%. the biggest annual price hike of 4.6% was recorded in Central Wilmington. Despite the onslaught of new supply, Center City Philadelphia was able to eke out a price increase over the past year, though mild at 0.7%.
Elevated new supply levels and moderating market conditions will continue to weigh on local performance, though demand is forecasted to rebound more significantly over the coming year, especially in high-supply submarkets. However, the combination of slow growing industries and the concentration of older adults in Philadelphia could dampen apartment performance. Still, Philadelphia’s stable economy should support solid apartment market fundamentals for years to come.


