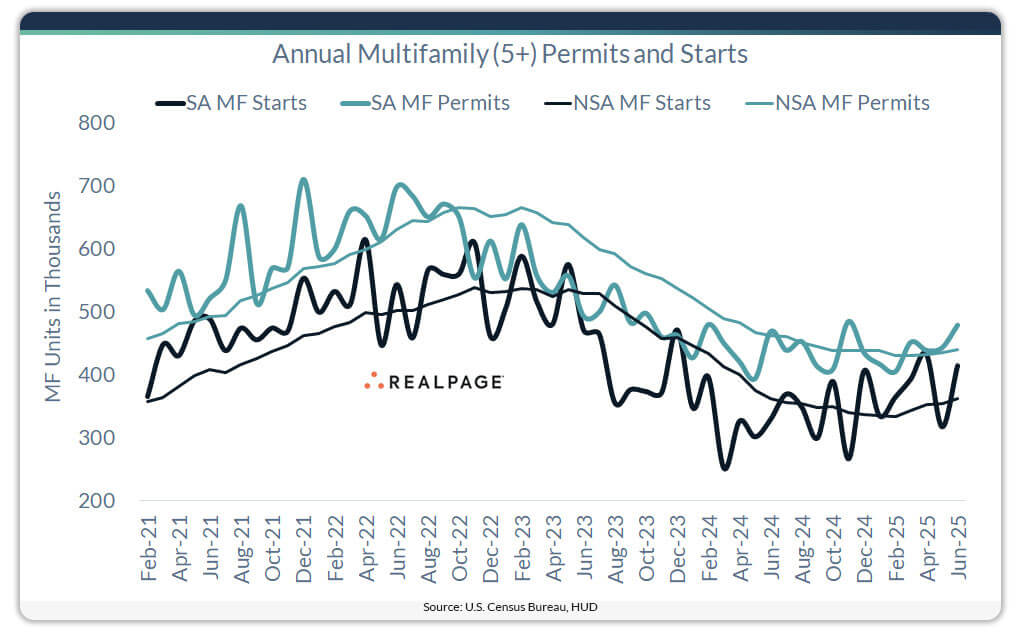
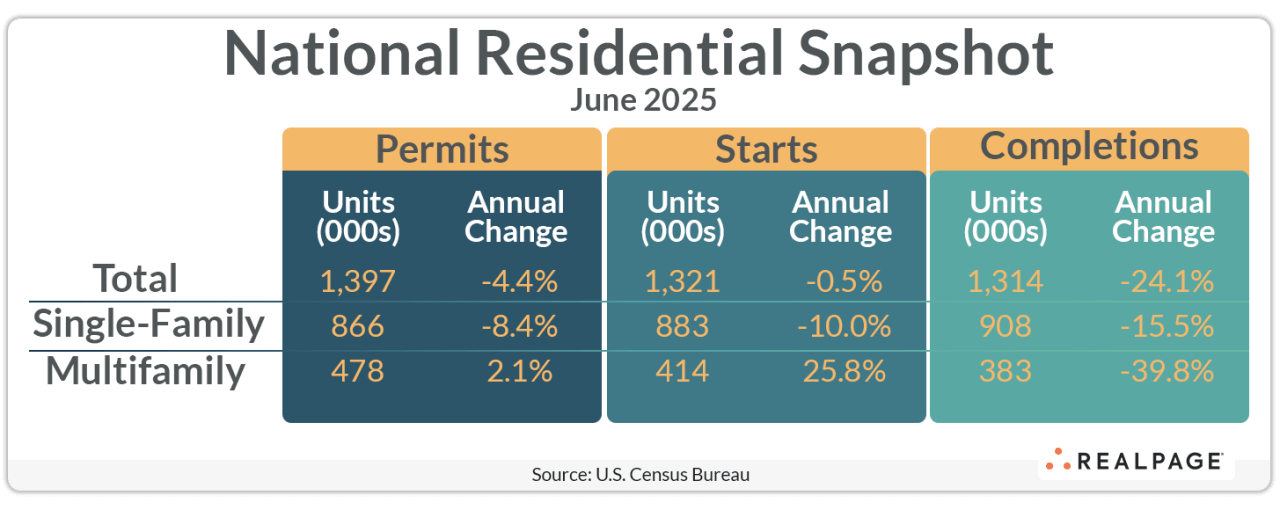
There are some who find it hard to believe that the supply cycle may be turning up again, especially if you don’t trust the Census Bureau’s seasonally adjusted annual rate (SAAR) for multifamily starts. That rate increased 30.6% from last month to 414,000 units in June after falling 26.6% from April to May. Year-over-year, the increase is 25.8%.
The 414,000 unit starts figure comes from seasonally adjusting June’s monthly starts figure of 36,700 units and annualizing it by multiplying by 12. This methodology results in some erratic month-over-month movement in the annual rate, especially since the monthly starts figure comes from a small sample from HUD’s Survey of Construction, which surveys only about 900 permit issuing places (out of almost 20,000 permitting places nationally).
The SAAR for multifamily permitting also exhibits erratic movement but not as severe as the starts series. June’s SAAR for multifamily permitting increased 8.1% from May to June but is up only 2.1% year-over-year at 478,000 units.
Looking at the unadjusted housing data, the moving 12-month total for unadjusted multifamily starts shows a four-month upward trend while the trend for unadjusted multifamily permitting over the same period is relatively flat, averaging close to 430,000 units for four months before a slight uptick in June. Building permits are a leading indicator for starts, and there should be more upward movement in building permits if starts are increasing.
Multifamily construction does appear to be in a bottoming out period currently but the timing and magnitude of a recovery in multifamily construction is yet to be seen. Additionally, bear in mind that multifamily (5+) permitting includes more than conventional, institutional grade, market rate apartments that industry watchers are concerned with. Potentially, the recent modest increase in permitting could be at least partially attributable to affordable, senior and student apartments, as well as condominiums and townhomes.
On the single-family side, high mortgage rates and economic uncertainty have slowed permitting and starts. The SAAR for single-family permitting decreased 3.7% for the month and 8.4% from last year to 866,000 units, the lowest annual rate since March 2023. June’s report from the Census Bureau and HUD saw the SAAR for single-family starts fall 4.6% from May and 10% from last June to 883,000 units, also the lowest since early 2023.
Together with the small plex product, total residential permitting was down 4.4% for the year but virtually unchanged for the month at 1.397 million units. The annual rate for total residential starts dipped 0.5% from last May to 1.321 million units, but this month’s big jump in multifamily boosted starts by 4.6% for the month.
The SAAR for multifamily units under construction decreased 19.6% from last June and 0.6% from May to 720,000 units. Single-family units under construction were down 6.0% for the year and 0.3% from May to 622,000 units.
Multifamily completions were down almost 40% from last June and 21% for the month at 383,000 units. Meanwhile, single-family completions fell 12.5% from May to 908,000 units and were down 15.5% from last year.
Compared to one year ago, the annual rate for multifamily permitting increased in the Midwest region (up 10.5% to 82,000 units) and South region (up 4.5% to 250,000 units). The small Northeast region had a 15.8% decrease in annual permitting to 39,000 units, while the West region was down only 1.1% to 108,000 units. Compared to the previous month, permitting was also down in the Northeast and West and up in the South and Midwest.
Annualized multifamily starts more than doubled in the Northeast region (up 145.8% to 110,000 units) and were up 28.7% in the South region to 185,000 units. The Midwest region experienced a decrease of 37.9% to 34,000 units, while the West region saw starts decrease by just 0.9% to 85,000 units. Compared to May’s SAAR, starts were down only in the Midwest region and up in the Northeast, West and South regions.
This post is part of a series by RealPage Senior Real Estate Economist Chuck Ehmann analyzing residential permits and starts data from the U.S. Census Bureau. For more on this data, read previous posts in the Permits series.


