DC Dominates List of Best-Performing Urban Core Apartment Submarkets

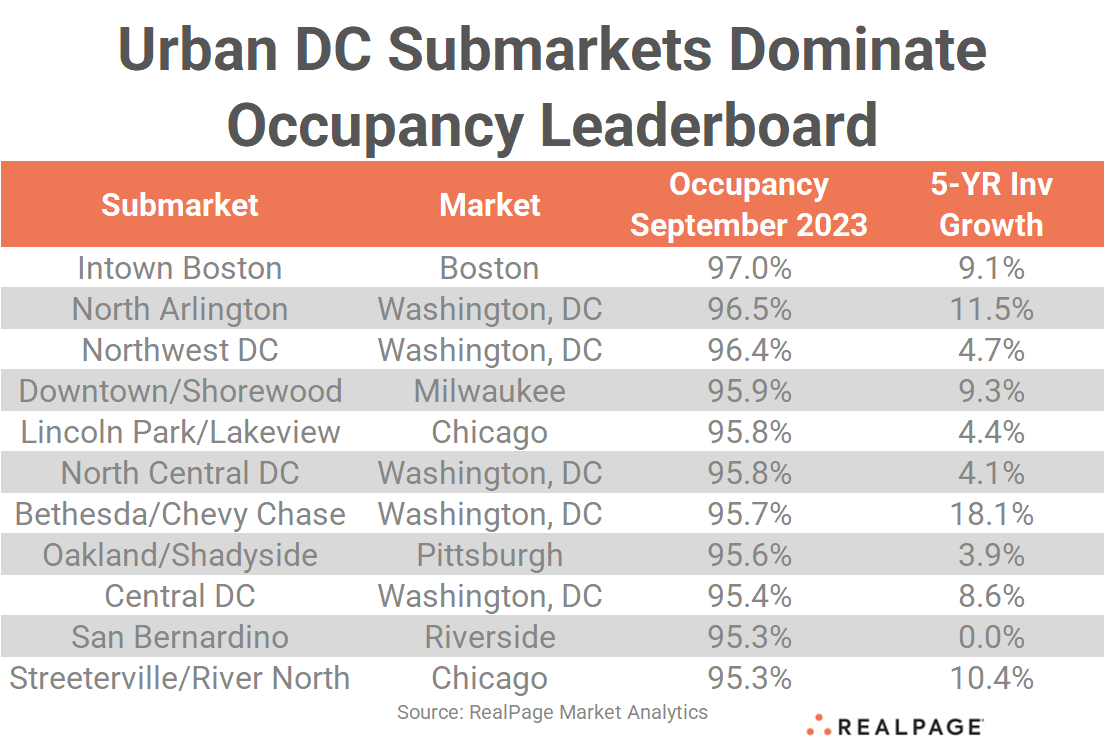
Roughly half of the nation’s best-occupied urban core submarkets are in Washington, DC.
For the most part, the top apartment occupancy performances among urban core submarkets were in those areas that saw some of the mildest apartment deliveries in the past five years.
The urban core with the highest conventional apartment occupancy showing in September was Intown Boston, with a rate of 97%, according to data from RealPage Market Analytics. New apartment completions in this urban core have been relatively modest, swelling the existing unit base by 9.1% in the past five years.
In Washington, DC’s North Arlington submarket, September occupancy registered at 96.5%, after the existing base grew by 11.5% since 2018. Of note, all the DC submarkets on this list saw fairly tight occupancy across the board, with Class A stock bringing up the tail end, with rates of about 94% to 96%. North Arlington was the only exception, however, with Class A stock at a very tight 96.7% dominating over Class B properties, which were a bit softer at 95.7%.

Located just across the Potomac River, Northwest DC logged occupancy at a tight 96.4%, while neighboring urban core North Central DC posted occupancy of 95.8%, tying with Chicago’s Lincoln Park/Lakeview submarket. All three of those urban cores saw inventory growth around 4% to 5% – some of the smallest increases nationwide – in the past five years.
Bethesda/Chevy Chase logged a notable occupancy showing of 95.7% as of September. This urban core stands out as one that has seen more than its fair share of supply since 2018, with apartment inventory growing by 18.1%. Still, that’s mild compared to the growth of roughly 50% to 75% seen in the urban Navy Yard/Capitol South and Northeast DC submarkets. As a result, apartment occupancy in those high-supply neighborhoods was much softer at 93.5% in September.
And finally, the small Central DC submarket was 95.4% full after logging an inventory increase of 8.6% since 2018.
Nationwide, five other submarkets made this list of top urban core occupancy performers, but those neighborhoods were fairly spread out across the U.S., in Milwaukee, Chicago, Pittsburgh and Riverside.
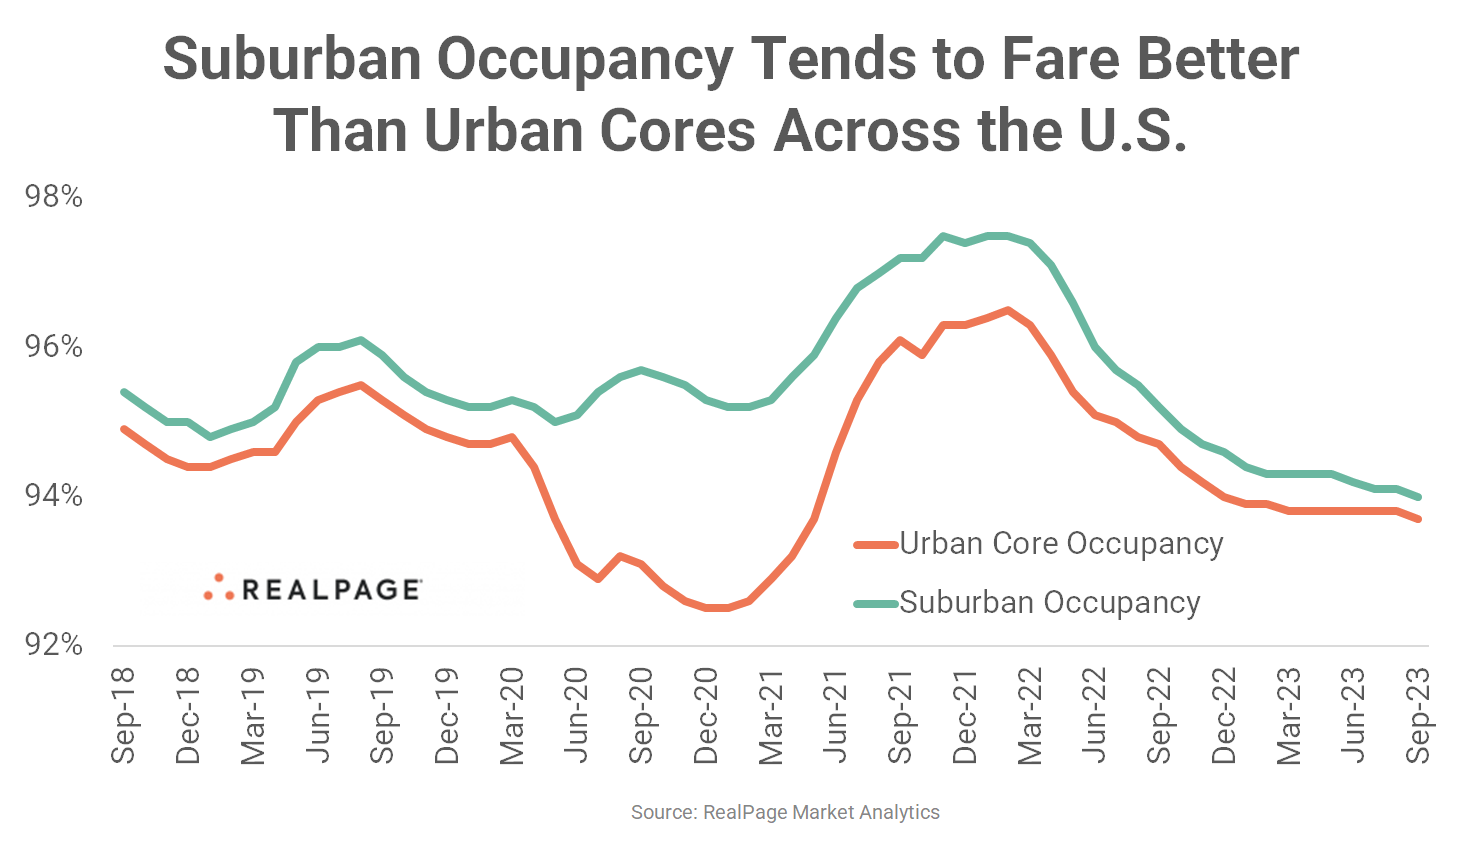
While suburban submarkets tend to fare better for apartment occupancy than urban neighborhoods, that gap has tightened recently. In the U.S. overall, average urban core occupancy was at 93.7% in September, which was just a few ticks behind the suburban rate of 94%.

Overall, Washington, DC was one of the nation’s best apartment demand performers in the past year, with absorption of nearly 8,200 units. New supply was also one of the biggest in the U.S., with almost 14,500 units delivering in the capital in the year-ending 3rd quarter.
Washington, DC’s supply and demand imbalance pulled occupancy down by 70 basis points (bps) in the past year to 95% in September. While that’s a bit behind the market’s five-year average, it is several ticks above the national norm of 94.4%.
A few suburban areas stood out as occupancy leaders, with Columbia Pike, Frederick and East Silver Spring/Takoma Park/Adelphi logging rates between 96.6% and 96.9% in September. However, not far behind was the 96.5% showing in the urban North Arlington submarket.
Across the price spectrum, Washington, DC’s Class B units claimed the strongest occupancy (95.5%), while Class A (95.0%) and Class C (94.5%) trailed slightly.


