The Cleveland apartment market has been exceeding U.S. norms for occupancy and rent growth, while construction activity remains low. Among the nation’s largest 50 apartment markets, Cleveland has the smallest proportion of units under construction. Located along the southern shore of Lake Erie, Cleveland has a little more than 171,000 existing apartment units.
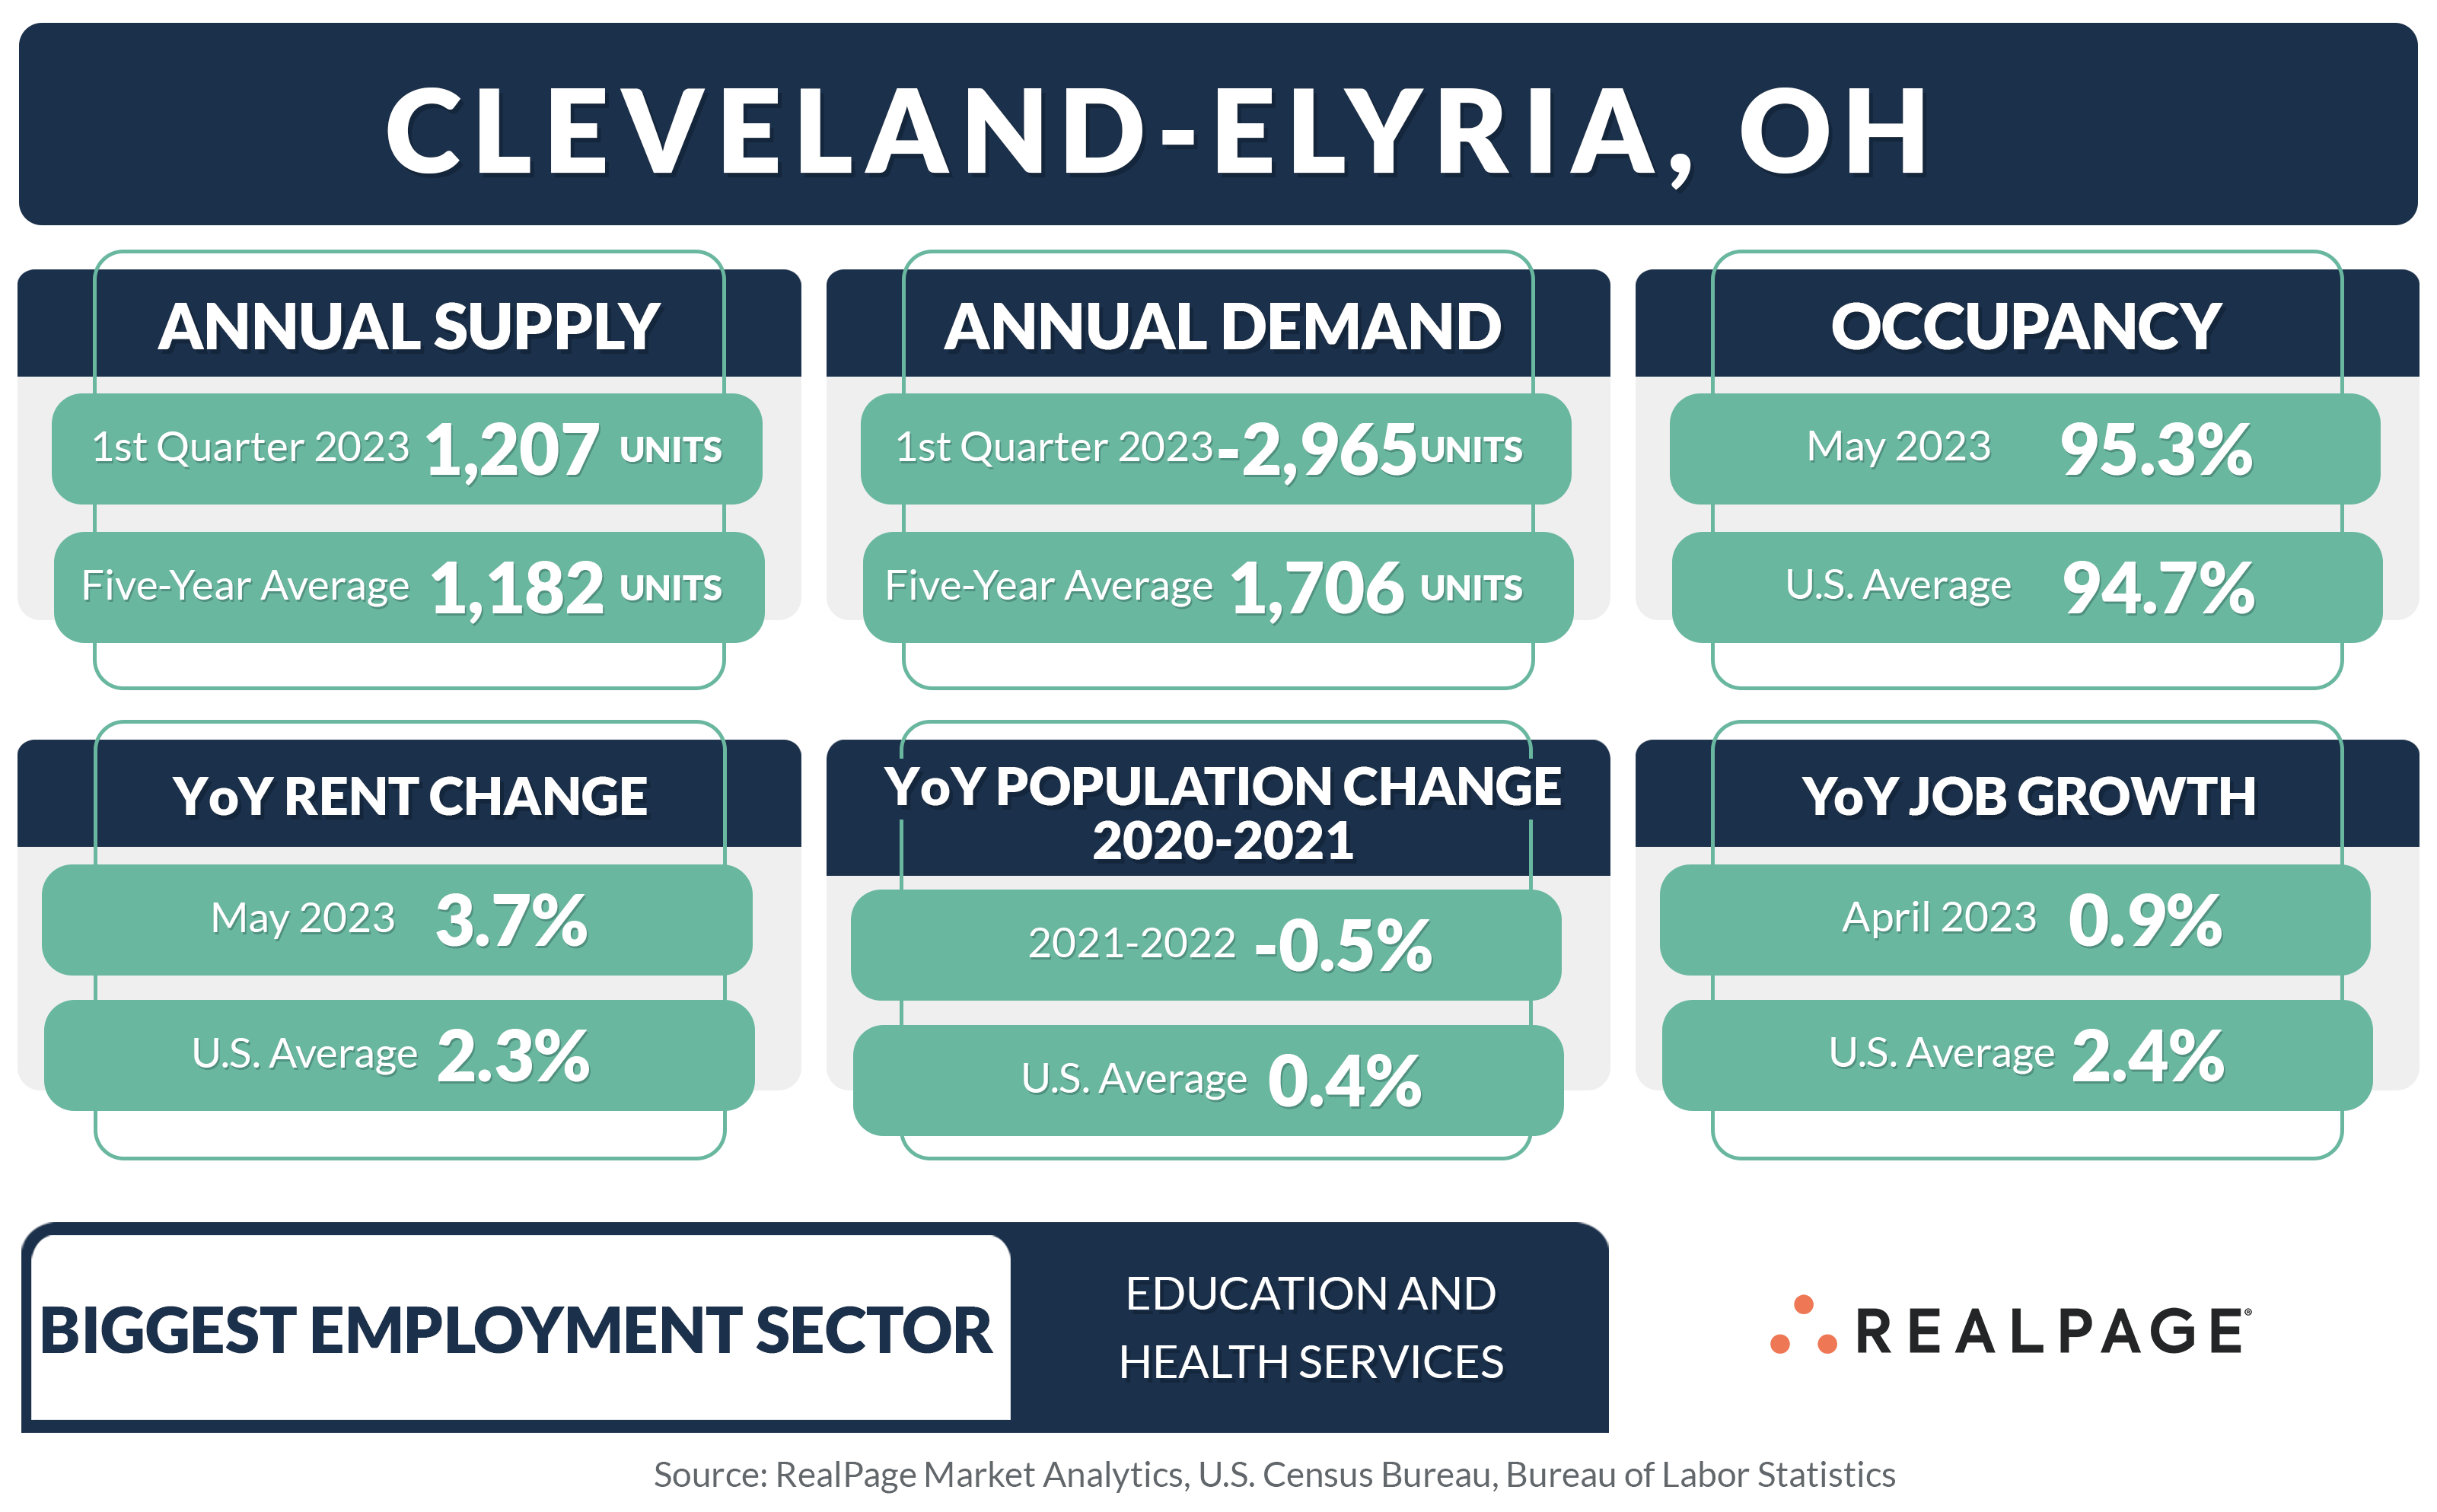
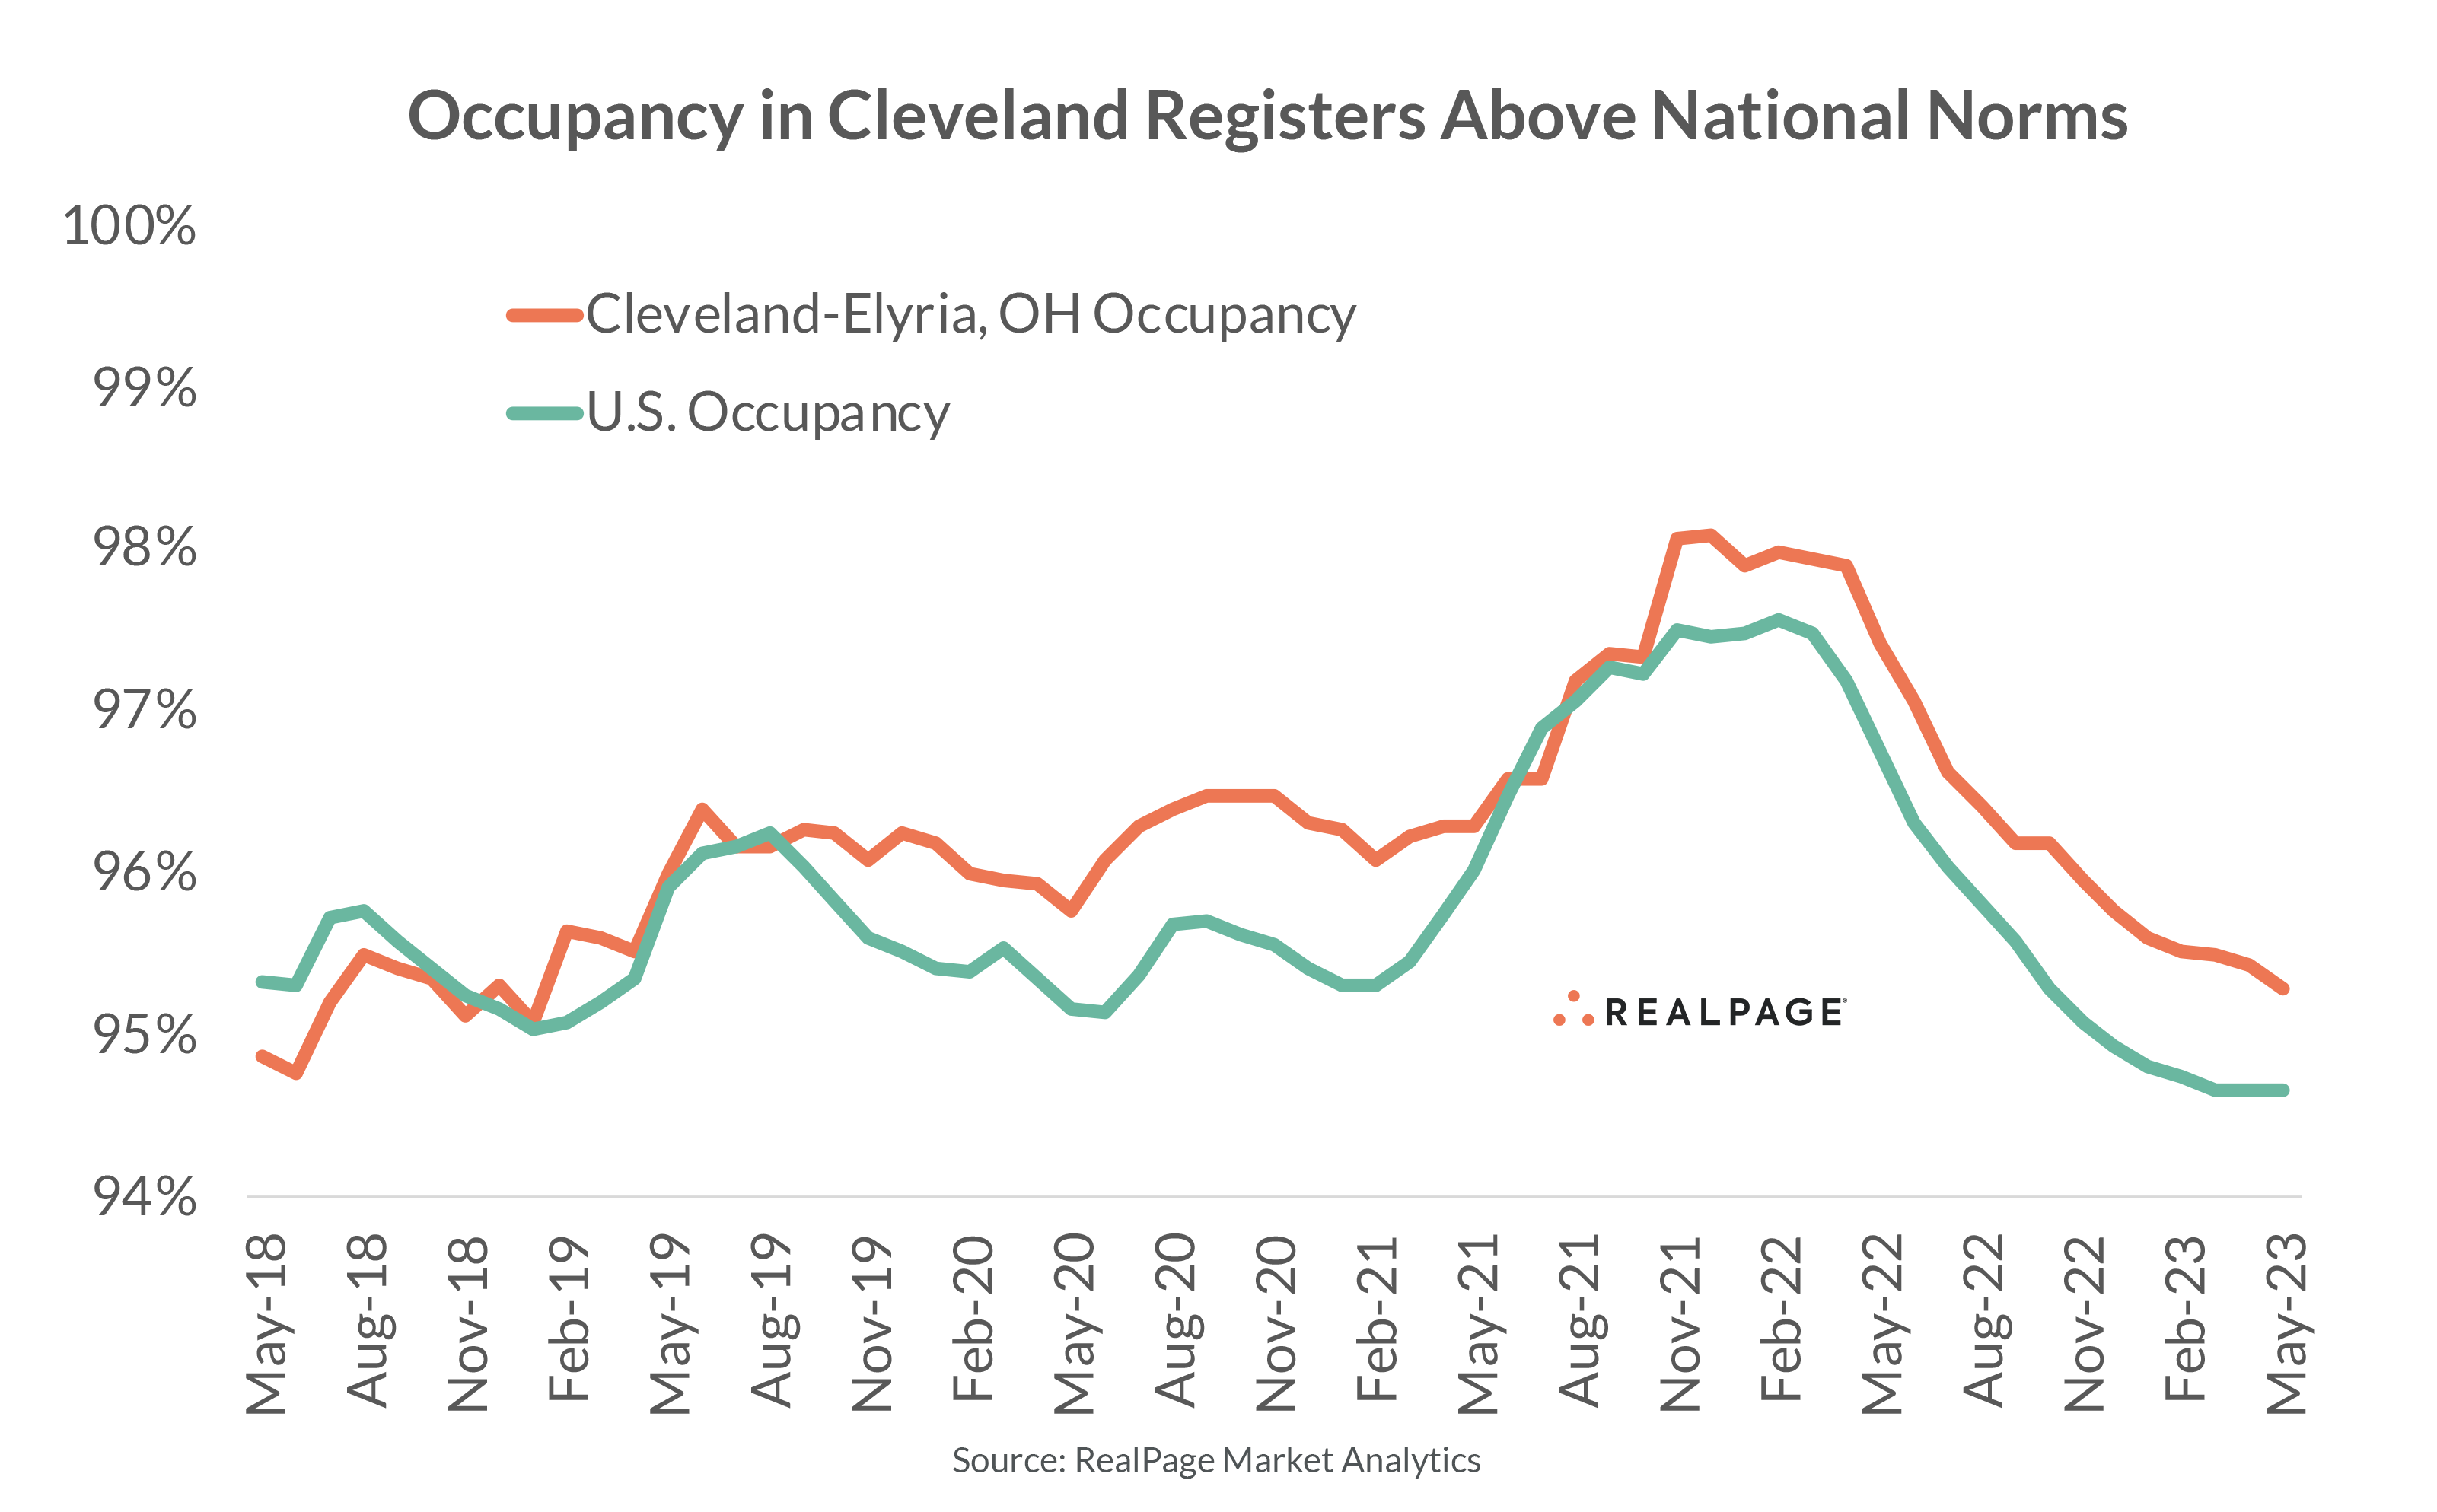
Occupancy in Cleveland has registered above 95% for five years. During that period, occupancy peaked at 98% in early 2022 and has since been trending down. Net move-outs in the year-ending May pulled occupancy down by 210 basis points (bps) year-over-year, with the rate landing at 95.3% in May, according to data from RealPage Market Analytics. While that was slightly above Cleveland’s five-year norm from 2015 to 2019 (95%), the current showing was higher than the national average (94.7%). In fact, Cleveland has registered occupancy above the U.S. norm for much of the past five years.
Class A occupancy in Cleveland slipped to 94.2% in May, while Class B occupancy stood at 94.8% and Class C properties were 96.3% full. Among Cleveland’s 10 submarkets, four – Westlake/North Olmsted/Lorain County, Lake County, Parma/Middleburg Heights and Strongsville/North Royalton/Medina – had occupancy rates above 96% in May. Only Central Cleveland (91.1%) posted occupancy below 93%.
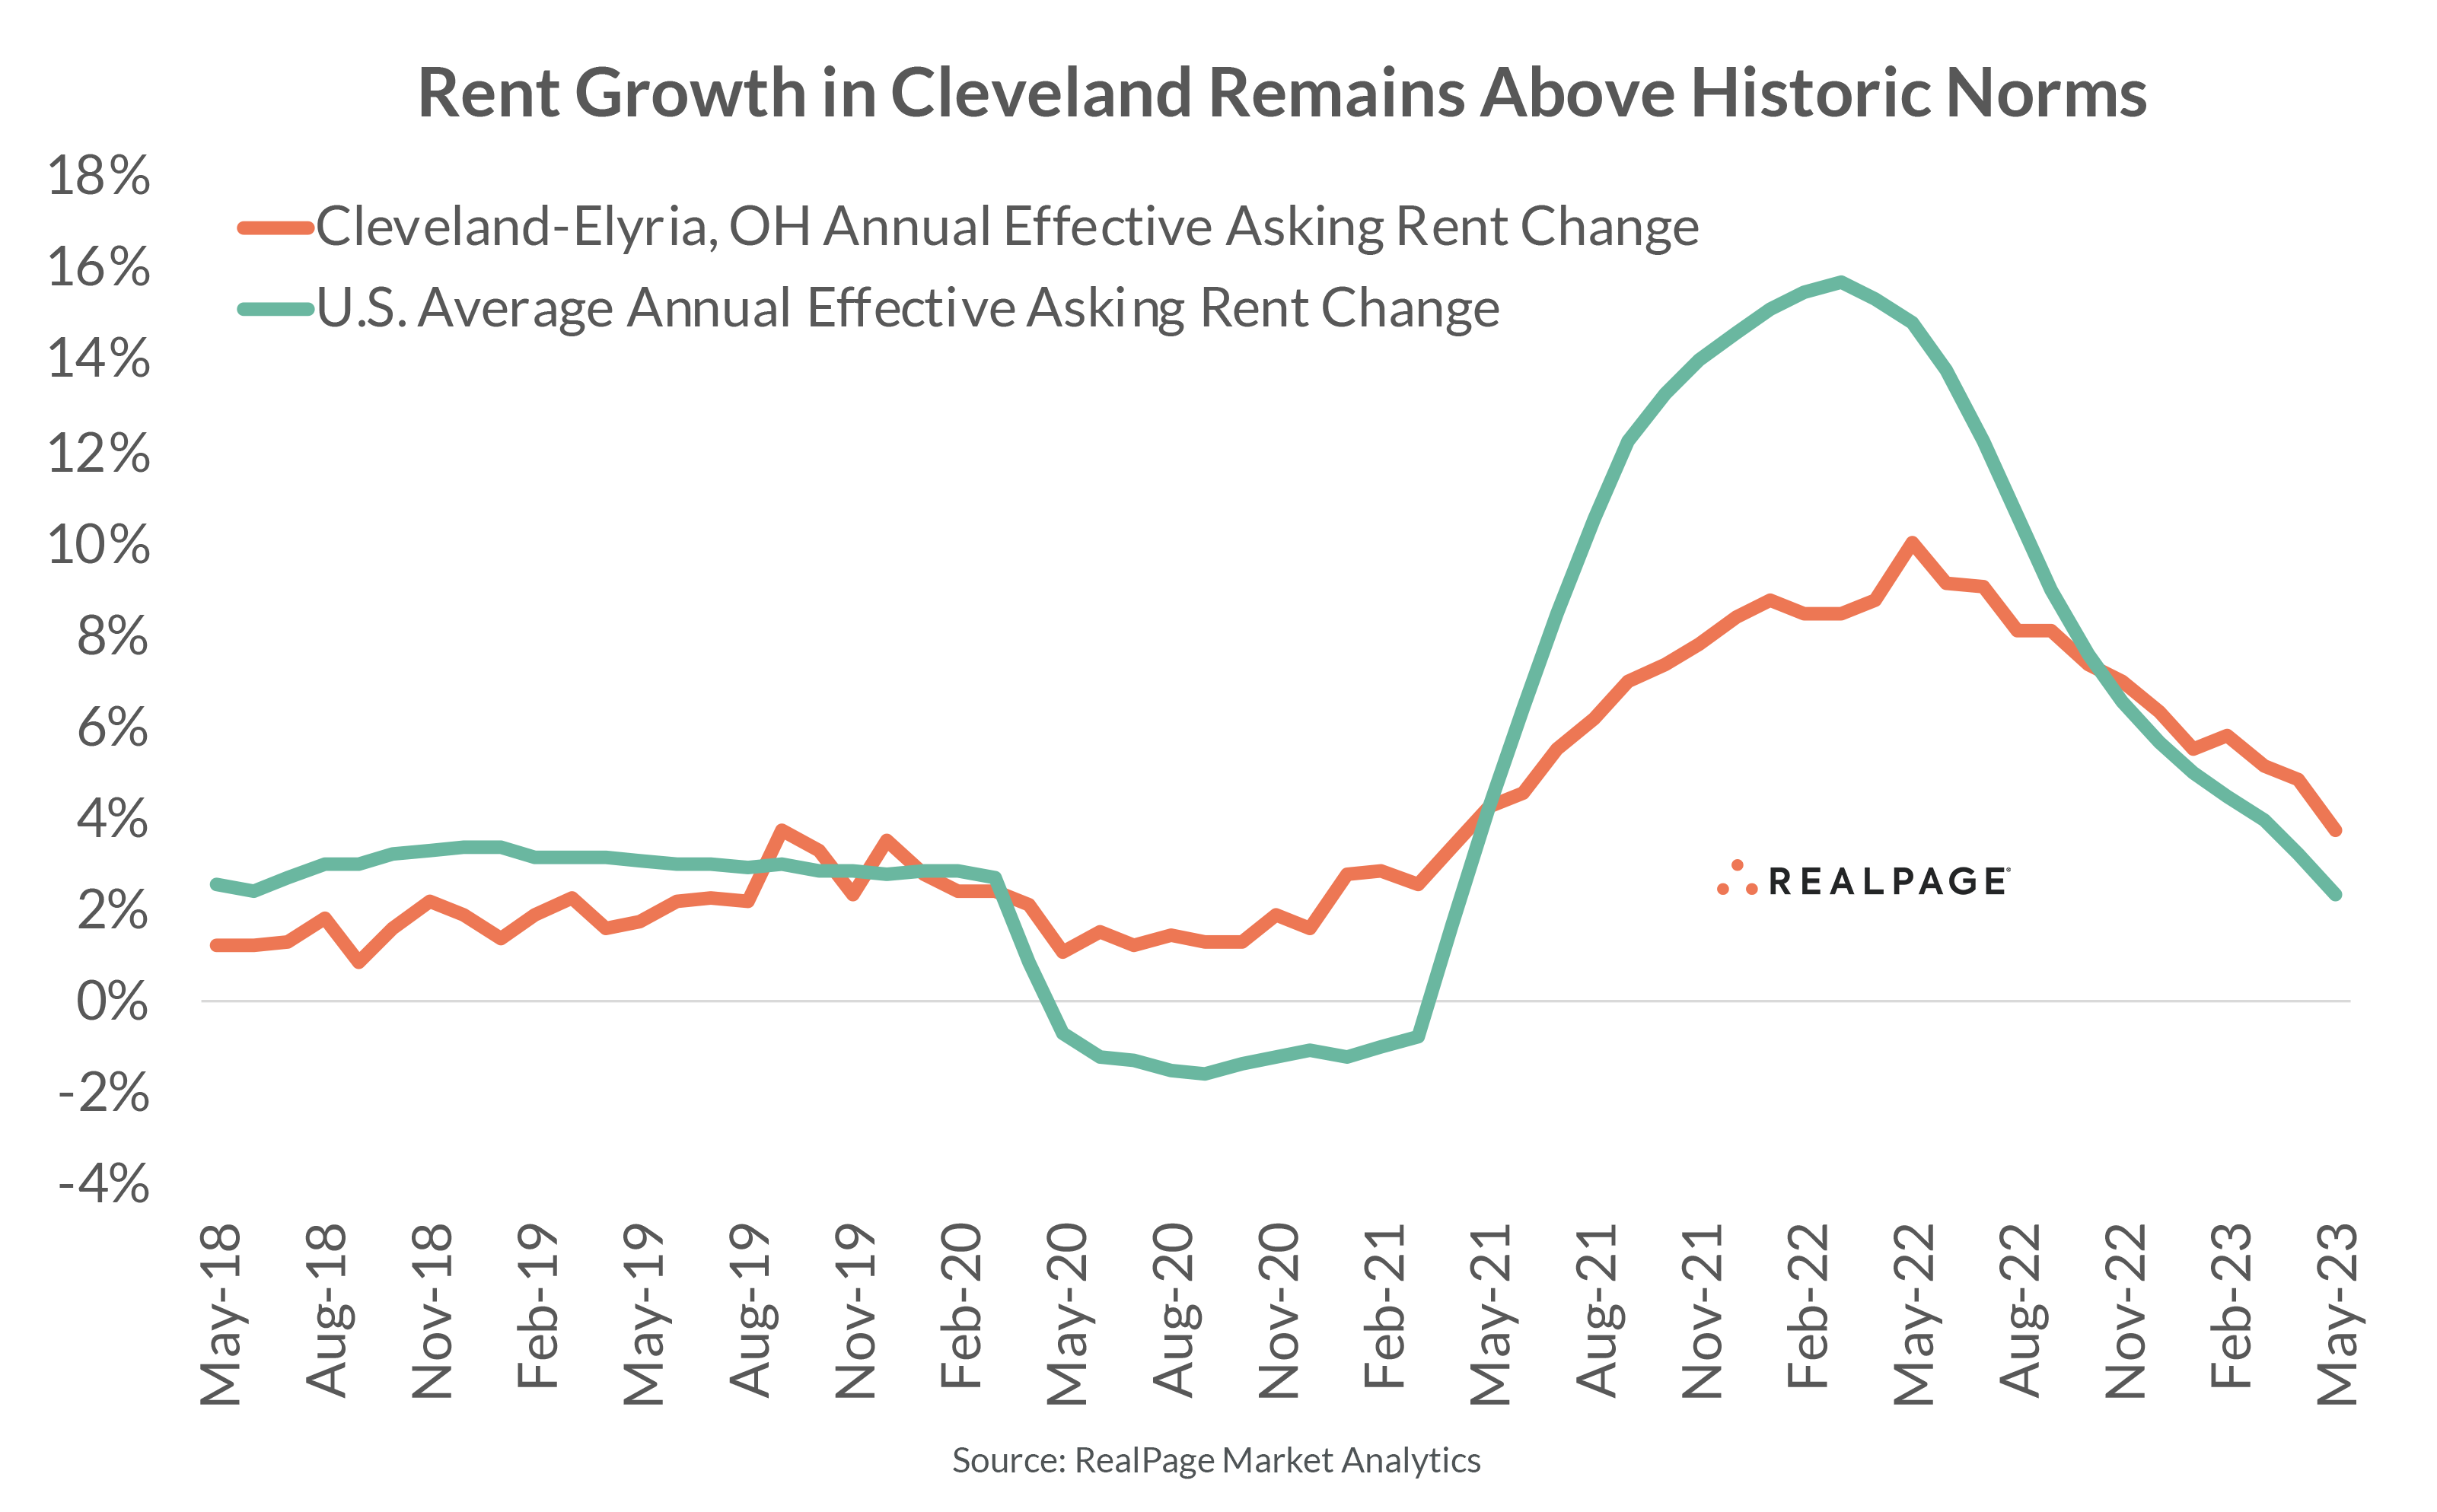
Like occupancy, annual rent growth remains above historic norms but is slowing from unsustainable levels (though the peaks seen here didn’t rival the gains in other markets). During the pandemic, rents were never cut in Cleveland and annual rent growth peaked at 10% a year ago. Cleveland’s annual change in effective asking rents was a solid 3.7% in May 2023 and registered above the national average increase of 2.3%. Cleveland’s recent rent growth was also above the market’s average increase of 2.3% during the five years leading up to the pandemic (2015 to 2019).
Across product classes in Cleveland, Class A and B led, both with 4.6% annual rent growth. Class C lagged with a year-over-year increase at a more muted 1.9%. Submarket-level rent growth ranged from 2% in both Euclid and Lake County to 8.1% in Westlake/North Olmsted/Lorain County.
Despite the recent rent increases, Cleveland has the third most affordable market among the top 50 markets nationally, with monthly rents averaging $1,226 as of May.
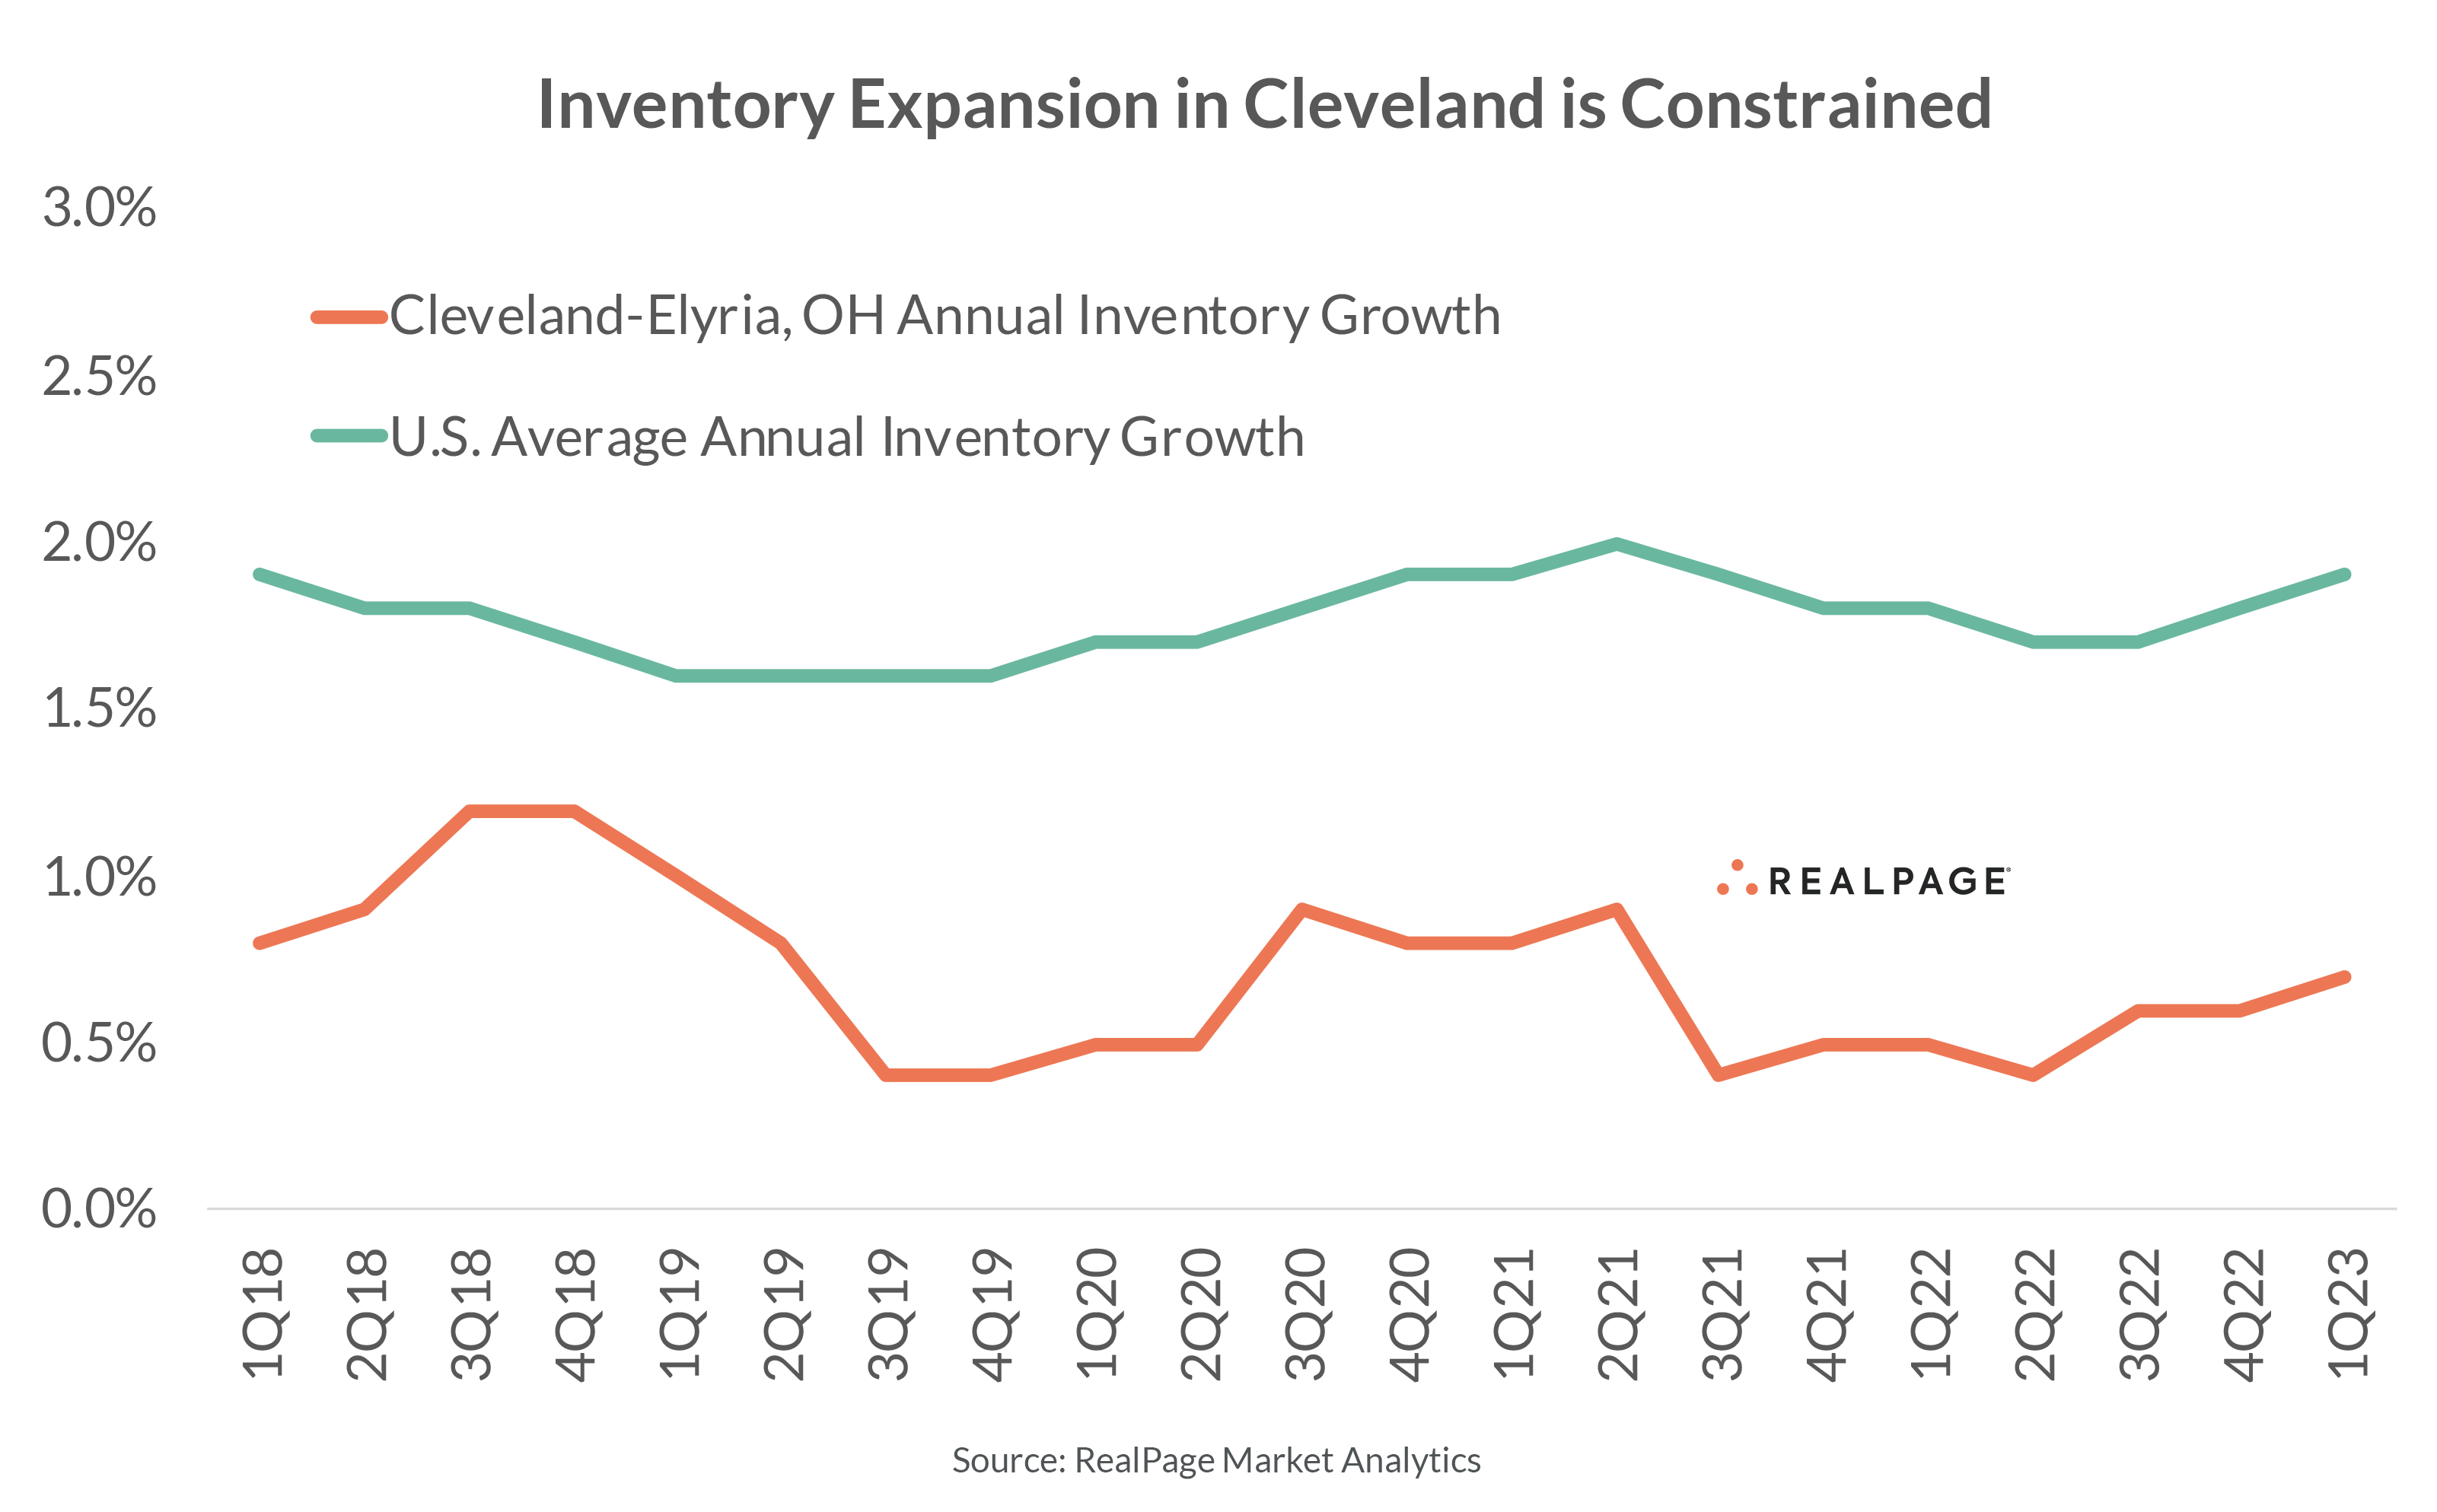
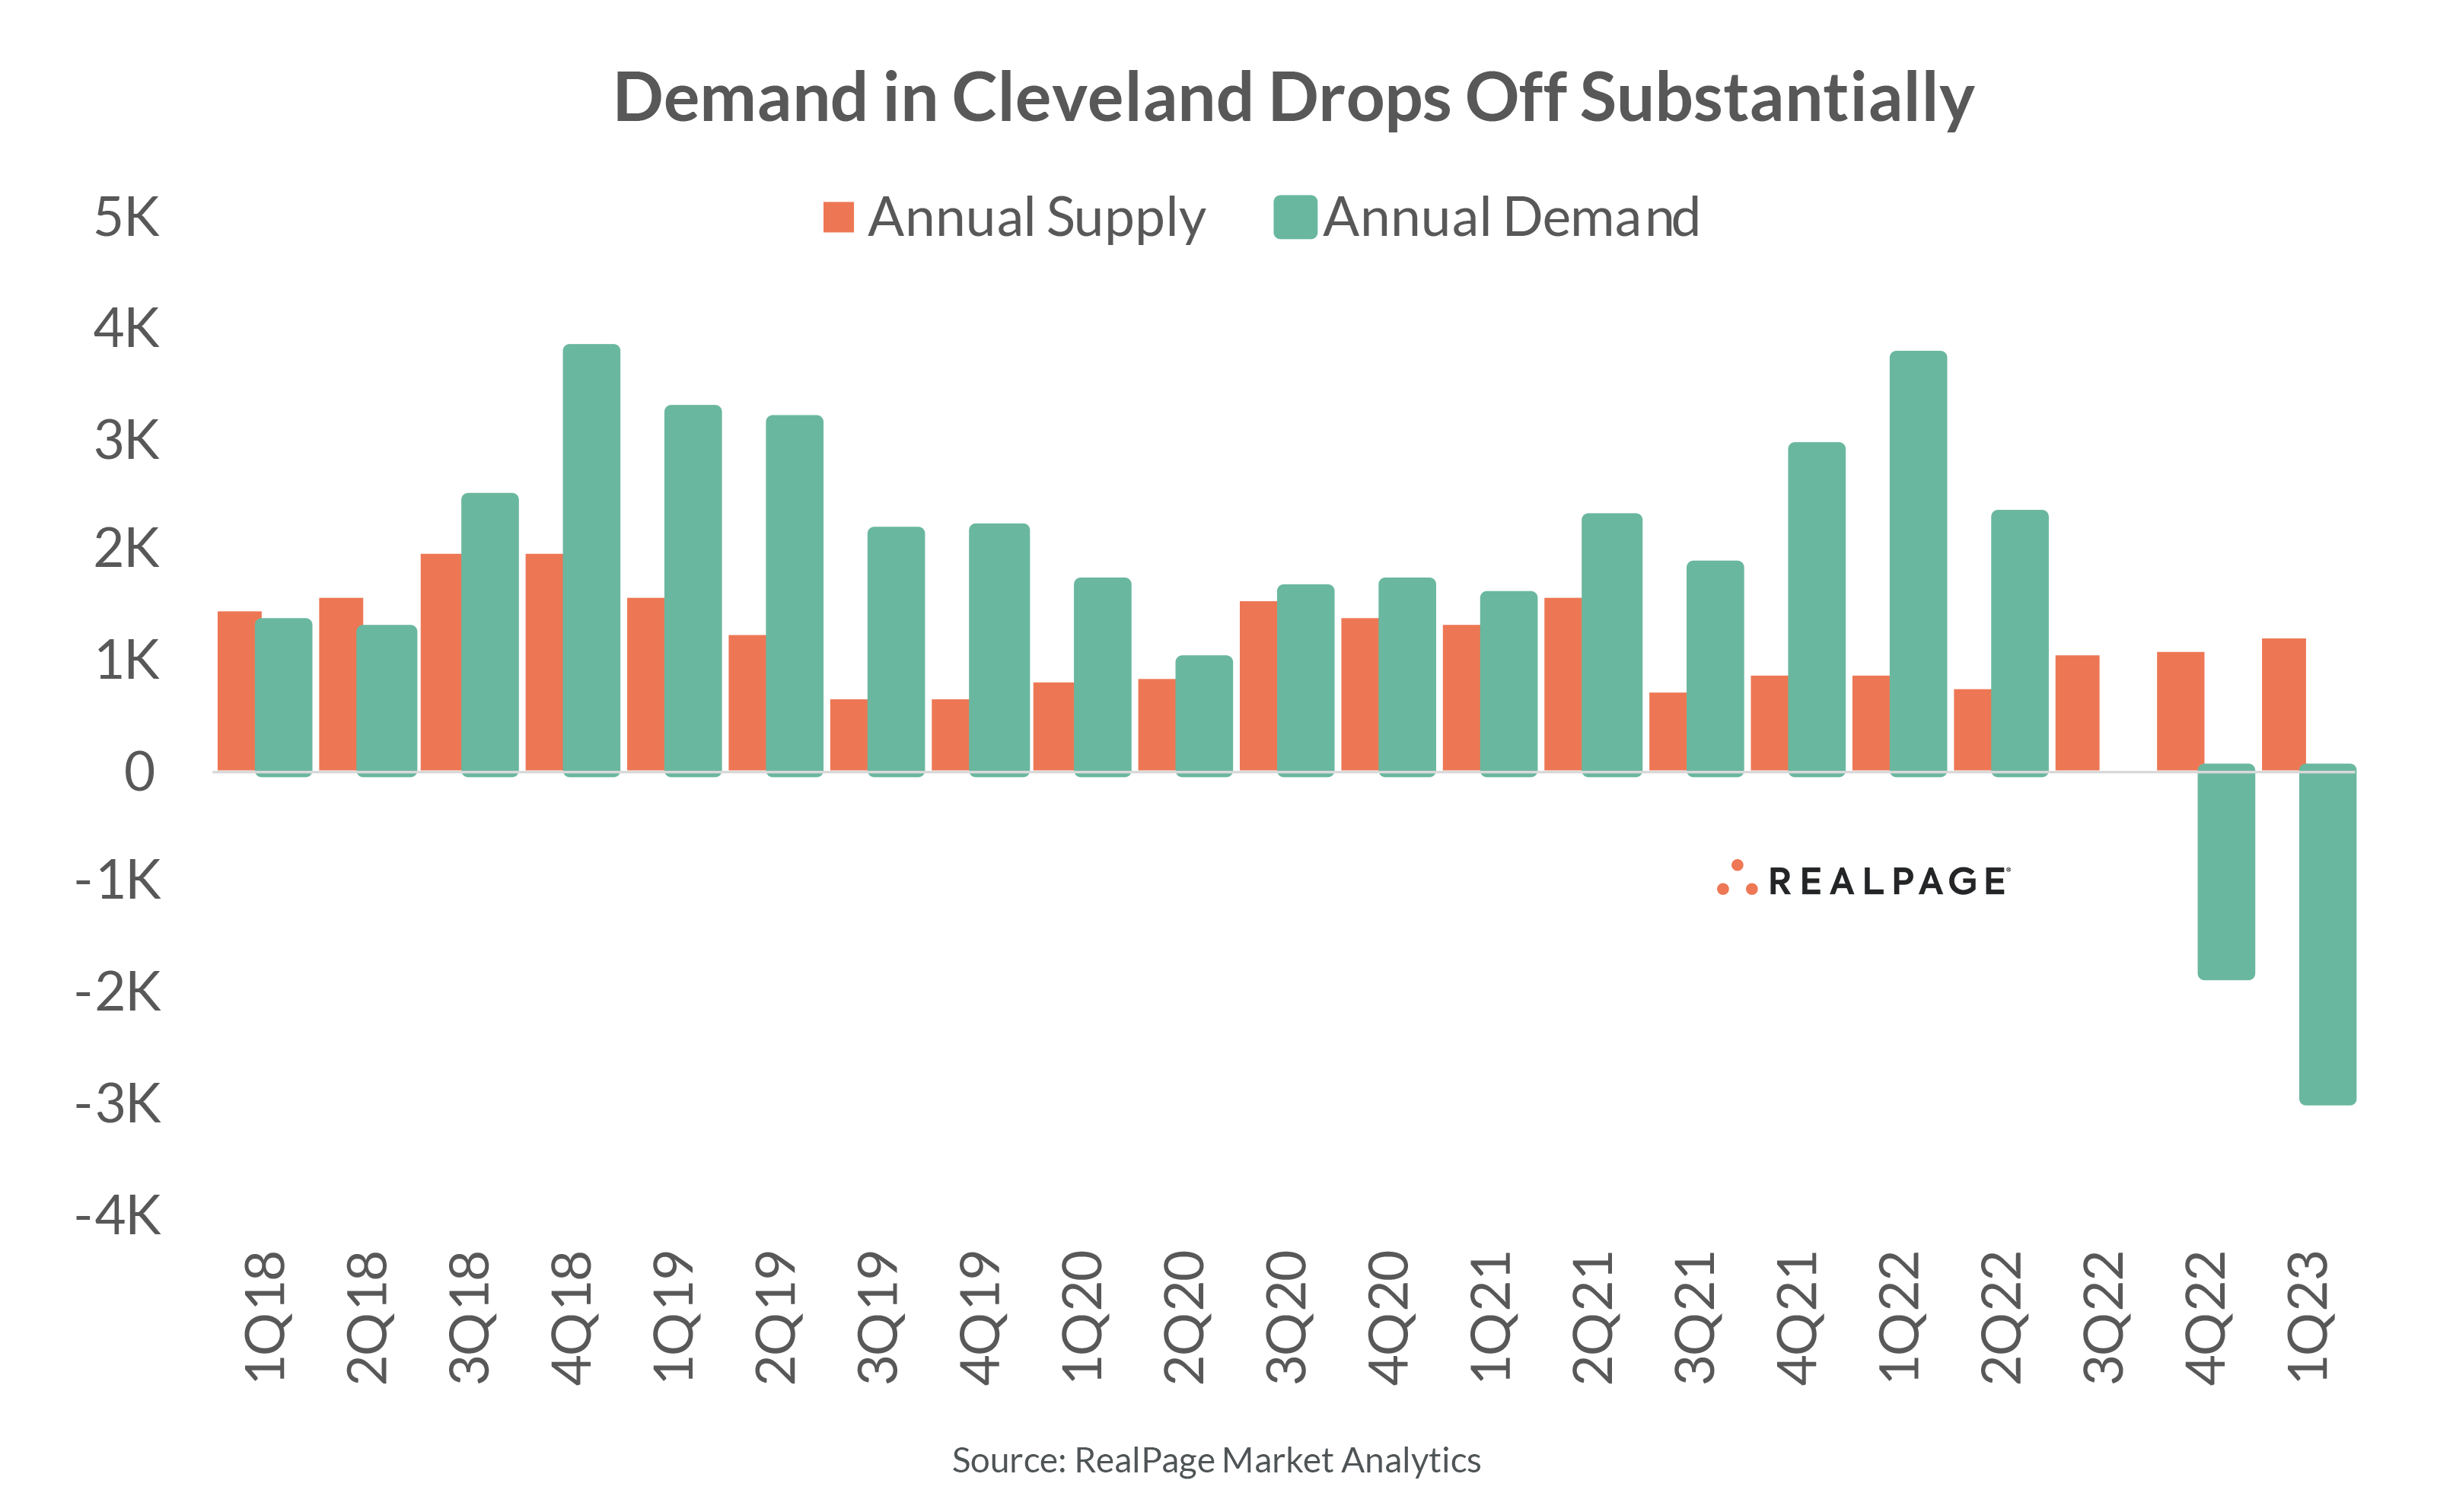
Helping support strong occupancy and rent growth, new apartment supply in Cleveland has been limited recently. That is nothing new for Cleveland, as completions have been historically modest, with inventory generally growing under 1% annually since RealPage began tracking the market in 2003. Over the past year, 1,207 units completed in Cleveland, growing existing inventory 0.7%. All those units came online in the urban core, with 62% in Central Cleveland and 38% in East Cleveland.
At the end of 1st quarter 2023, Cleveland has 2,709 units under construction, representing 1.6% of the market’s existing stock. That is the smallest proportion of units under construction among the nation’s 50 largest markets. Cleveland’s expected new supply over the next year will remain low, growing around 1%. However, 80% of the 1,614 units scheduled for delivery in the coming year are set to come online in Cleveland’s urban core. East Cleveland has 766 units slated for delivery, while Central Cleveland has 526 units completing in the year-ending 1st quarter 2024. The remaining units are coming online in Strongsville/North Royalton/Medina (233 units) and Beachwood/Mayfield (90 units).
Over the past five years, demand in Cleveland generally exceeded limited new supply by an average of 44%. However, over the past four quarters, Cleveland has recorded declines in its occupied unit count. Most recently, in 1st quarter 2023, Cleveland recorded net move-outs from 591 units, taking the market’s occupied unit count down by nearly 3,000 units on an annual basis.
Perhaps one of the reasons developers have not been drawn to Cleveland is there’s not an apparent need for more product here. Cleveland has fairly weak demand drivers, as the market is challenged with an aging population, net out-migration and relatively low household incomes. Also, single-family homes are relatively affordable, creating competition for apartment demand.
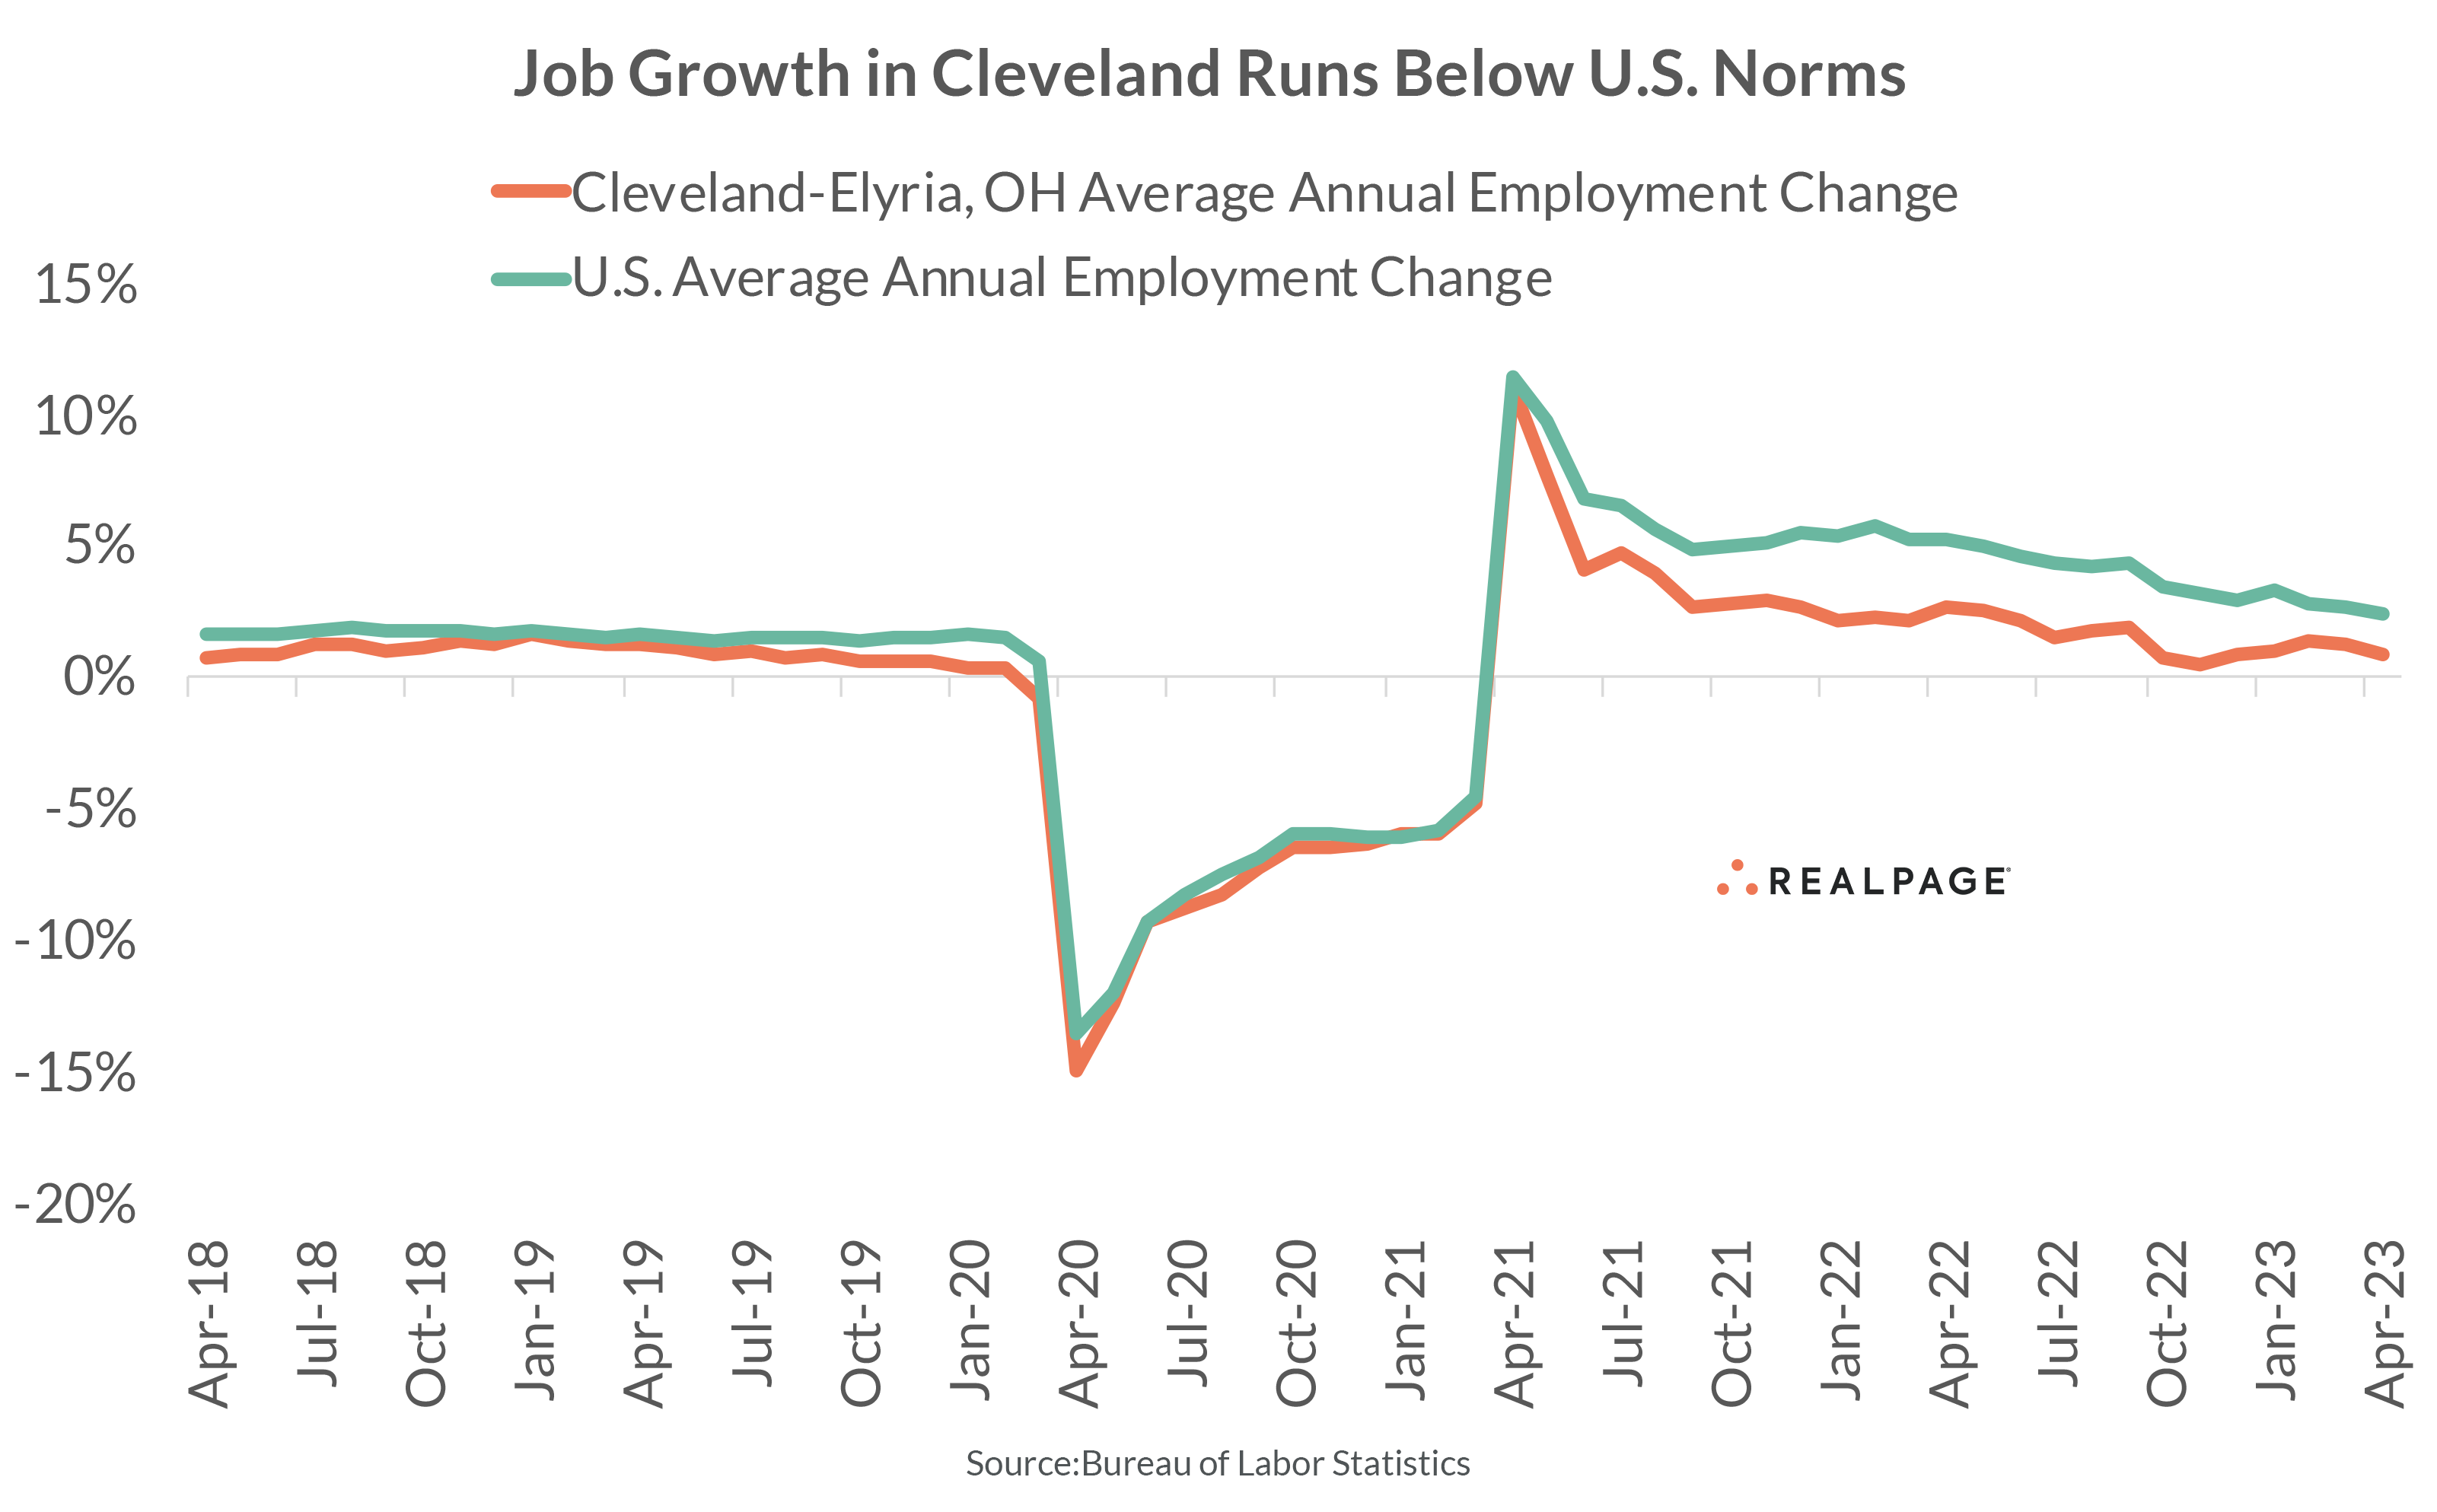
According to the latest estimates from the U.S. Census Bureau, Cleveland’s population contracted 0.5% from 2021 to 2022, a weaker result than the U.S. overall, which saw an average gain of 0.4%. That decline took Cleveland’s population count to just over 2 million in 2022. In addition, based on data from the Bureau of Labor Statistics, Cleveland’s job base expanded just 0.9% in the year-ending April 2023, a pace well below the national norm of 2.4%. In fact, Cleveland has added jobs at a slower pace than the nation overall for more than two years. But job growth is historically weak in Cleveland. During the five years leading up to the pandemic (2015-2019), job growth averaged 0.8% and never exceeded the 2% mark.
Cleveland’s economy is heavily centered around Education and Health Services, with nearly 20% of its workforce employed in that sector. That’s well above the national average of around 16%. The top two employers in Cleveland are the Cleveland Clinic (32,772 employees) and University Hospitals (16,506 employees). The percentage of Manufacturing jobs in Cleveland also runs higher than the national norm, 11% compared to 7%, respectively.
Roughly 33% of Cleveland’s population is 55 year or older. That’s above the national average of 29%. Among the nation’s 50 largest markets, only West Palm Beach, Pittsburgh and Tampa have a larger population base of older adults. As such, the median age in Cleveland during 2021 was 41.3, compared to the U.S. norm of 38.4. In 2021, about 32.8% of the working-age population in Cleveland held a bachelor’s degree or higher, compared to 33.7% nationally. In turn, Cleveland's median household income of about $61,500 was less than the national average of roughly $69,000.
Cleveland weathered the negative effects of the pandemic better than many markets of its size. Still, four consecutive quarters of net move-outs quickly normalized the market from a moderately strong post-pandemic resurgence. In addition to recent demand woes, Cleveland’s apartment market faces numerous structural challenges. However, limited new apartment supply will likely keep the market as a middle-of-the-road performer in the near term.


