Apartment Demand Reaches Recent High, But Still Below Long-Term Norm
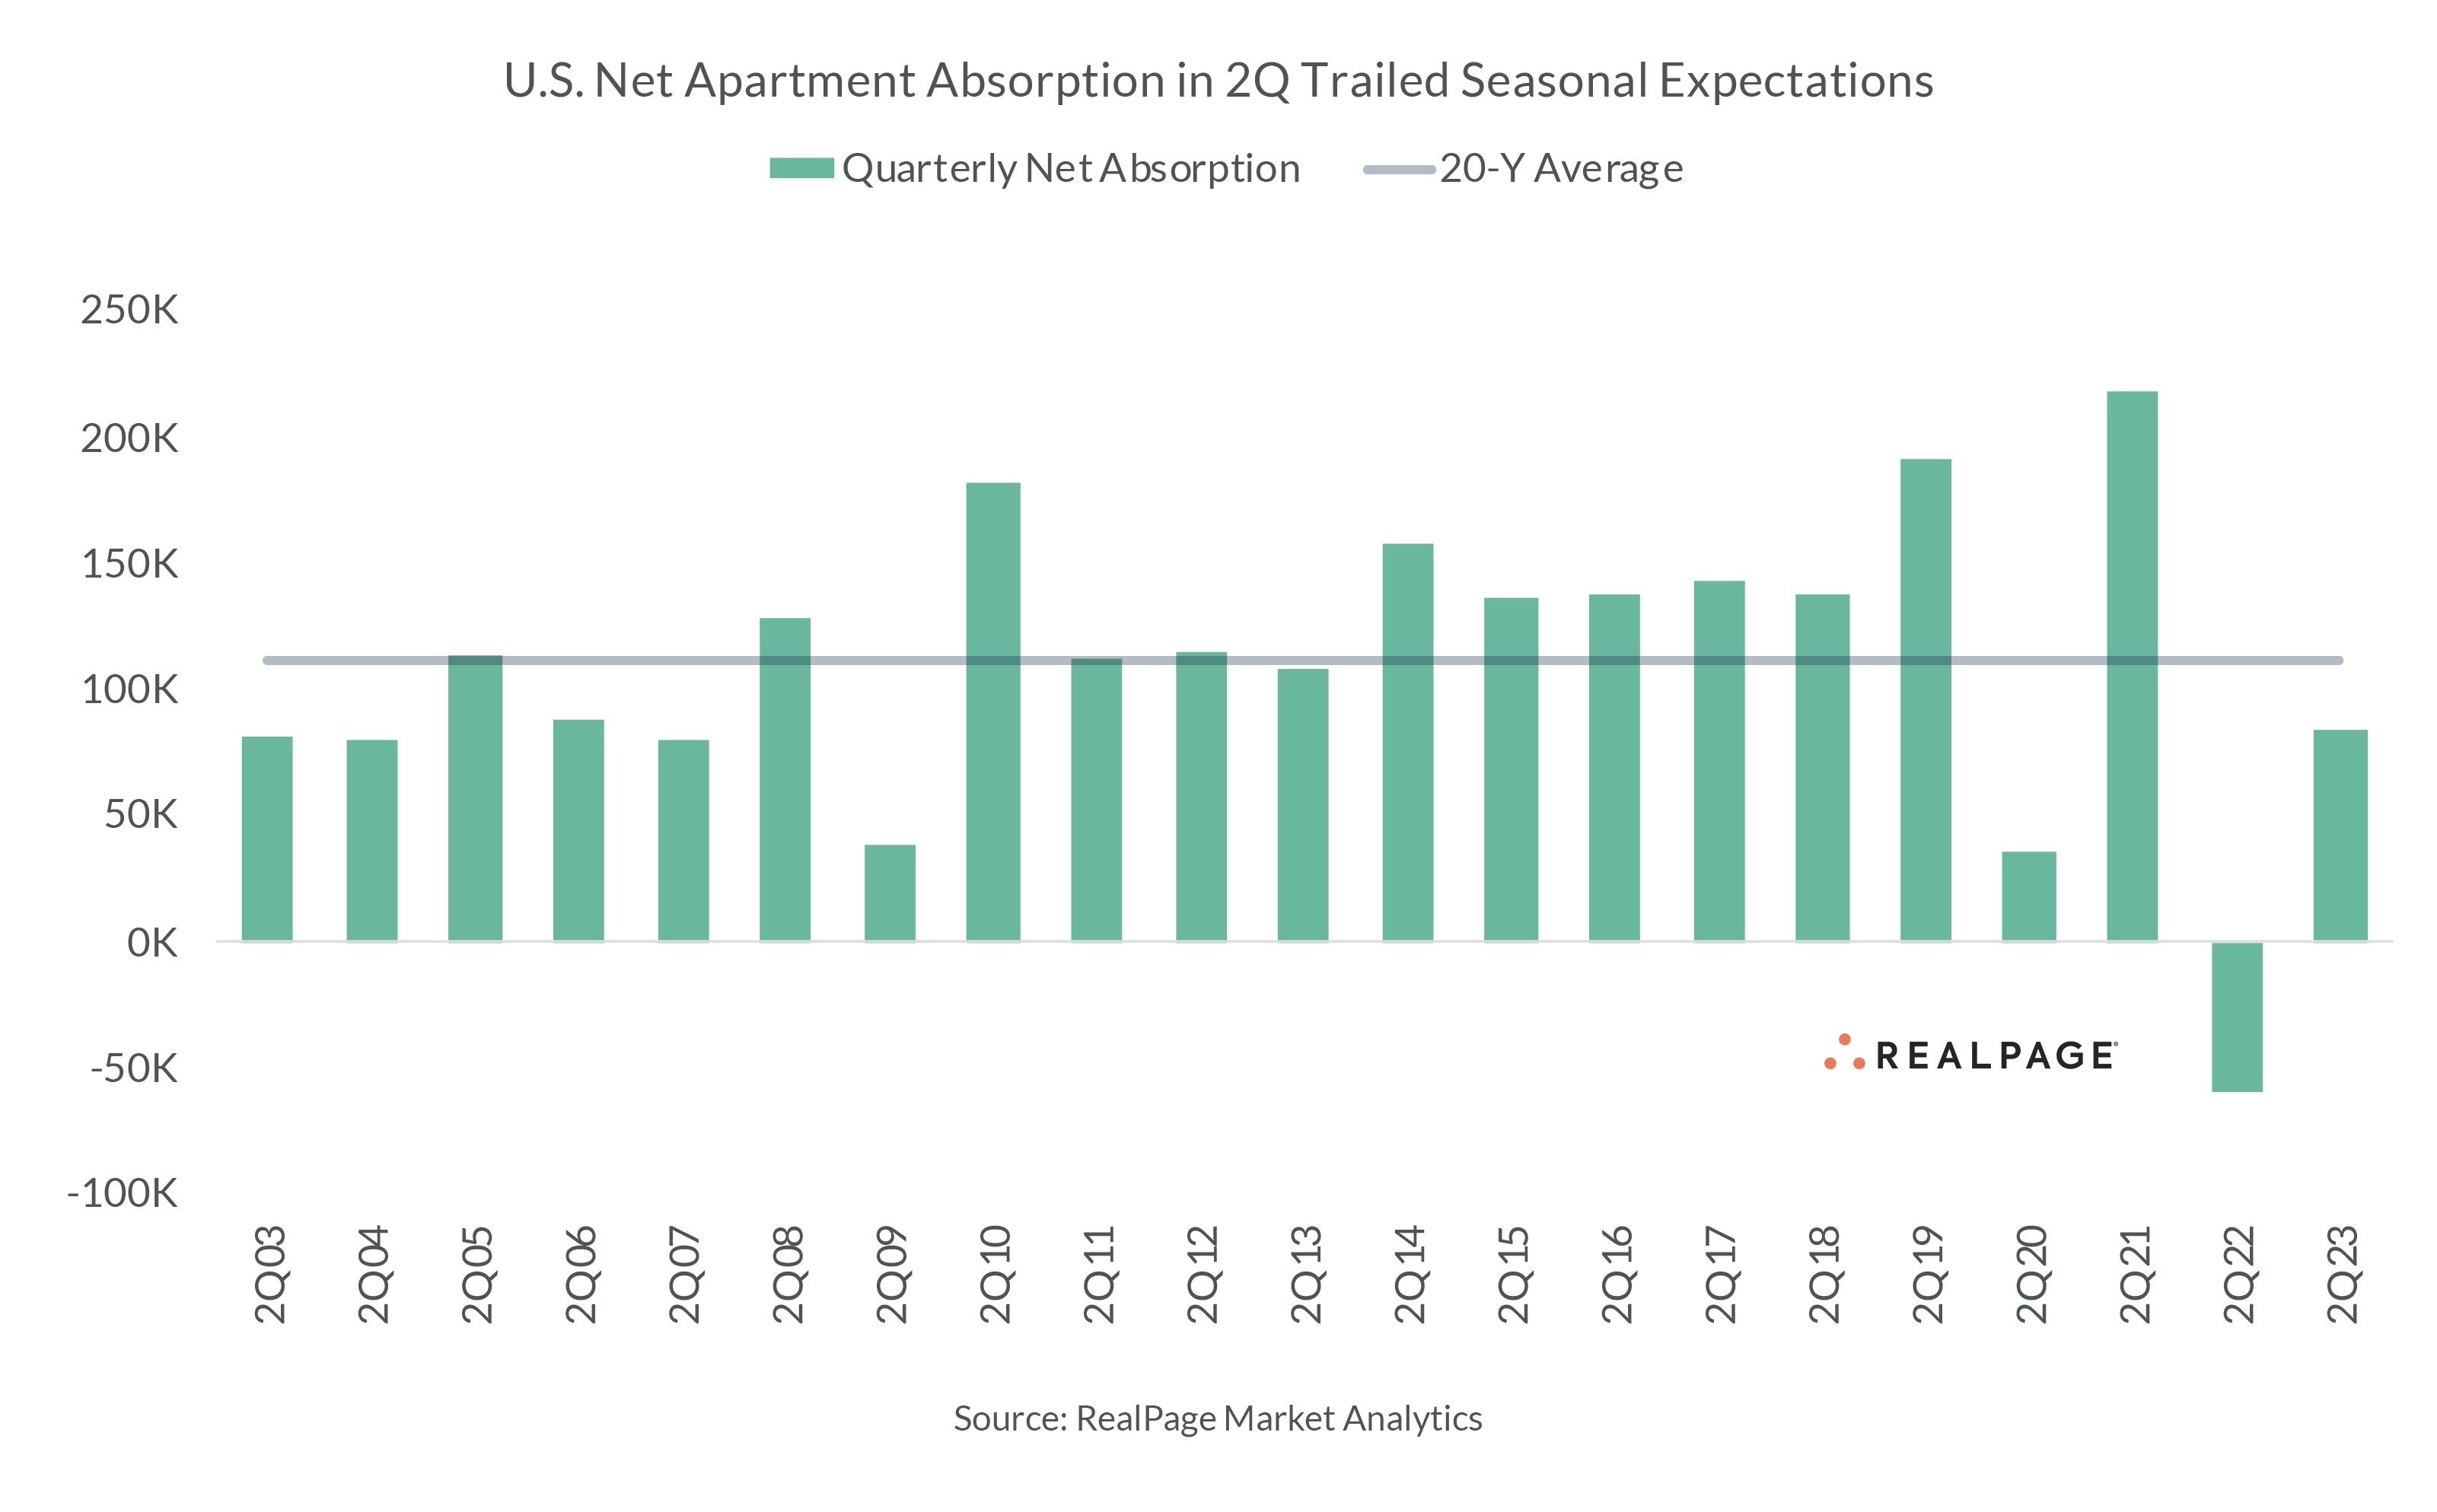
Apartment market performance in 2nd quarter 2023 yields mixed results. On one hand, the U.S. recorded positive quarterly absorption for roughly 84,000 units, according to data from RealPage Market Analytics. This was the largest quarterly absorption figure since 1st quarter 2022 when the nation saw unseasonably strong absorption, totaling some 84,000 units. On the other hand, 2nd quarter 2023 absorption clocks in at just 60% of the 2nd quarter average through the 2010s decade.
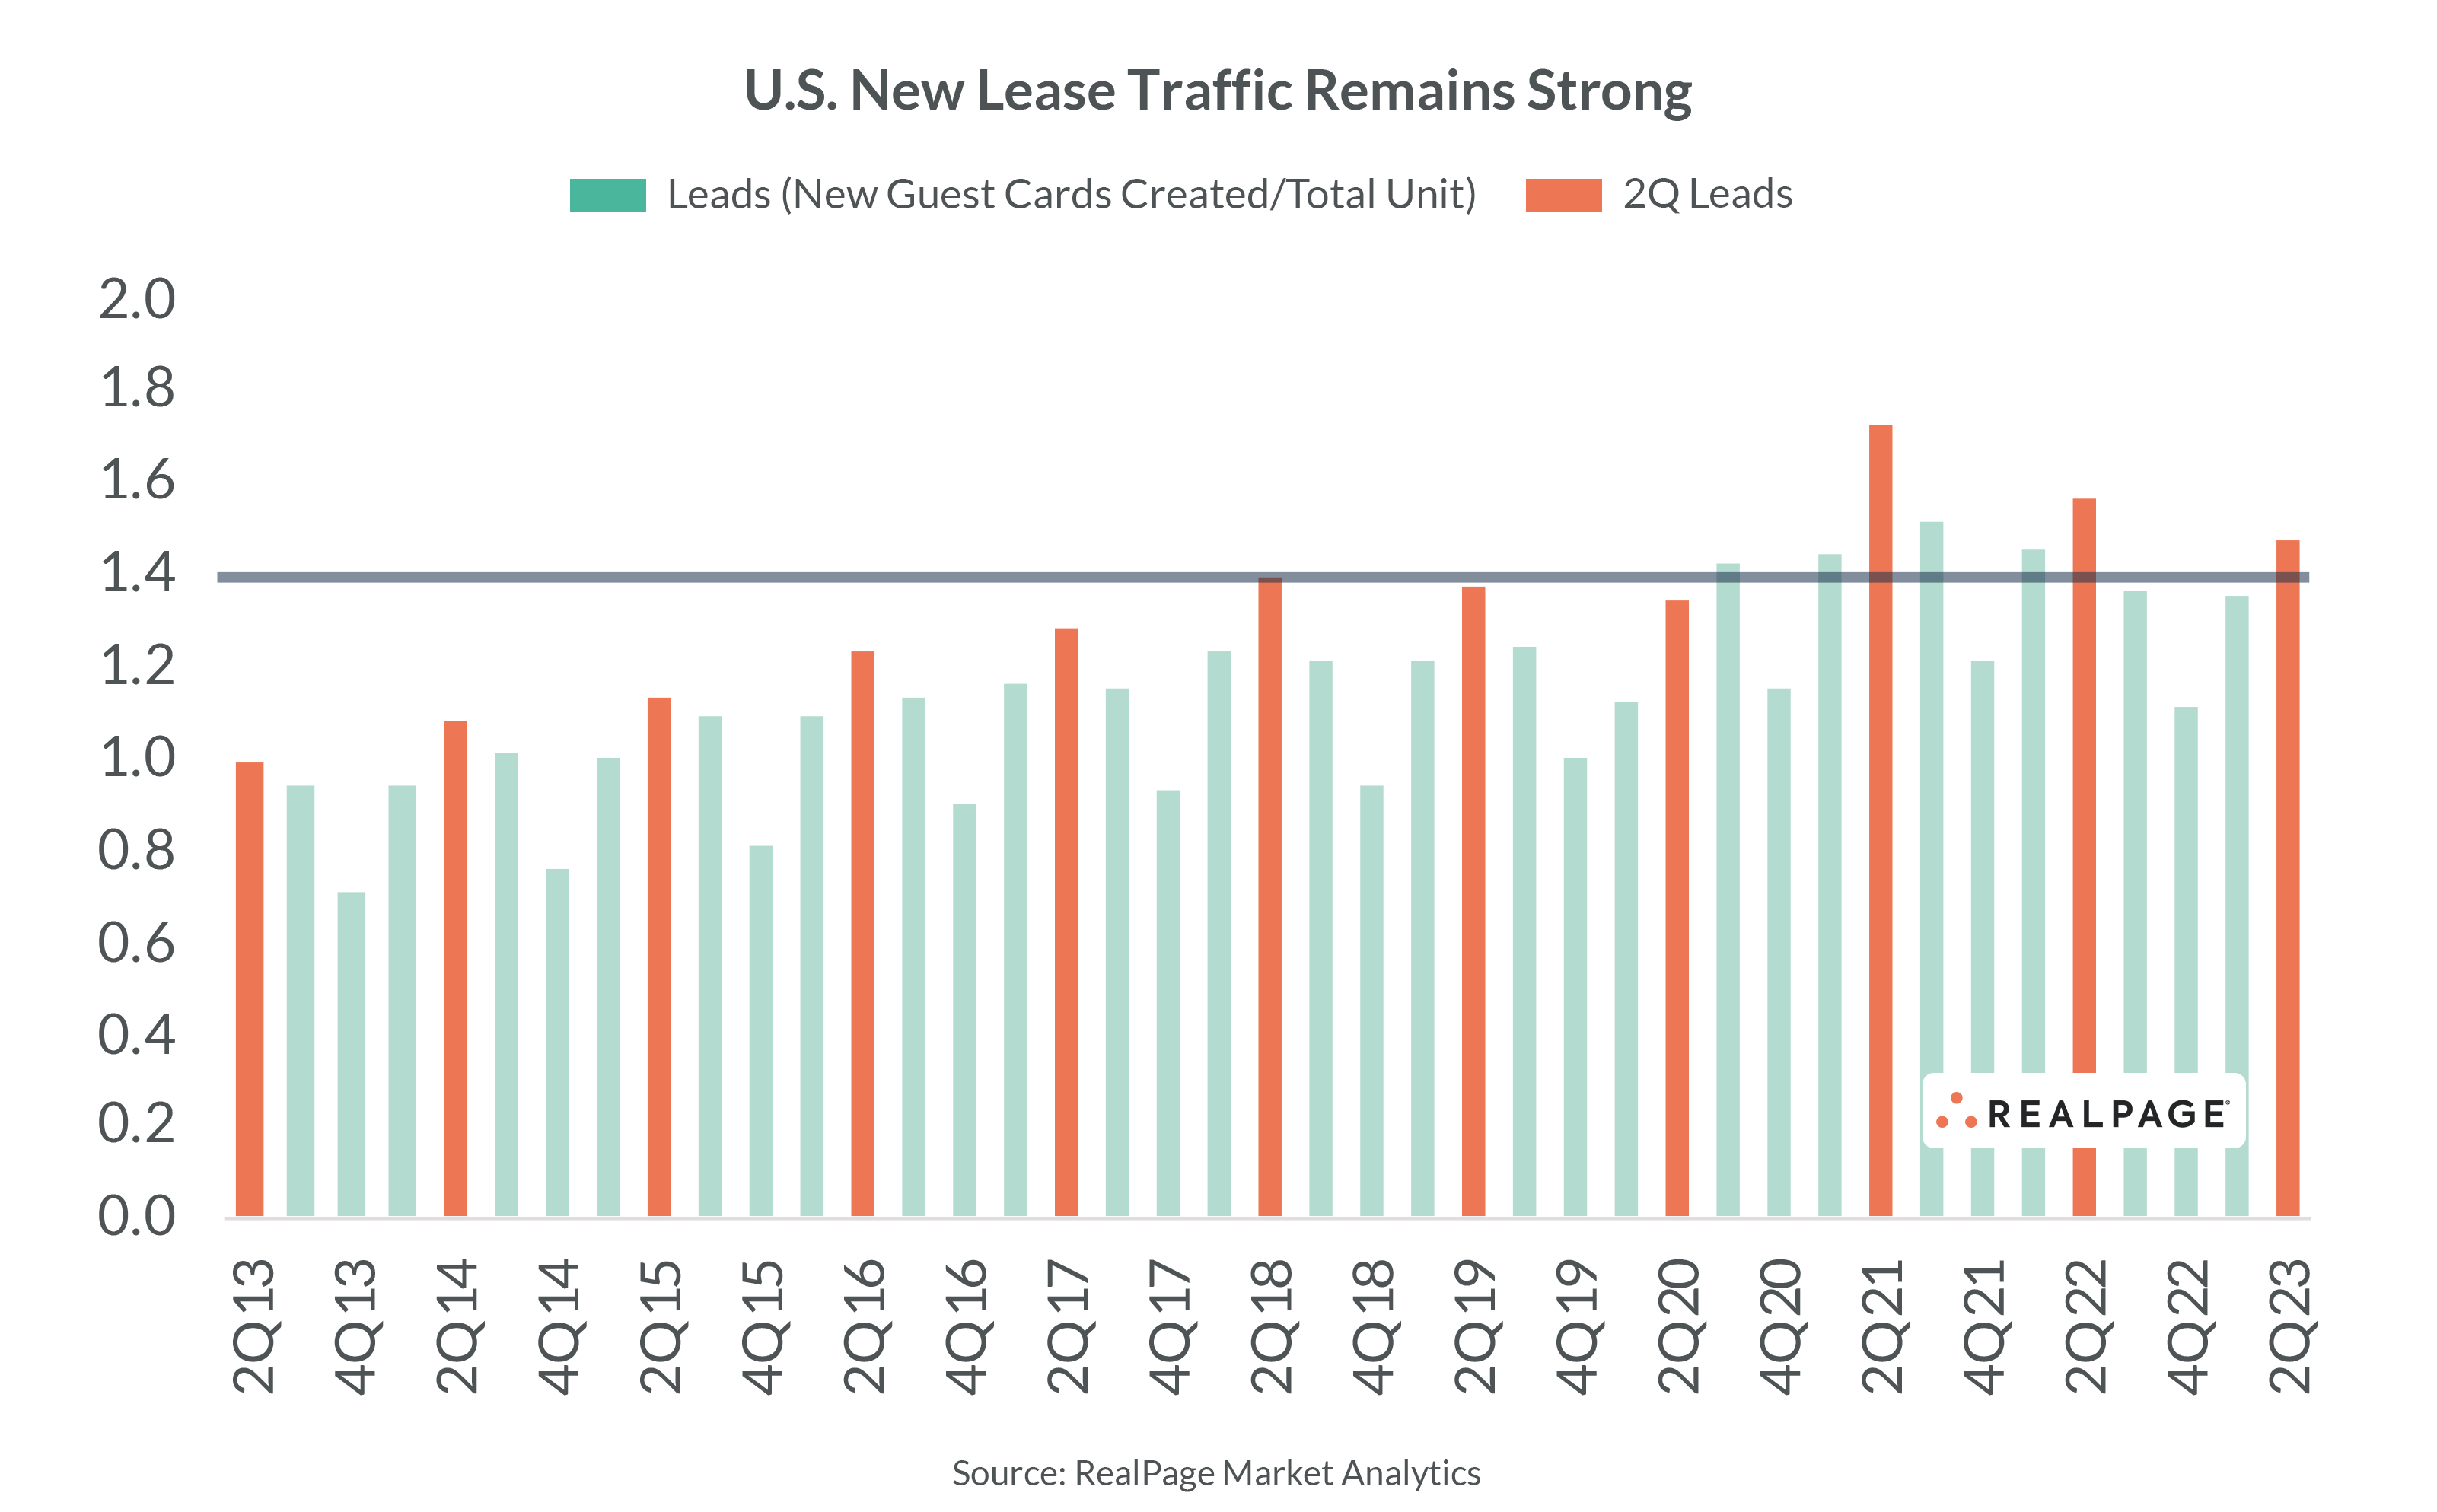
The improved – yet ultimately mild – absorption figure in 2nd quarter generally mirrors the current climate for apartment demand. Leasing traffic (or leads per total unit) shows that renters are indeed shopping for new leases at a seasonally normal rate. And top-line demand indicators such as job growth and income growth support healthy demand. Further, resident retention has rebalanced closer to expected norms even though retention rates have cooled from last year’s peak.
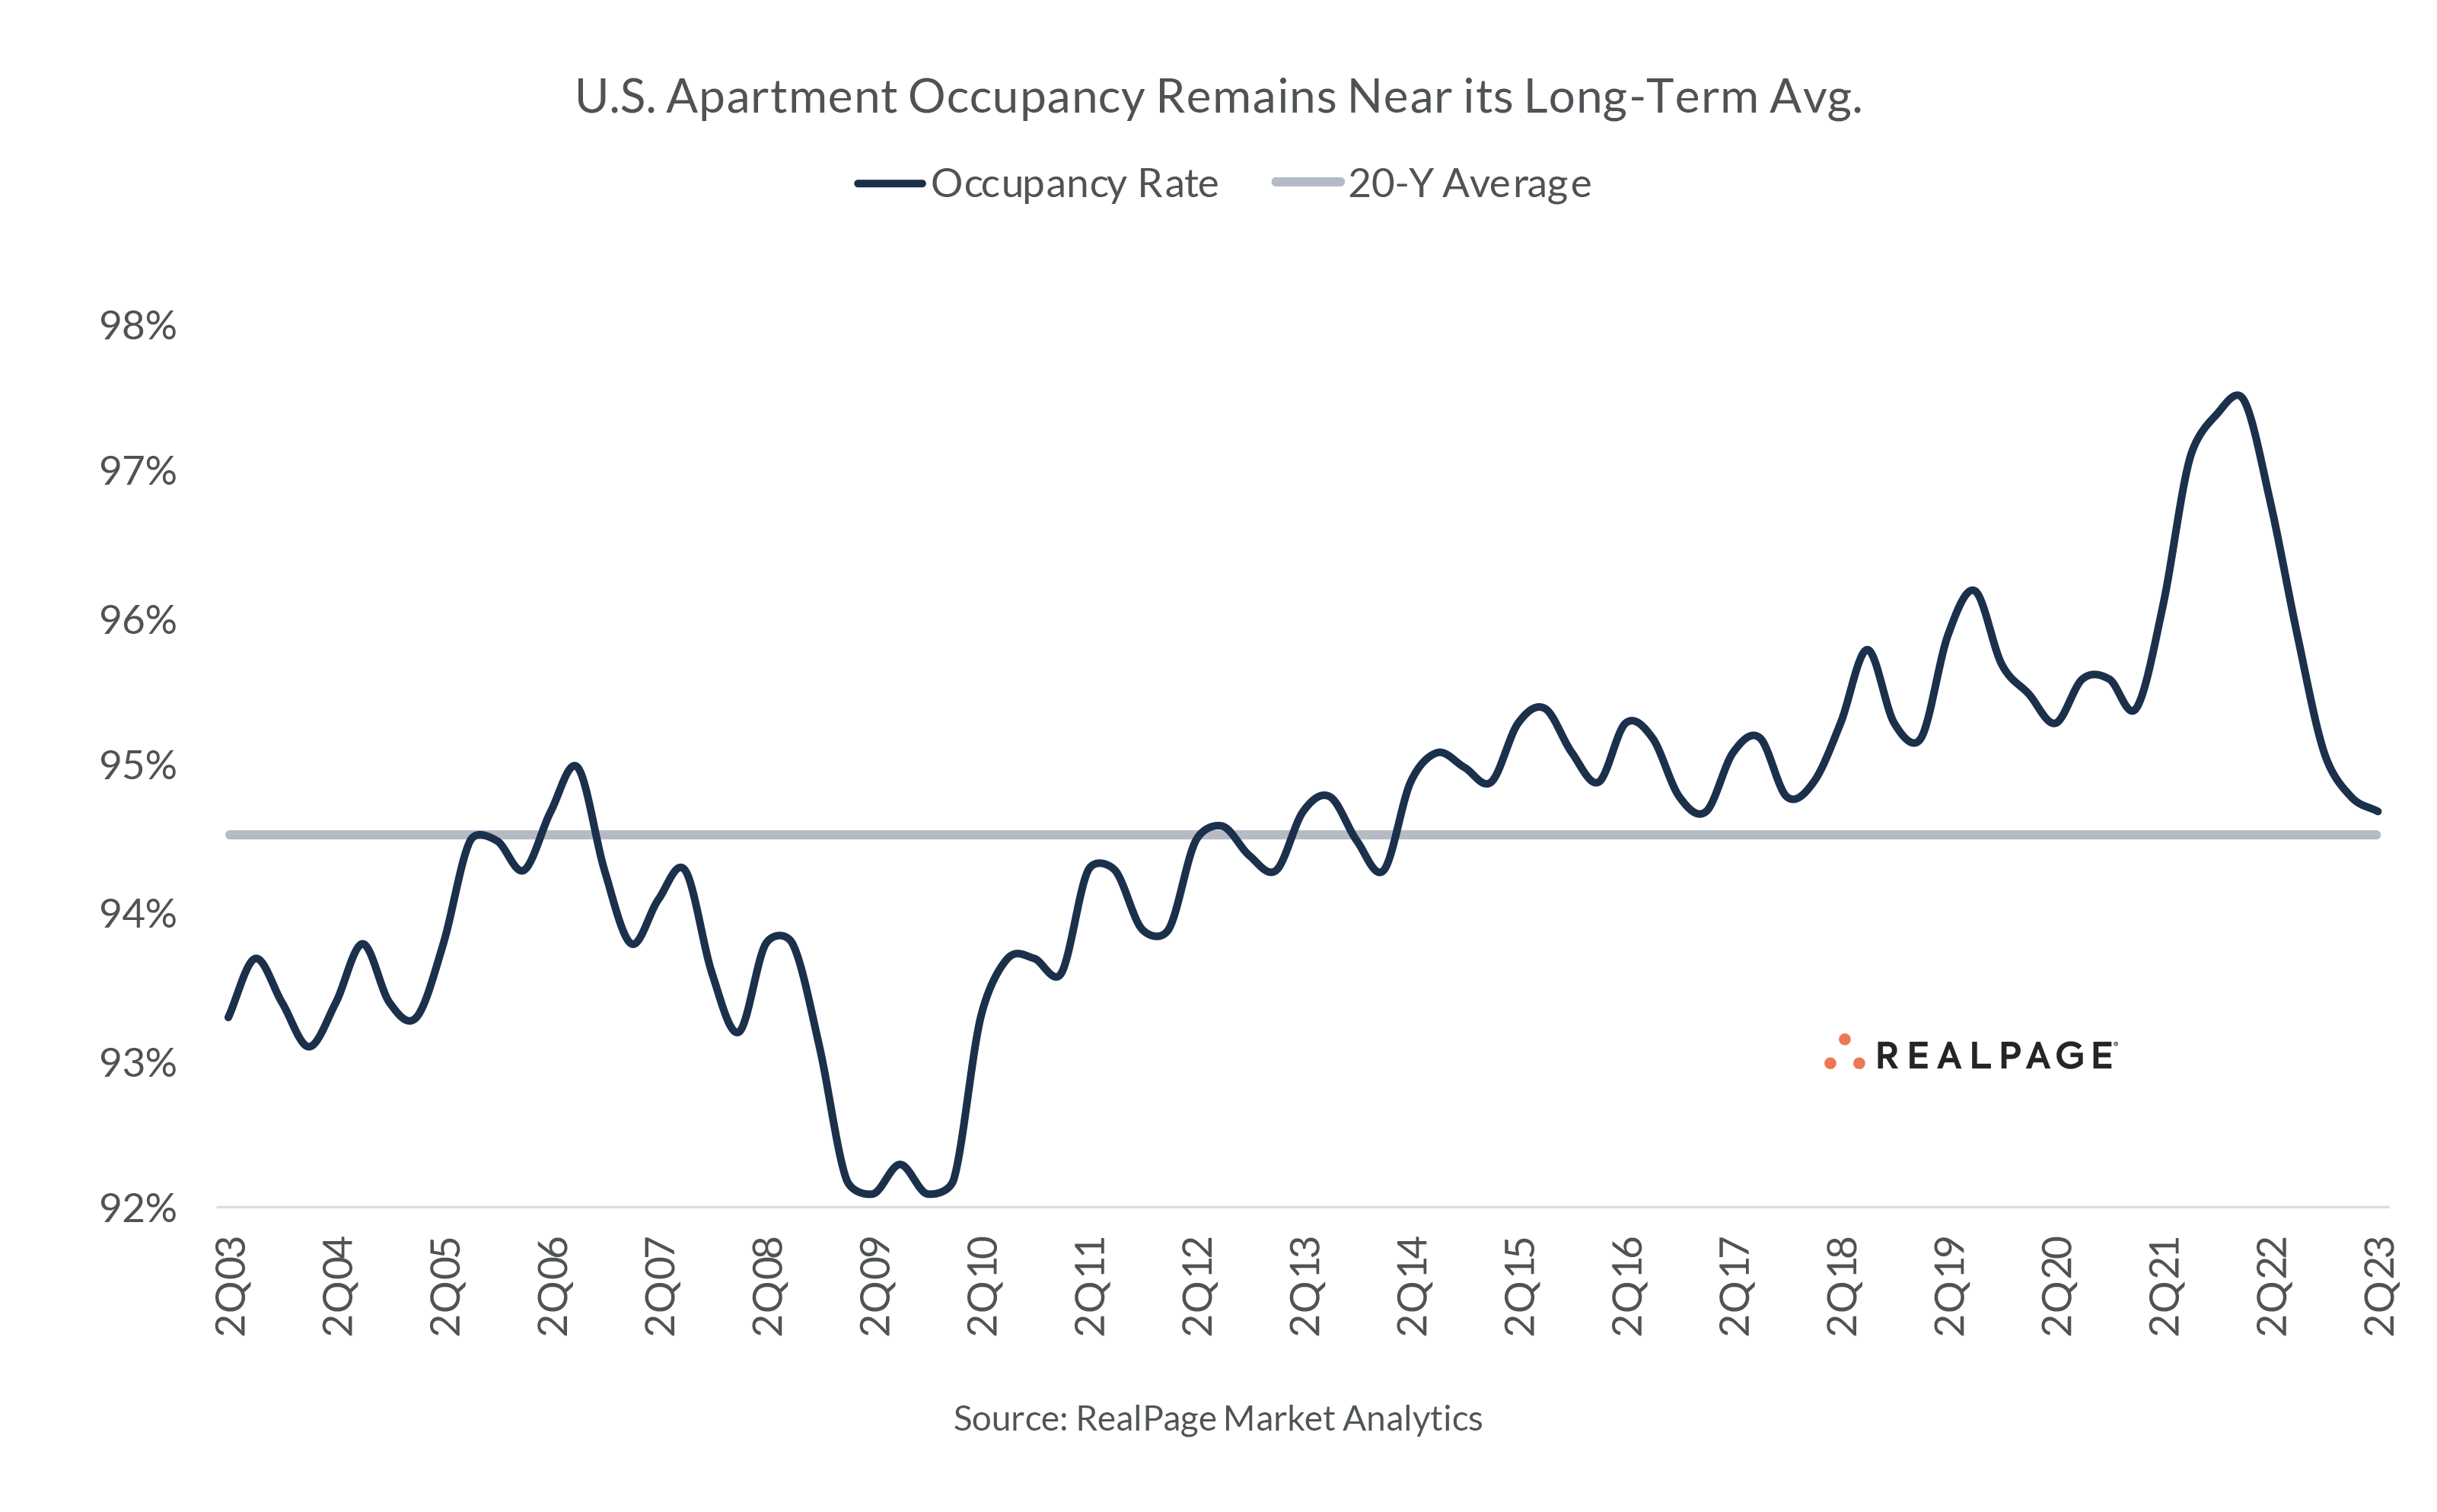
The result of normalizing retention and more regular lead volumes is an occupancy rate that more closely matches long-term averages. U.S. apartments were 94.7% occupied as of 2nd quarter 2023, just 10 basis points off the nation’s 20-year average. Still, a normal rate of residents shopping the market doesn’t necessarily mean a high lead-to-conversion rate.
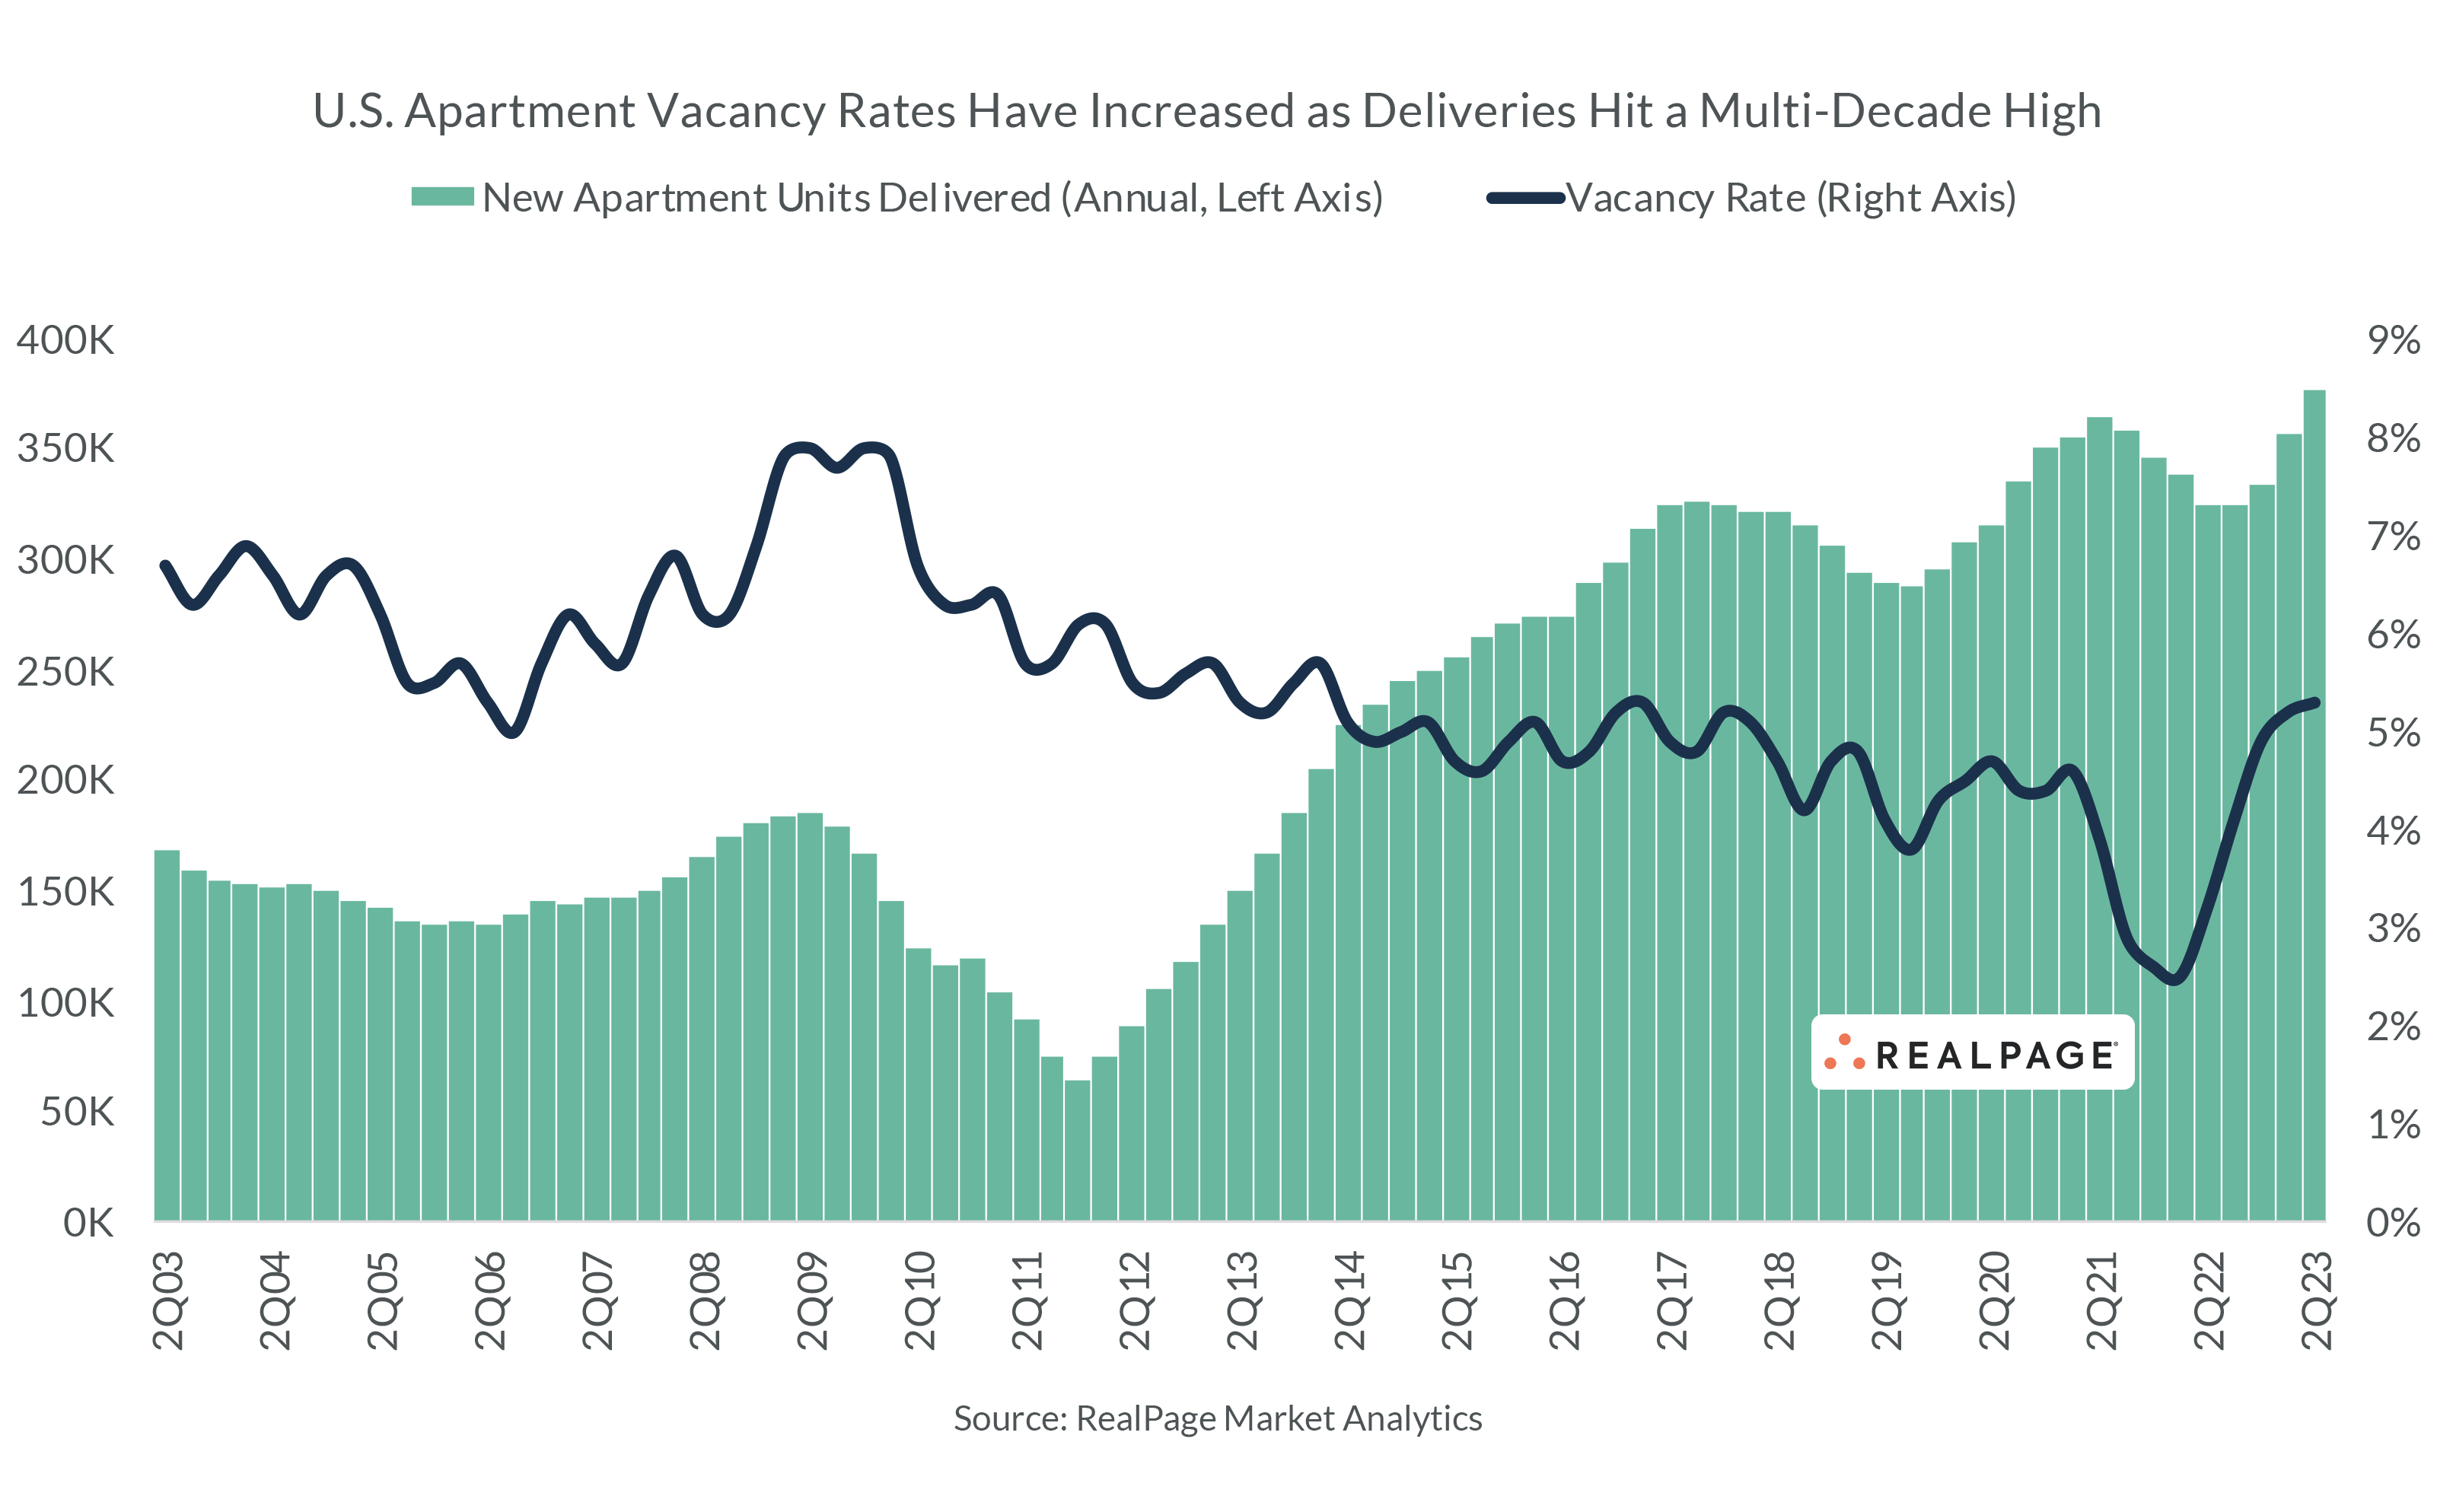
As vacancy rates have climbed 2.1% over the past 12 months, there are more available units from which renters can choose. Further explaining the increase in vacancy is a record amount of new construction. About 108,000 new units came online in the April to June time frame, pushing the trailing 12-month figure to some 368,000 new apartment units.
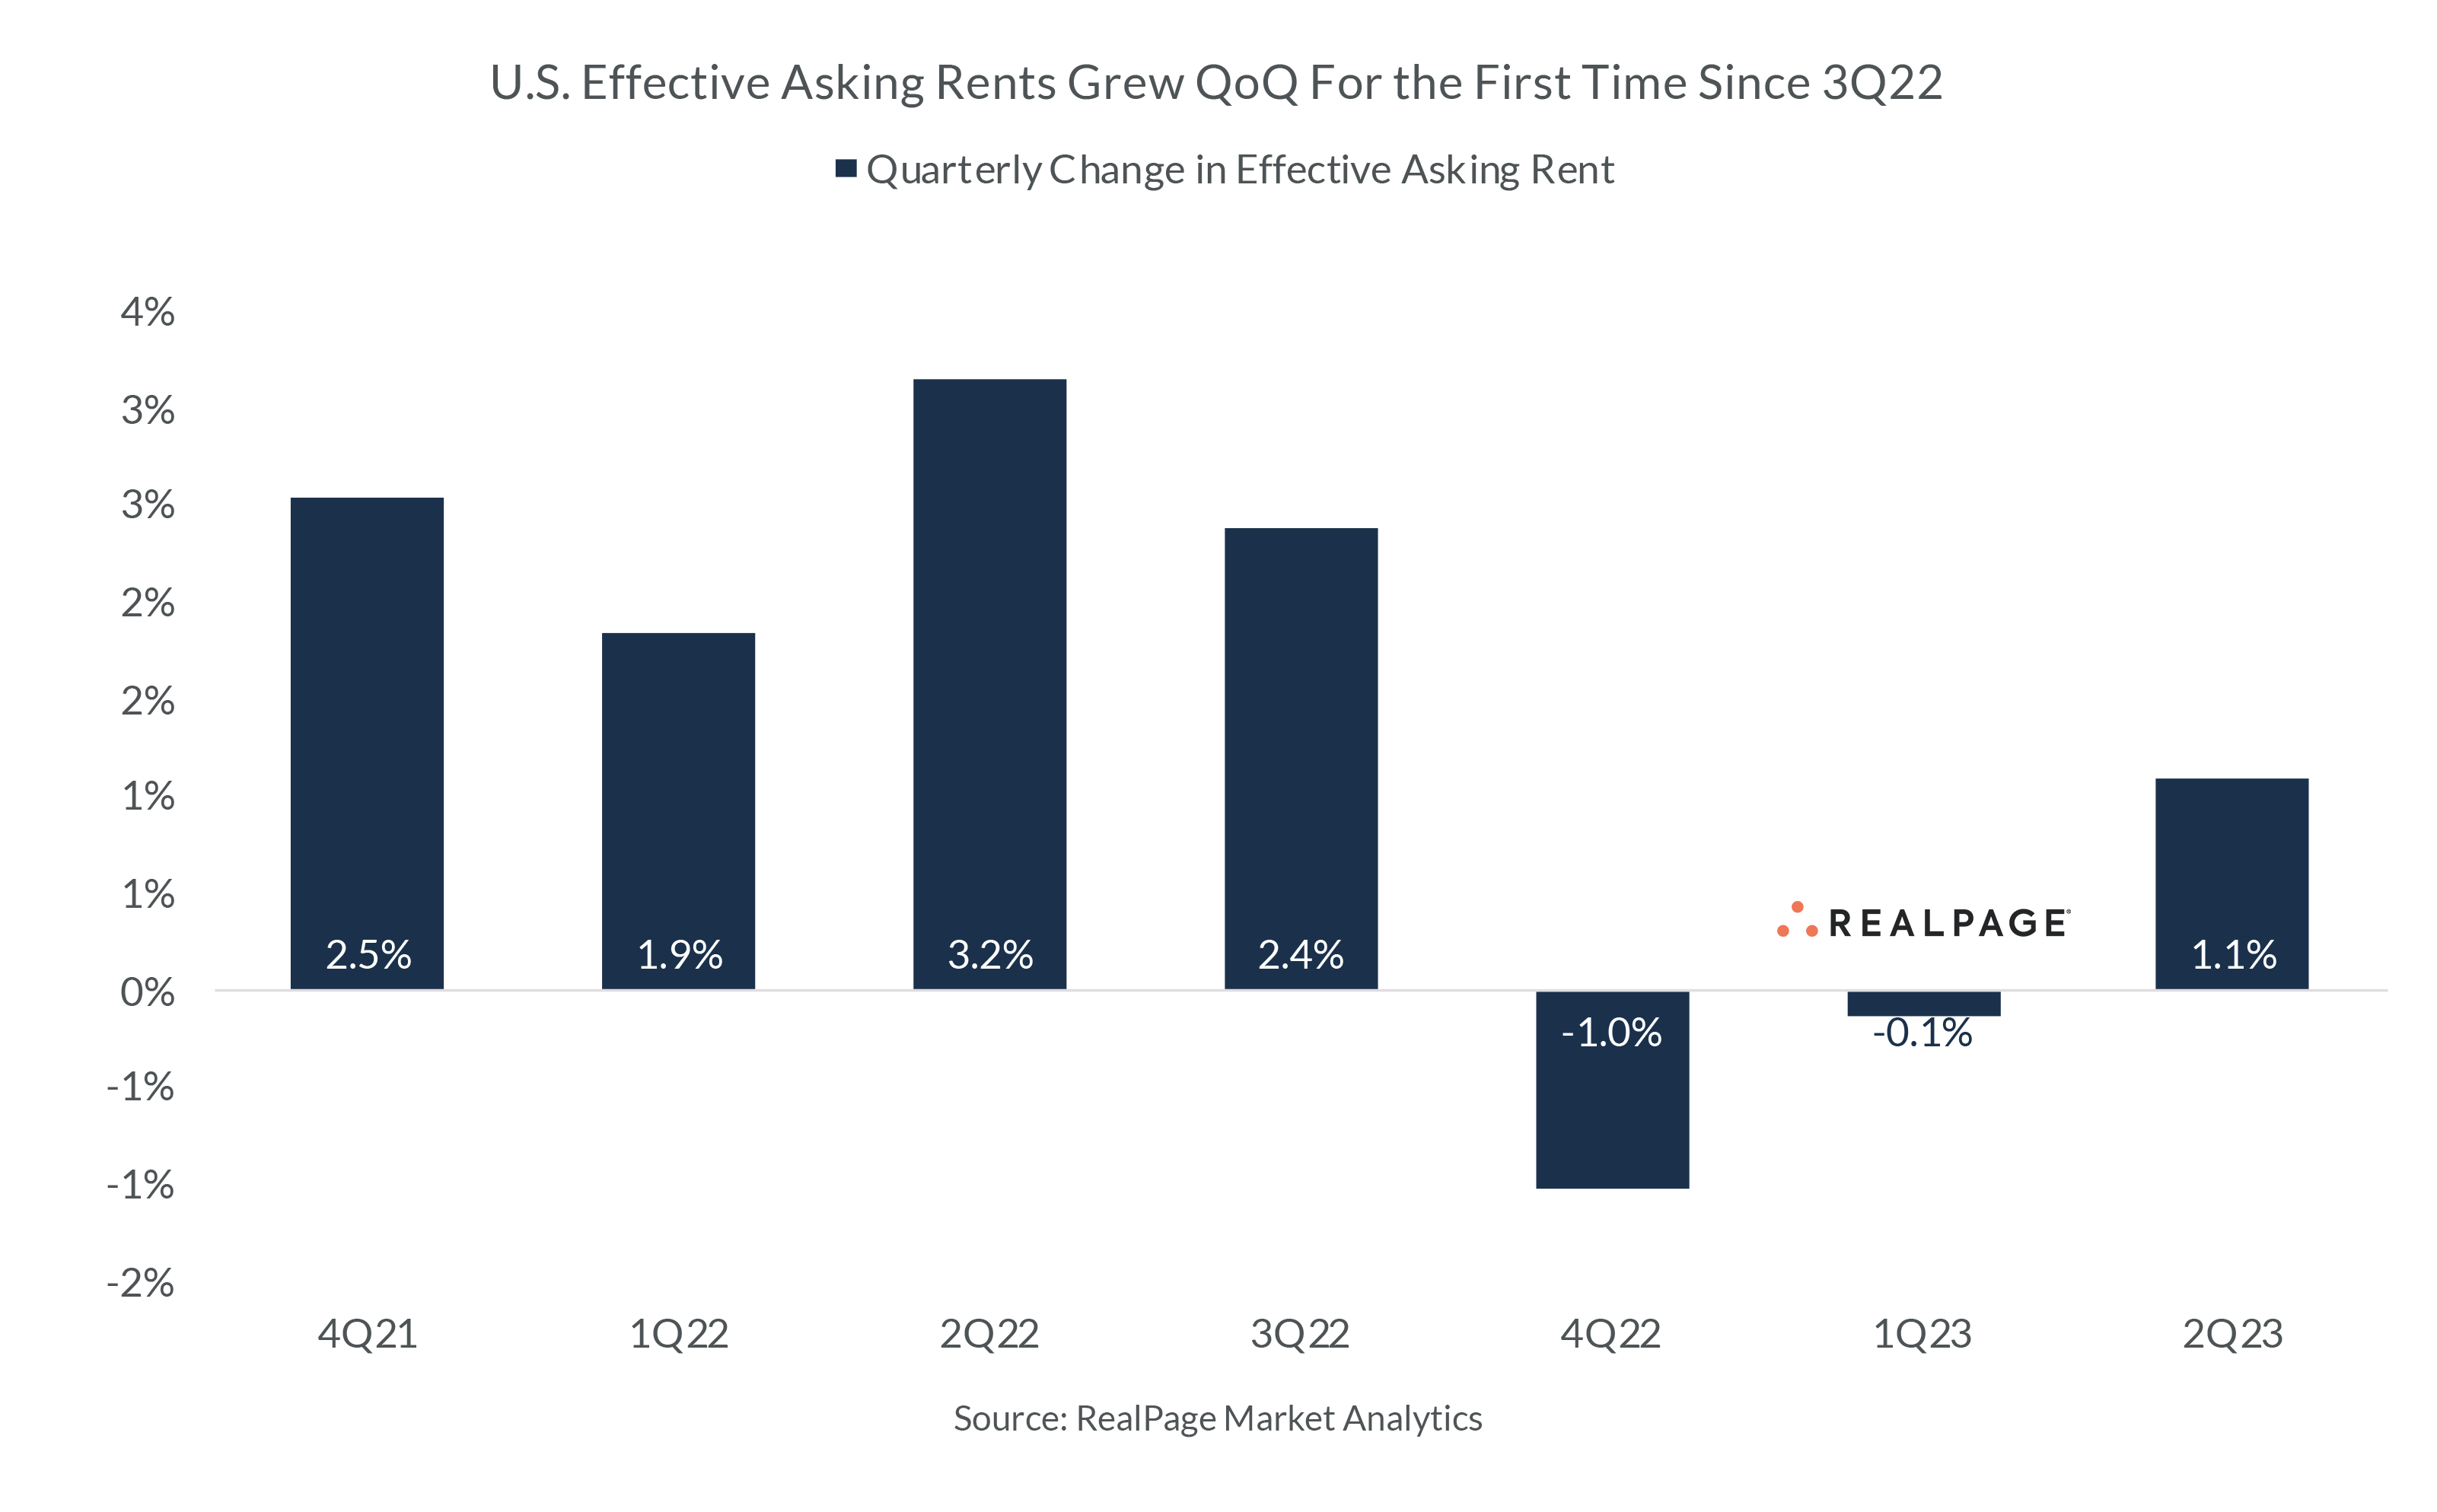
Despite historically normal new resident traffic, all that new supply is influencing performance readings. For instance, quarterly rent growth in 2nd quarter 2023 come in around 1.1% across the nation. The rent growth is a welcomed improvement from the prior two quarters when rents contracted roughly 1.2% on aggregate. Still, the 20-year average for 2nd quarter rent growth is 1.6%. So again, 2nd quarter 2023 looked stronger than the recent past, but weaker than the long-term norm.
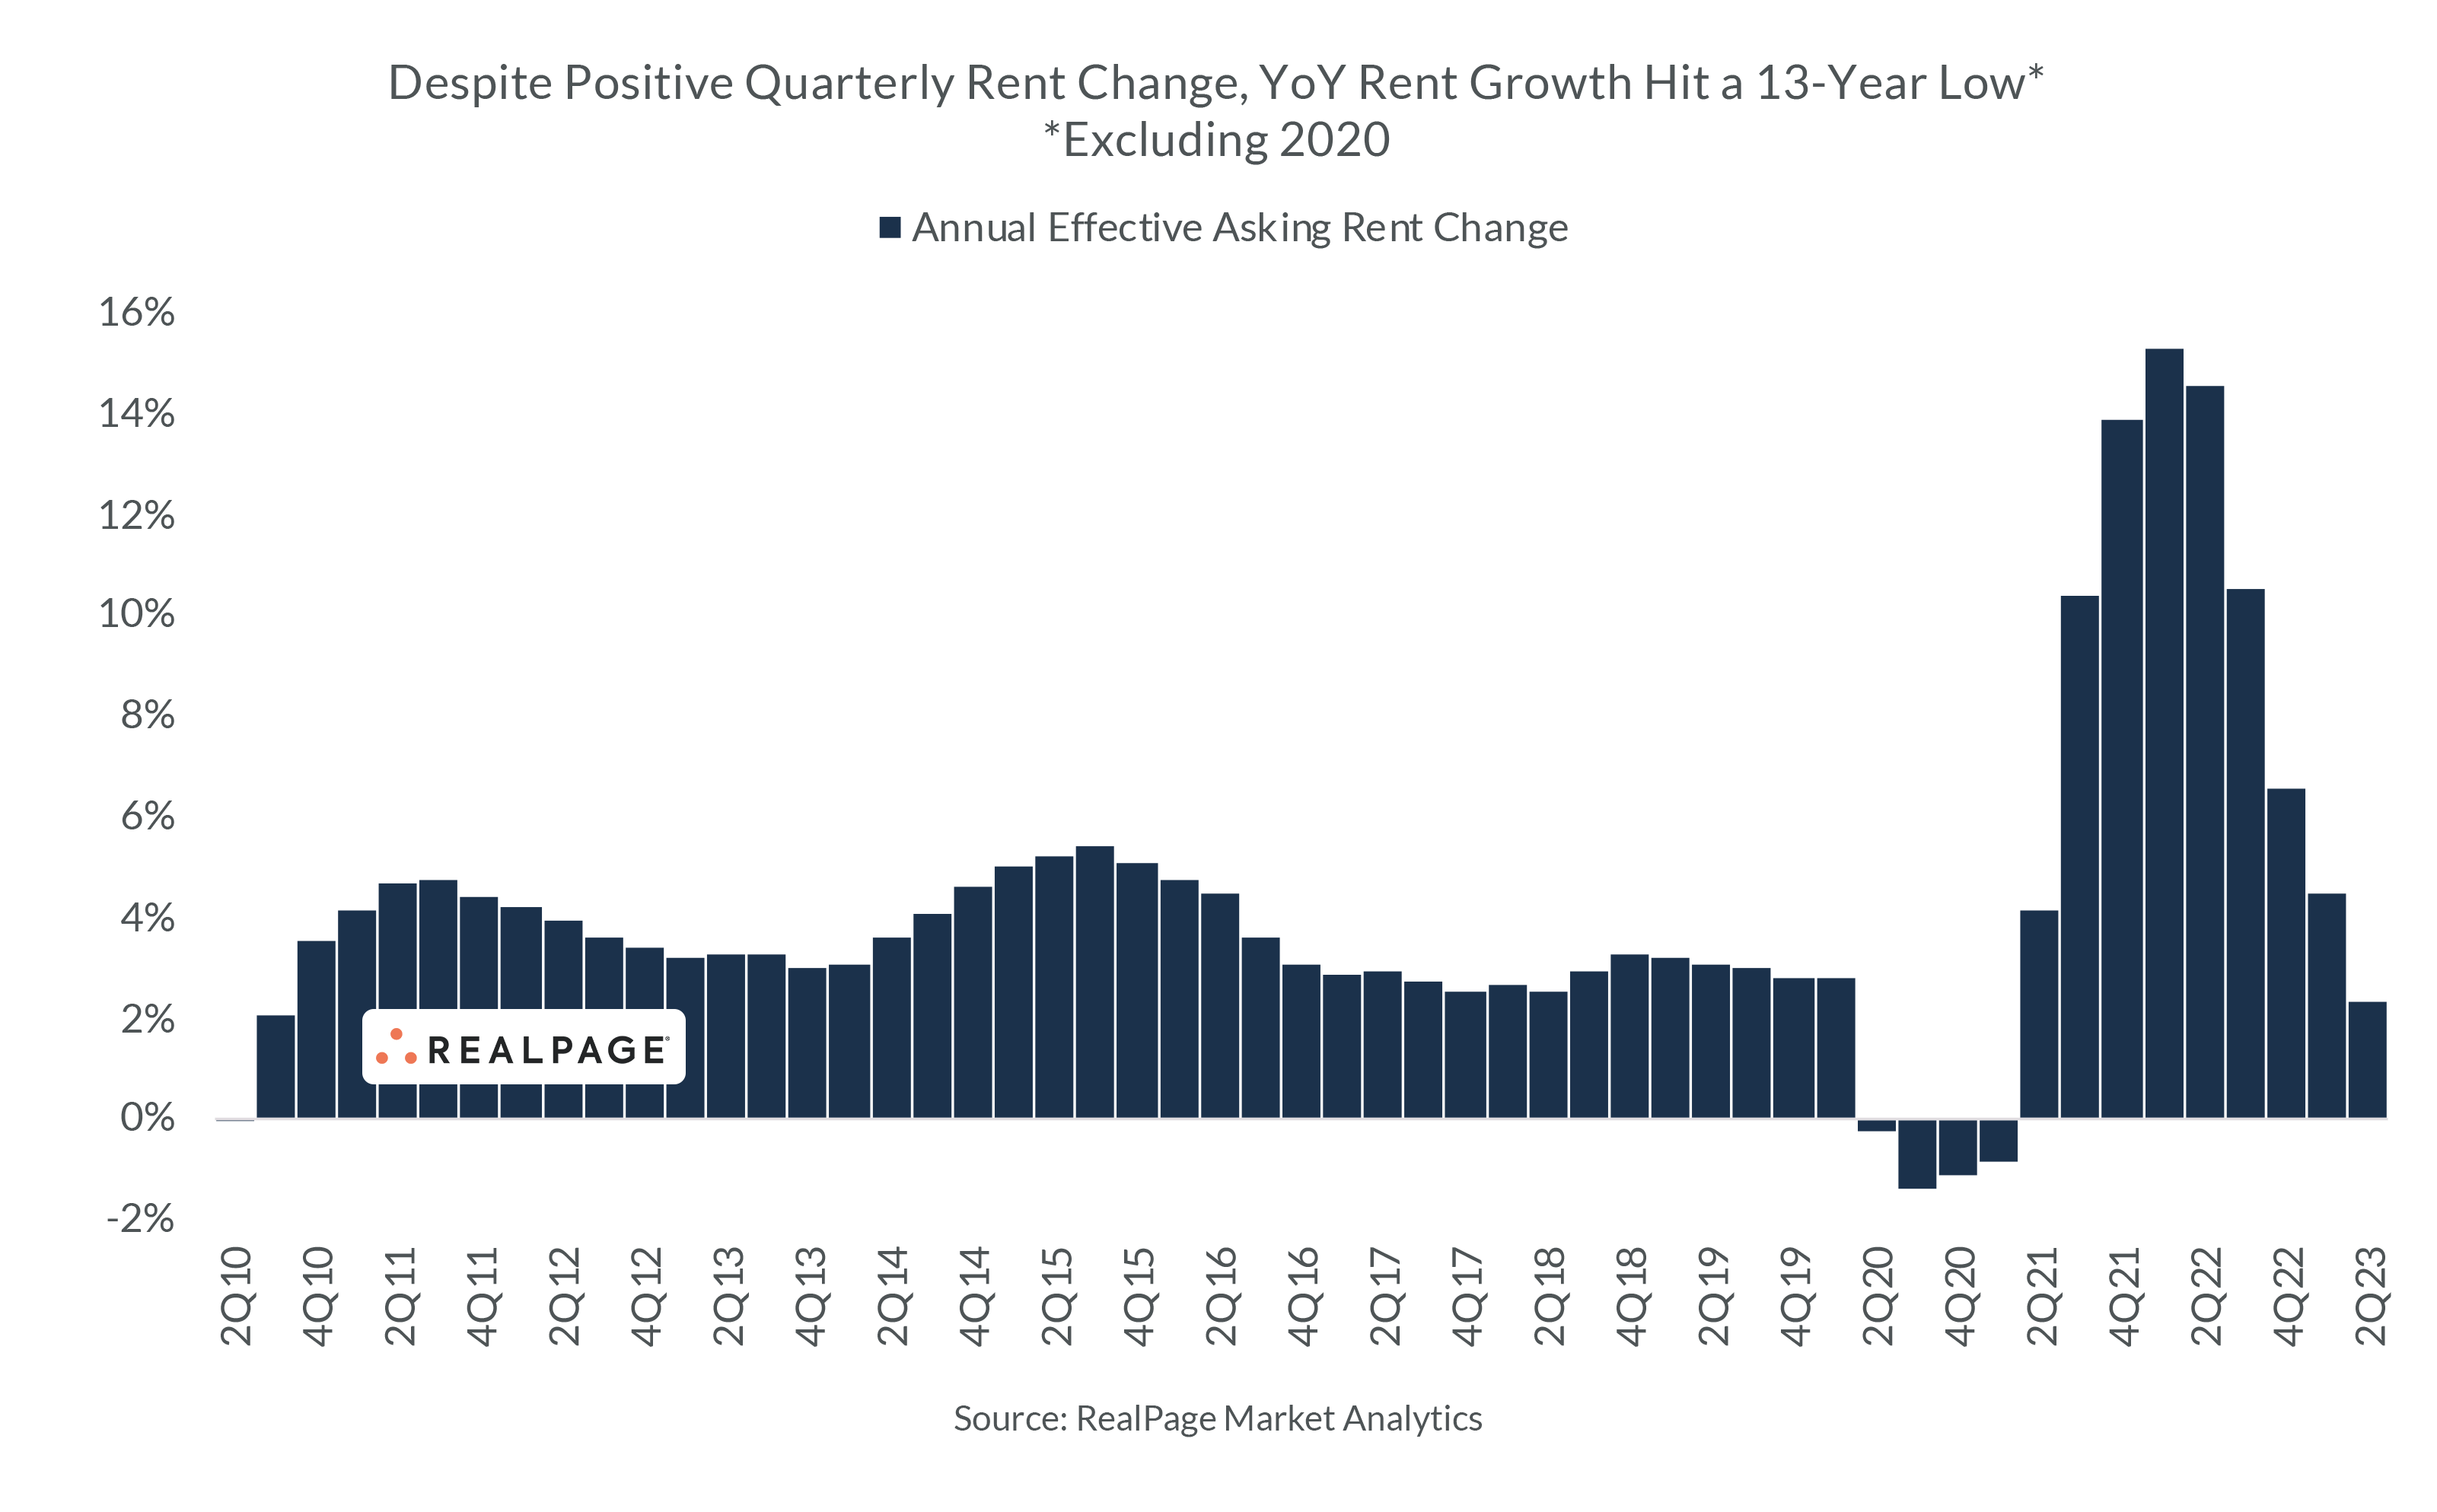
With demand largely outpacing supply over the last decade, rent growth averaged roughly 3.5% year-over-year, never dipping below 2.5% between the end of 2010 through the start of 2020. In 2nd quarter 2023, rents grew 2.3% year-over-year. This is the lowest growth rate since 3rd quarter 2010 (excluding the brief pandemic disruption period).
In short, this appears to be a point in the real estate cycle that the market hasn’t confronted in many years. New supply is robust enough to weigh on performance fundamentals. This doesn’t mean the market is overexpanding its inventory base though. Rather, new supply is doing what it is supposed to do at this point in the cycle. Faced with a decade’s long undersupply of housing, today’s rapid supply increase is re-shifting the balance of supply and demand. Short-term challenges may arise, but this rebalancing will benefit the long-term health of the market.
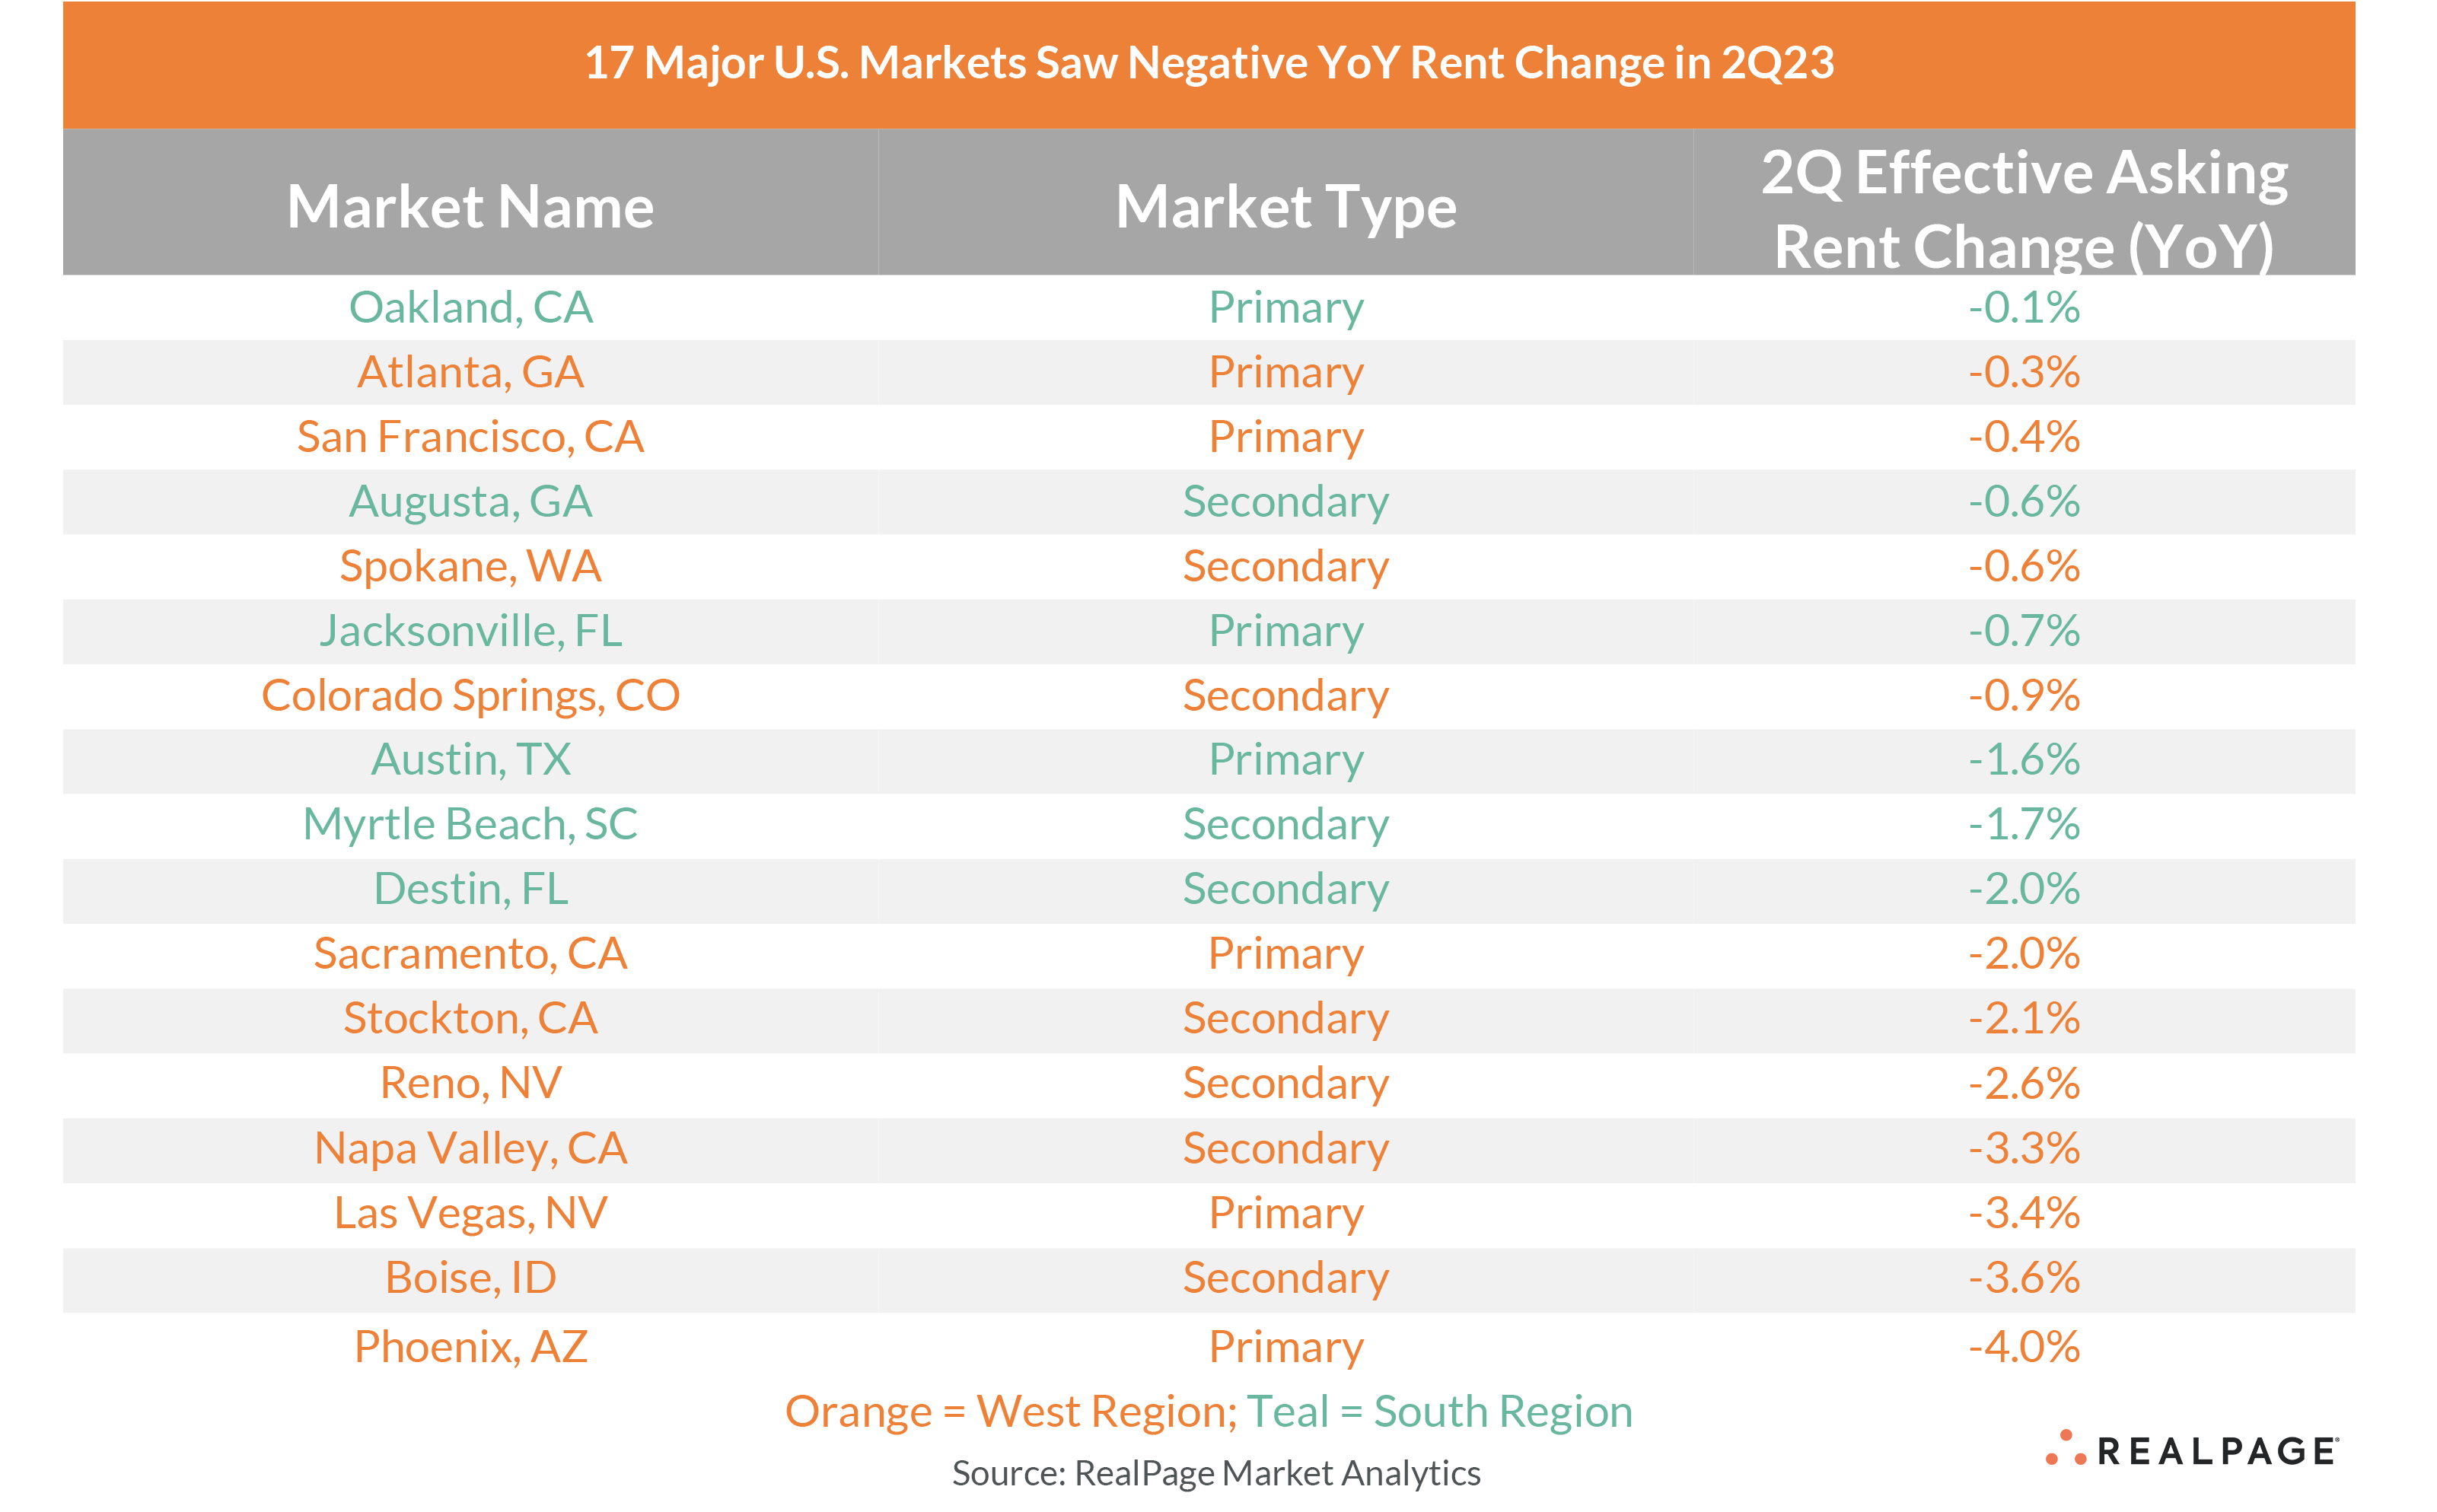
Some localized instances of hyper-supply do exist, however. And some markets with an onslaught of new supply and subsiding demand are indeed seeing rent contraction. (Slowing job growth, rebalancing migration patterns and other factors certainly play a role in these markets as well.) These examples tend to be isolated, as only 17 of the nation’s 150 largest apartment markets recorded rent cuts on an annual basis in 2nd quarter, accounting for just 11% of markets.
Stay tuned later this week when RealPage releases its updated 3rd quarter 2023 forecast update.


