Chicago Claims Most Balanced Supply/Demand Relationship Nationwide

Over the past five years, there has been a growing imbalance between supply and demand among many of the nation’s apartment markets. This is especially apparent over the past year as supply has been mounting to record levels across the country.
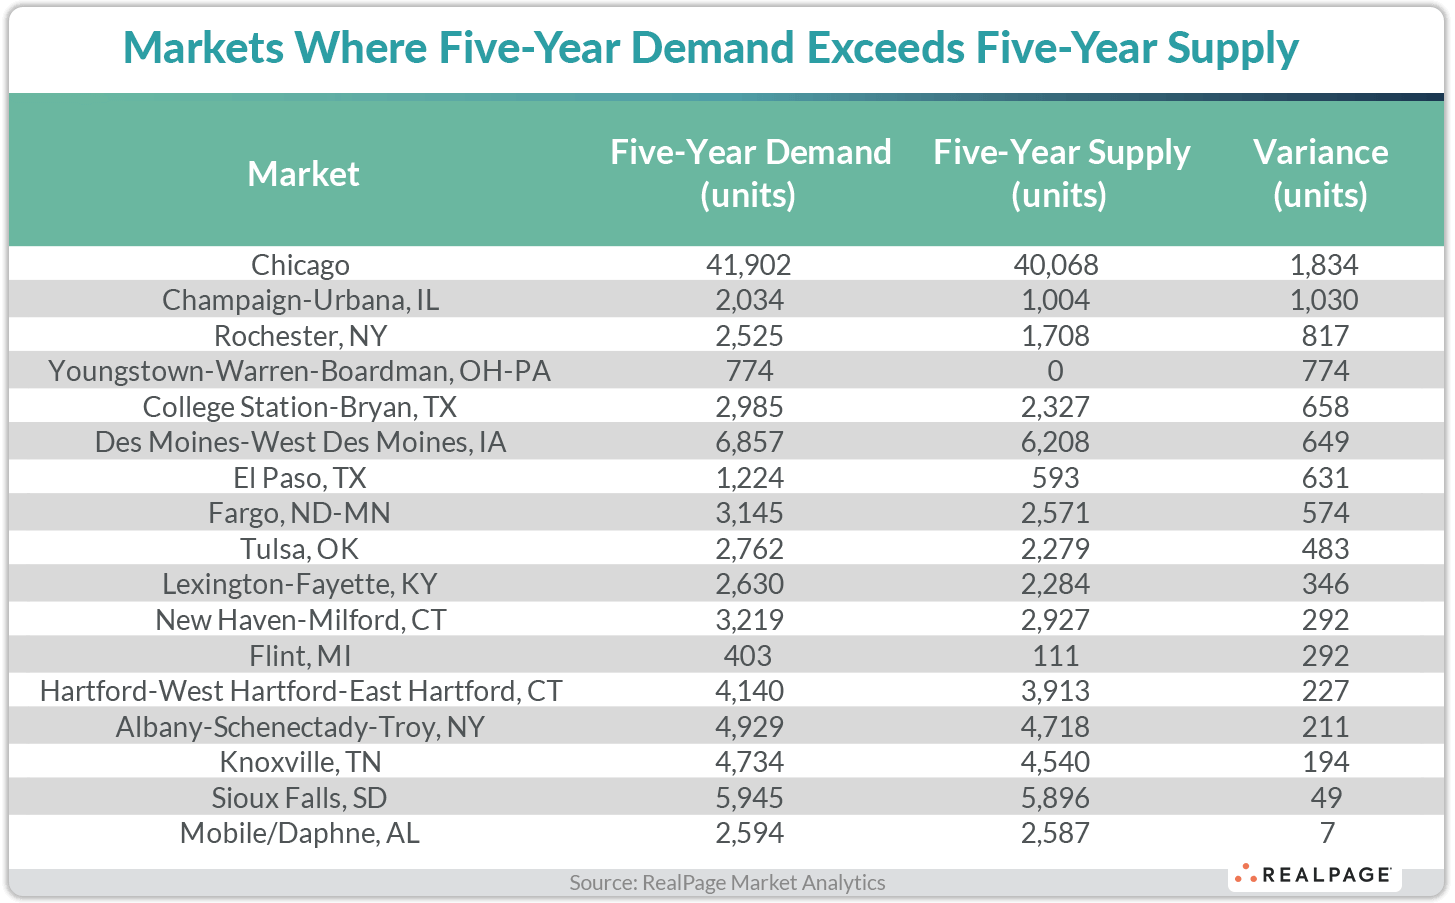
Among the core 150 apartment markets tracked by RealPage, only 17 saw cumulative demand exceed supply from 2nd quarter 2019 through 1st quarter 2024. These markets were generally smaller, secondary and tertiary markets. Of the 17, only one ranks among the 50 largest markets nationally.
Over the past five years, demand in Chicago totaled 41,902 units, exceeding completions of 40,068 units, according to data from RealPage Market Analytics. While that demand level ranked #9 nationally and the supply volume ranked #15 nationally, the 1,800 units of excess demand in Chicago over that five-year period ranked #1 nationally. That favorable balance between demand and supply has kept occupancy in the Windy City at roughly 95% or higher over much of the past five years. Only during the pandemic (in 2020 and into early 2021) did occupancy dip below the essentially full mark of 95%. As of 1st quarter 2024, occupancy in Chicago registered at 95.1%, 100 basis points (bps) above the national average (94.1%) and ranking #11 among the nation’s 50 largest markets.
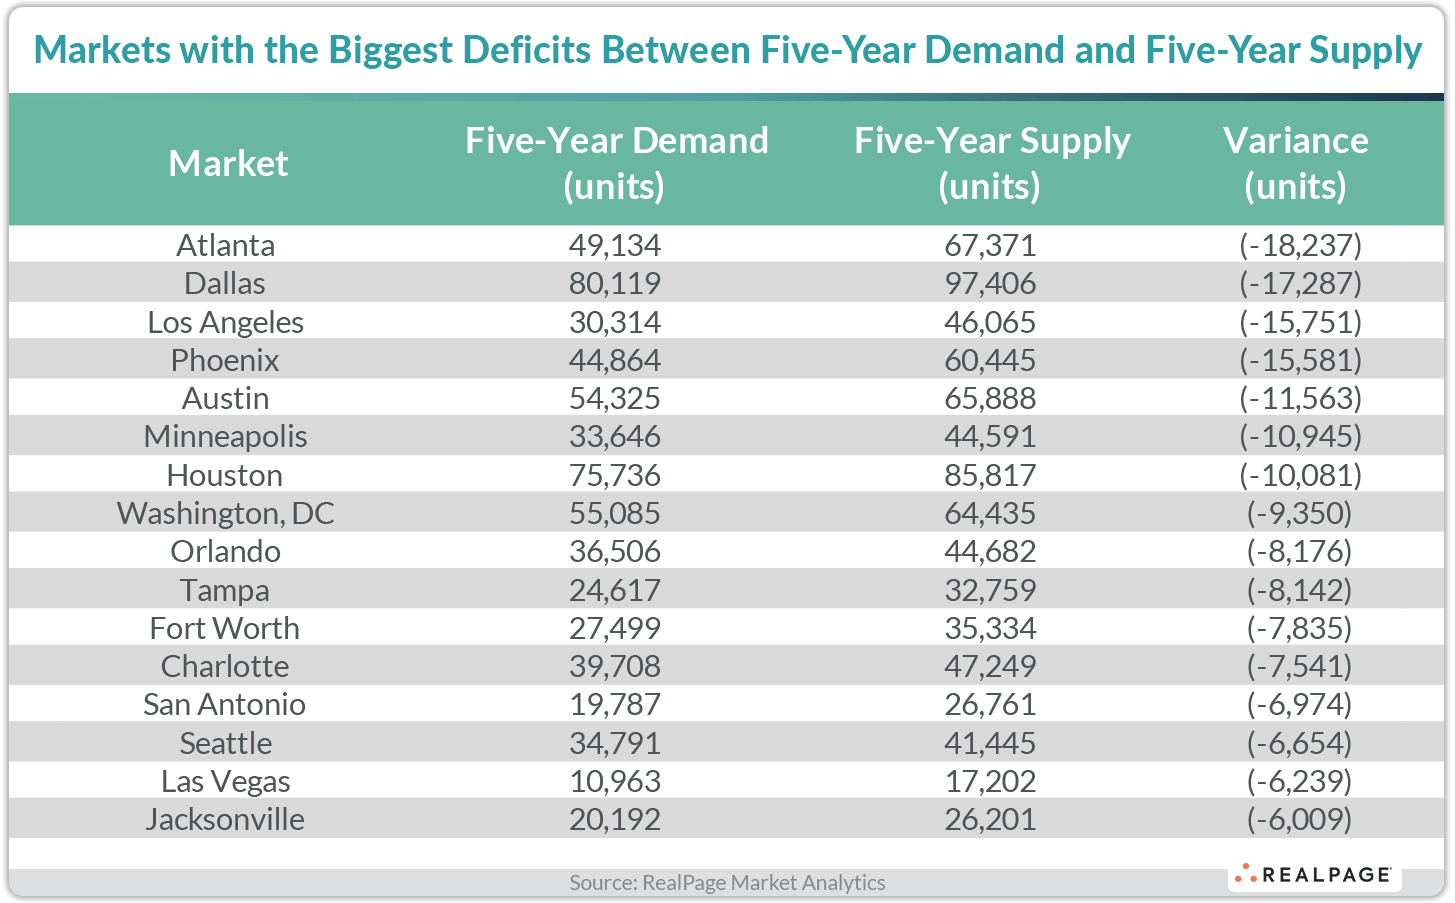
At the opposite end of the spectrum, Atlanta had the biggest deficit between demand and supply over the past five years. From 2nd quarter 2019 through 1st quarter 2024, demand in Atlanta totaled 49,134 units (#6 nationally) and supply totaled 67,371 units (#3 nationally), leaving a 18,237-unit shortfall in demand. As such, Atlanta’s occupancy dropped to an 11-year low of 92.2% in 2024’s 1st quarter.
In a contrast to the markets where demand exceeded supply, which tended to be smaller markets, markets where supply far exceeded demand tended to be large markets. That’s not surprising given that development activity has been mostly concentrated in larger markets within the Sun Belt over the last few years.
Other markets where five-year demand fell short of concurrent supply by more than 10,000 units included Dallas, Los Angeles, Phoenix, Austin, Minneapolis and Houston.
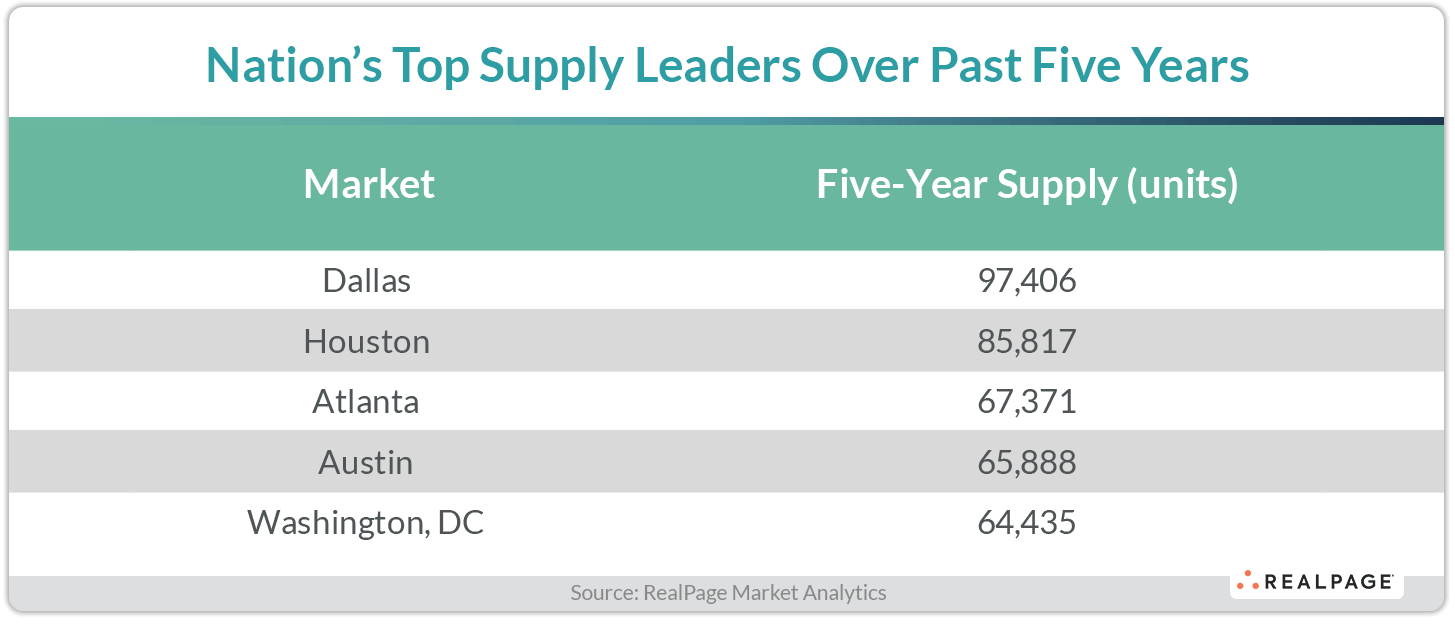
Despite demand lagging new supply over the past five years in those markets, absorption was very strong, but completions were even more robust. Dallas led the nation in terms of both five-year demand and five-year supply, with 80,119 units absorbed while 97,406 units came online. With supply exceeding demand, occupancy in the Dallas market dropped to a 13-year low of 92.8% in 1st quarter 2024. Houston ranked #2 nationally for both supply and demand over the past five years, absorbing 75,736 units while supply totaled 85,817 units, with occupancy landing at a three-year low of 92.4% in 1st quarter 2024.
In addition to Dallas and Houston, the nation’s top five demand leaders over the past five years included Washington, DC, Austin and Newark. In addition to Dallas, Houston and Atlanta, Austin and Washington, DC rounded out the top five supply leaders over the past five years.


