Suburban Apartment Inventory Growth Nearly Doubles This Cycle

Prior to this development cycle, it was typical for a metro area’s urban submarkets – including the Central Business District – to receive more supply than suburban counterparts. But not this cycle.
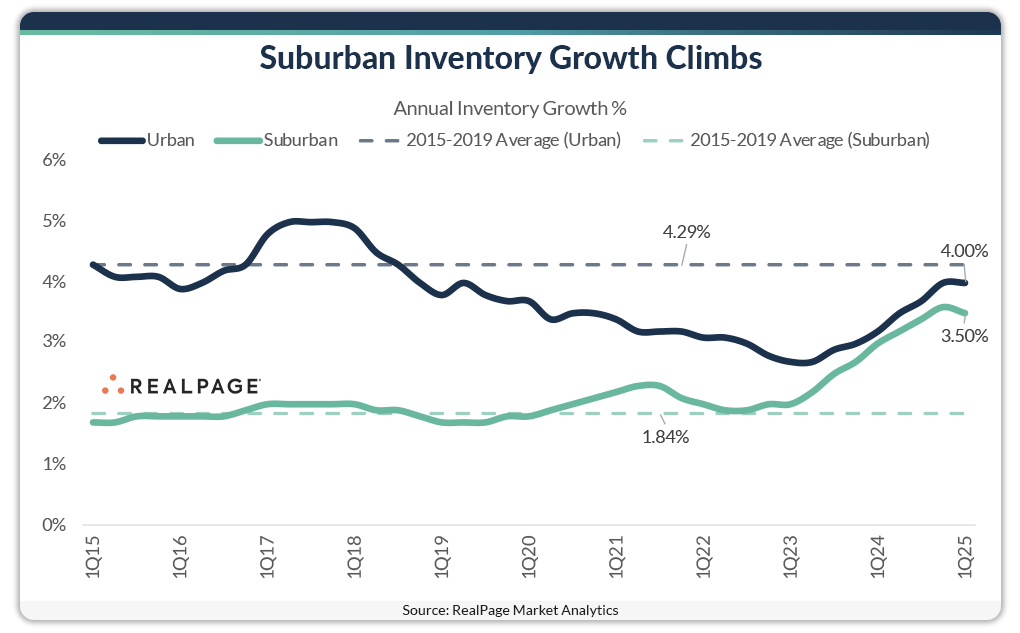
Since roughly 2020, development in urban submarkets has trended below average while development in suburban submarkets has trended above average.
Historically speaking, urban areas have been at the forefront of new development projects with an average annual inventory growth rate surpassing 4% since 2015. After experiencing a slight dip during 2021 and 2022, supply levels surged back to achieve a current growth rate of approximately 4% annually, mirroring trends from the late 2010s.
What stands out is how substantially suburban supply has increased over these past two years. Suburban inventory growth has traditionally averaged below 2% per year but that pace has almost doubled since early 2023.
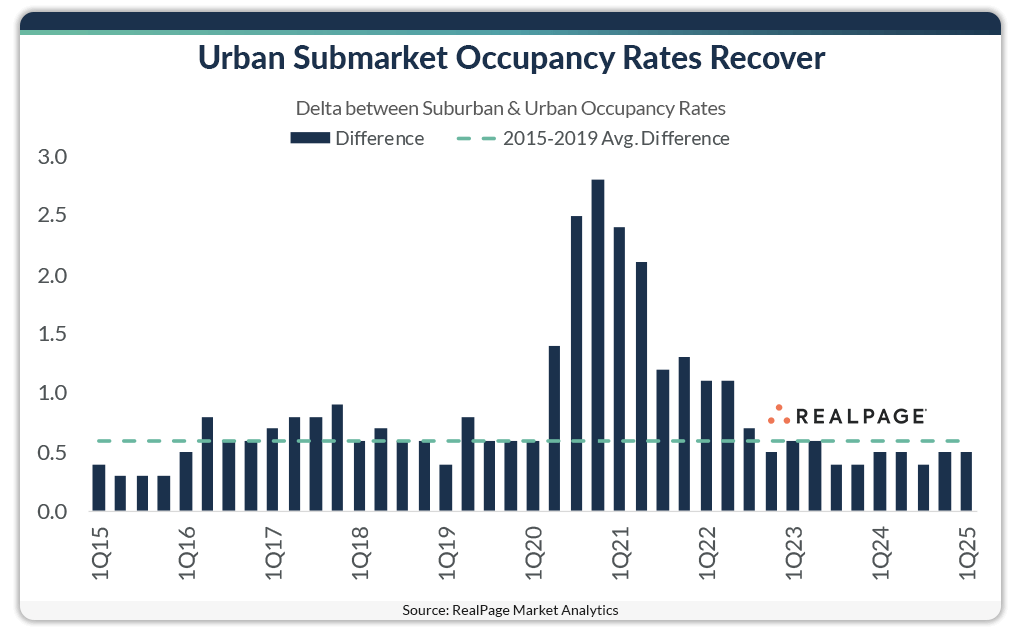
Demand, meanwhile, has recovered in urban areas after significant challenges throughout the early pandemic period. In 2020 and 2021, urban cores faced some of the strongest absorption headwinds due to out-migration as these areas saw some of the most robust lockdowns.
Over the last couple quarters, however, the difference in occupancy between urban and suburban regions has narrowed pretty significantly and actually has remained below the pre-pandemic average for the last couple years.
This indicates that urban demand has recovered from those net-move outs seen over the last few years. Although that’s not to say that absorption hasn’t been exceptional in suburban submarkets as well.


