The pace of multifamily permitting is continuing its declining trend that began in mid-2022.
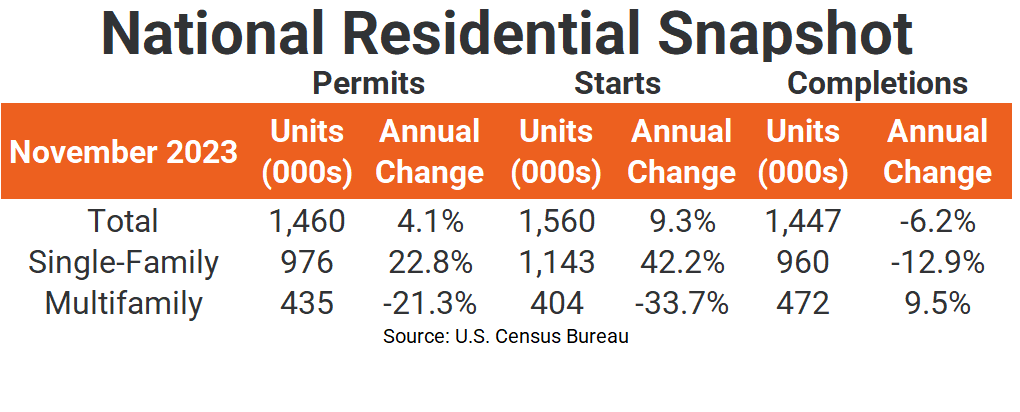
The November seasonally adjusted annual rate (SAAR) for multifamily permits fell 9.6% from October’s rate and 21.3% from last year to 435,000 units. That figure is well below the annual total for not seasonally adjusted multifamily permits of 513,600 units.
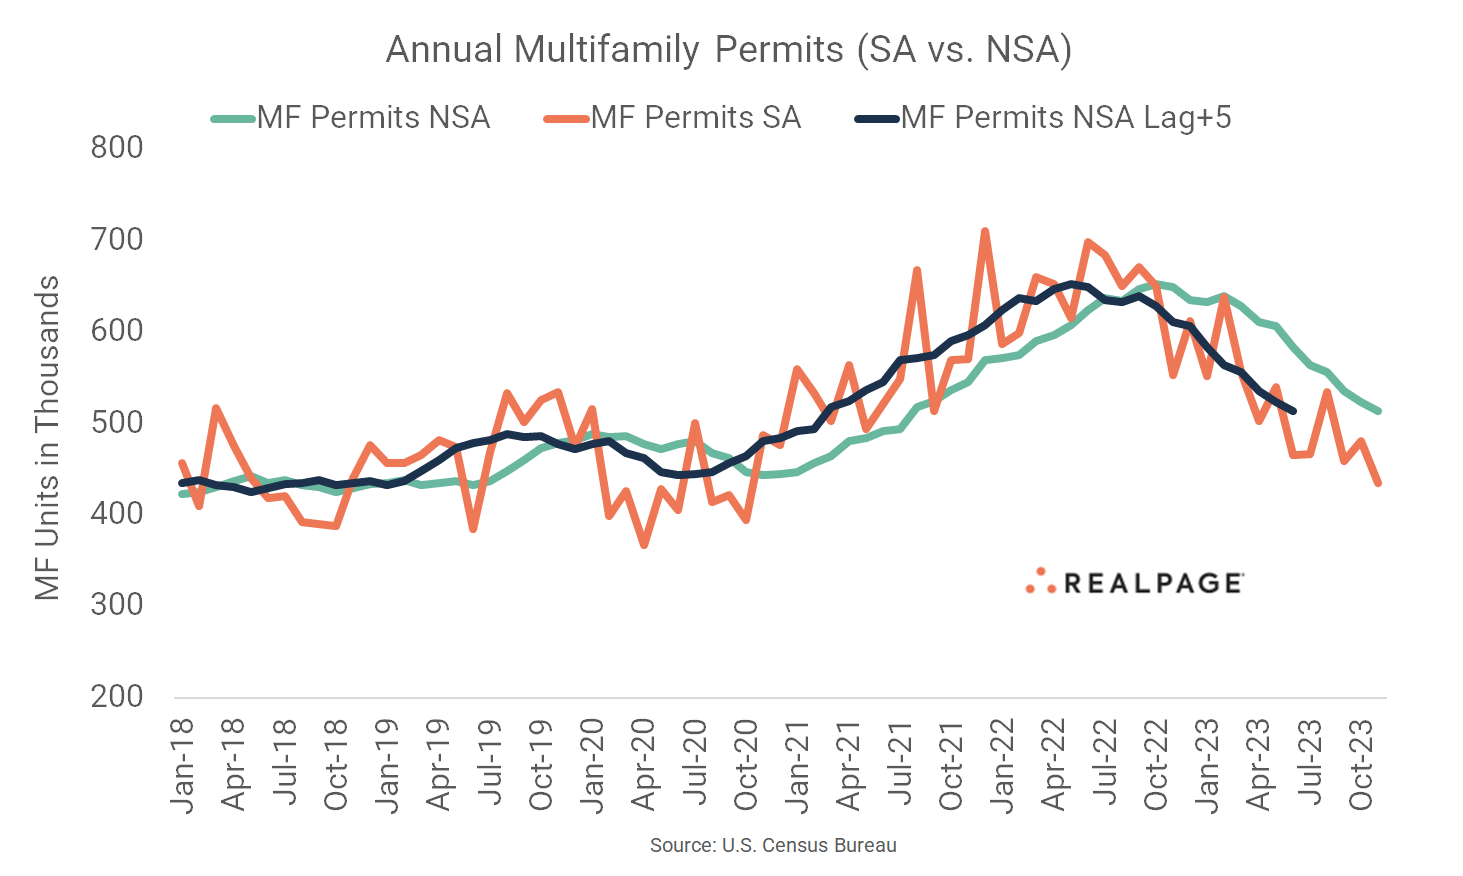
However, the large difference is more a matter of timing than methodology. As seen in the chart below, the SAAR for multifamily permitting peaked mid-2022 while the unadjusted sum peaked about 5-6 months later.

The SAAR is calculated by seasonally adjusting the monthly figure and multiplying by 12, while the unadjusted total is just that, the sum of multifamily units permitted in the roughly 20,000 permitting places tracked by the Census Bureau.
Lagging unadjusted permitting by five months aligns both trend lines. In other words, the SAAR leads “actual” multifamily permitting by 5-6 months. Multifamily starts are from a different survey but have a similar but shorter lead-lag difference of about three months. Total unadjusted starts were 458,800 units compared to the SAAR of 404,000 units.
Meanwhile, the SAAR for single-family permitting was almost unchanged from last month but 22.8% higher from last year at 976,000 units. Single-family starts surged 18% from October’s annual rate to 1.143 million unit and were up 42.2% from last November.
Completions of multifamily units jumped 26.5% from October to 472,000 units and increased 9.5% from last November. The number of multifamily units under construction was unchanged from October at 988,000 units but was up 7.9% from last year. Additionally, the number of multifamily units authorized but not started was also unchanged at 135,000 units in November but was down 11.2% from one year ago.
Single-family completions were down 3.2% for the month and were down 12.9% for the year to 960,000 units. The number of single-family units under construction increased slightly (1.9%) at 680,000 units but that was 10.8% less than one year ago. Single-family units authorized but not started fell 4.2% from October at 136,000 units and 6.2% from last year.
Together with the small 2-4 unit figures, total residential permitting slipped 2.5% from last month but increased 4.1% for the year to 1.46 million units. The sharp annual increase in single-family starts brought the SAAR of total residential starts up 14.8% from October to 1.56 million units and increased starts by 9.3% from last year.

Compared to one year ago, the annual rate for multifamily permitting decreased in three of the four Census regions, with the largest decrease in the small Northeast region (down 70.8% to 15,000 units), while the South (down 31.4% to 201,000 units) and Midwest (down 29.9% to 63,000 units) regions were down by almost a third. The West region saw multifamily permitting increase by 30.1% to 157,000 units. Compared to the previous month, permitting was down in the South and Northeast and up in the West and Midwest.
Multifamily starts fell sharply in the Midwest region (down 69.6% to 43,000 units) and were down considerably in the West (down 42.9% to 101,000 units) and South (down 25.3% to 203,000 units) regions. The Northeast region saw an increase of 181.7% in starts to 58,000 units, close to their annual average. Compared to October’s SAAR, starts were down by about half in the Midwest, but up in the remaining three regions.
Metro-Level Multifamily Permitting
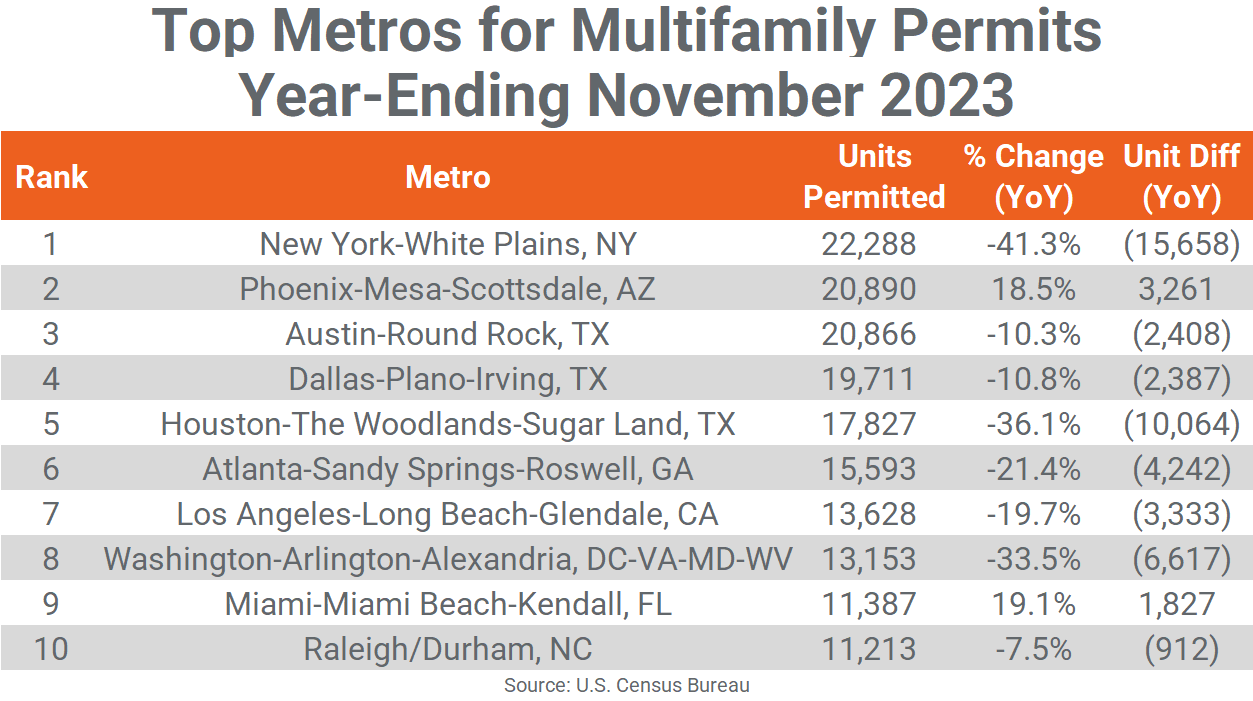
All the top 10 markets from October’s list returned in November with half remaining in order. New York once again led the nation in multifamily permitting but continues cooling with a total of 22,288 units permitted in the 12-months-ending November, down by almost 15,700 units from last year.
Phoenix moved up the list two spots to #2 with 20,890 units permitted for the year, up more than 1,800 units from October’s total and 3,261 units more than last year. Austin slipped to the #3 spot, permitting 20,866 units, about even with last month but 2,408 units fewer than last year.
Dallas also moved down one spot to #4 with an annual total of 19,711 units, up slightly from October but down almost 2,400 units from last November. Houston remained in the #5 spot with 17,827 units permitted, down about 1,200 units for the month and 10,064 units for the year.

Atlanta returned in the #6 spot, permitting 15,593 units but slowing by about 1,500 units from October and 4,200 units from last November. Washington, DC and Los Angeles switched places at #7 and #8 with about 13,000 units permitted apiece, close to their annual totals in October but down from 3,000 to 4,000 units from last year.
Miami and Raleigh/Durham remained at #9 and #10 with both permitting about 11,000 units for the year-ending November and both declining by about 1,100 units for the month (although Miami increased from last year while Raliegh/Durham declined).
Only two of the top 10 multifamily permitting markets increased their annual totals from the year before and the size of the increases averaged 19% growth. On the other side, New York had the largest decrease in annual multifamily permitting of the top 10 (-15,658 units), followed by Houston (-10,064 units) and Washington, DC (-6,617 units).
Other major markets with significant declines in permitting include Philadelphia (-9,495 units), Seattle (-7,567 units), Minneapolis/St. Paul (-6,049 units), Boston (-5,001 units), San Antonio (-4,494 units) and Denver (-4,120 units).
In addition to Phoenix and Miami, other major markets with significant year-over-year increases in annual multifamily permitting in the year-ending November were Nashville (+5,149 units), Riverside (+4,824 units), Greensboro/Winston-Salem (+2,579 units), San Diego (+2,480 units) and Charlotte (+1,950 units).
The annual total of multifamily permits issued in the top 10 metros – 166,556 – was about 20% less than the 207,089 issued in the previous 12 months and down about 5% from last month. The total number of permits issued in the top 10 metros was almost equal to the number of permits issued for the #11 through #33 ranked metros.
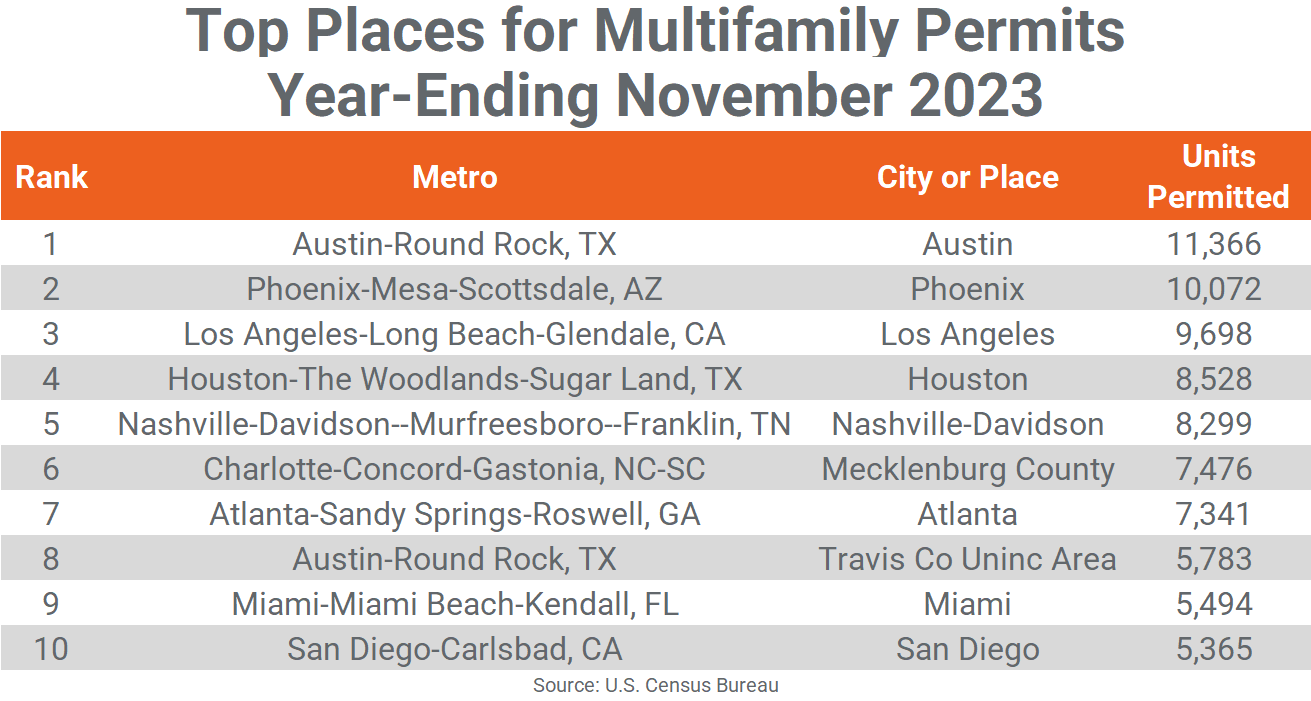
Below the metro level, eight of last month’s top 10 permit-issuing places returned to this month’s list with five remaining in the same place (including the first four in order) and the rest changing places. The list of top individual permitting places (cities, towns, boroughs, and unincorporated counties) generally include the principal city of some of the most active metro areas.

In November, the city of Austin remained in the #1 position with 11,366 units permitted, 341 fewer units than in October. The city of Phoenix returned at #2 in November with 10,072 units permitted, 318 more than last month. The city of Los Angeles retained the #3 spot by permitting 9,698 units, about even with October. The city of Houston also retained its previous spot at #4 with 8,528 units permitted, only 97 units more than October’s total.
The city of Atlanta and the city-county of Nashville-Davidson switched places at #5 and #7 this month, straddling #6 Mecklenburg County (Charlotte). Nashville-Davidson increased their total by almost 600 units permitted to 8,299 units for the year while the city of Atlanta slowed by a similar amount to 7,341 units permitted. Mecklenburg County (Charlotte) permitted about 400 fewer units through November to total 7,476 units.
The unincorporated areas of Harris County (Houston) and Hillsborough County (Tampa) fell off the top 10 list this month, replaced by the city of San Diego and unincorporated Travis County (Austin). The city of Miami moved up one spot to #9 as each the remaining three places permitted about 5,400 to 5,800 units for the year.
Of the top 20 permitting places, Texas has six representatives, Florida three, North Carolina and California two. Despite leading the nation at the metro level, New York’s Brooklyn borough is the only permitting place on the top 20.


