Multifamily Starts Slow as Permitting Picks Up Slightly
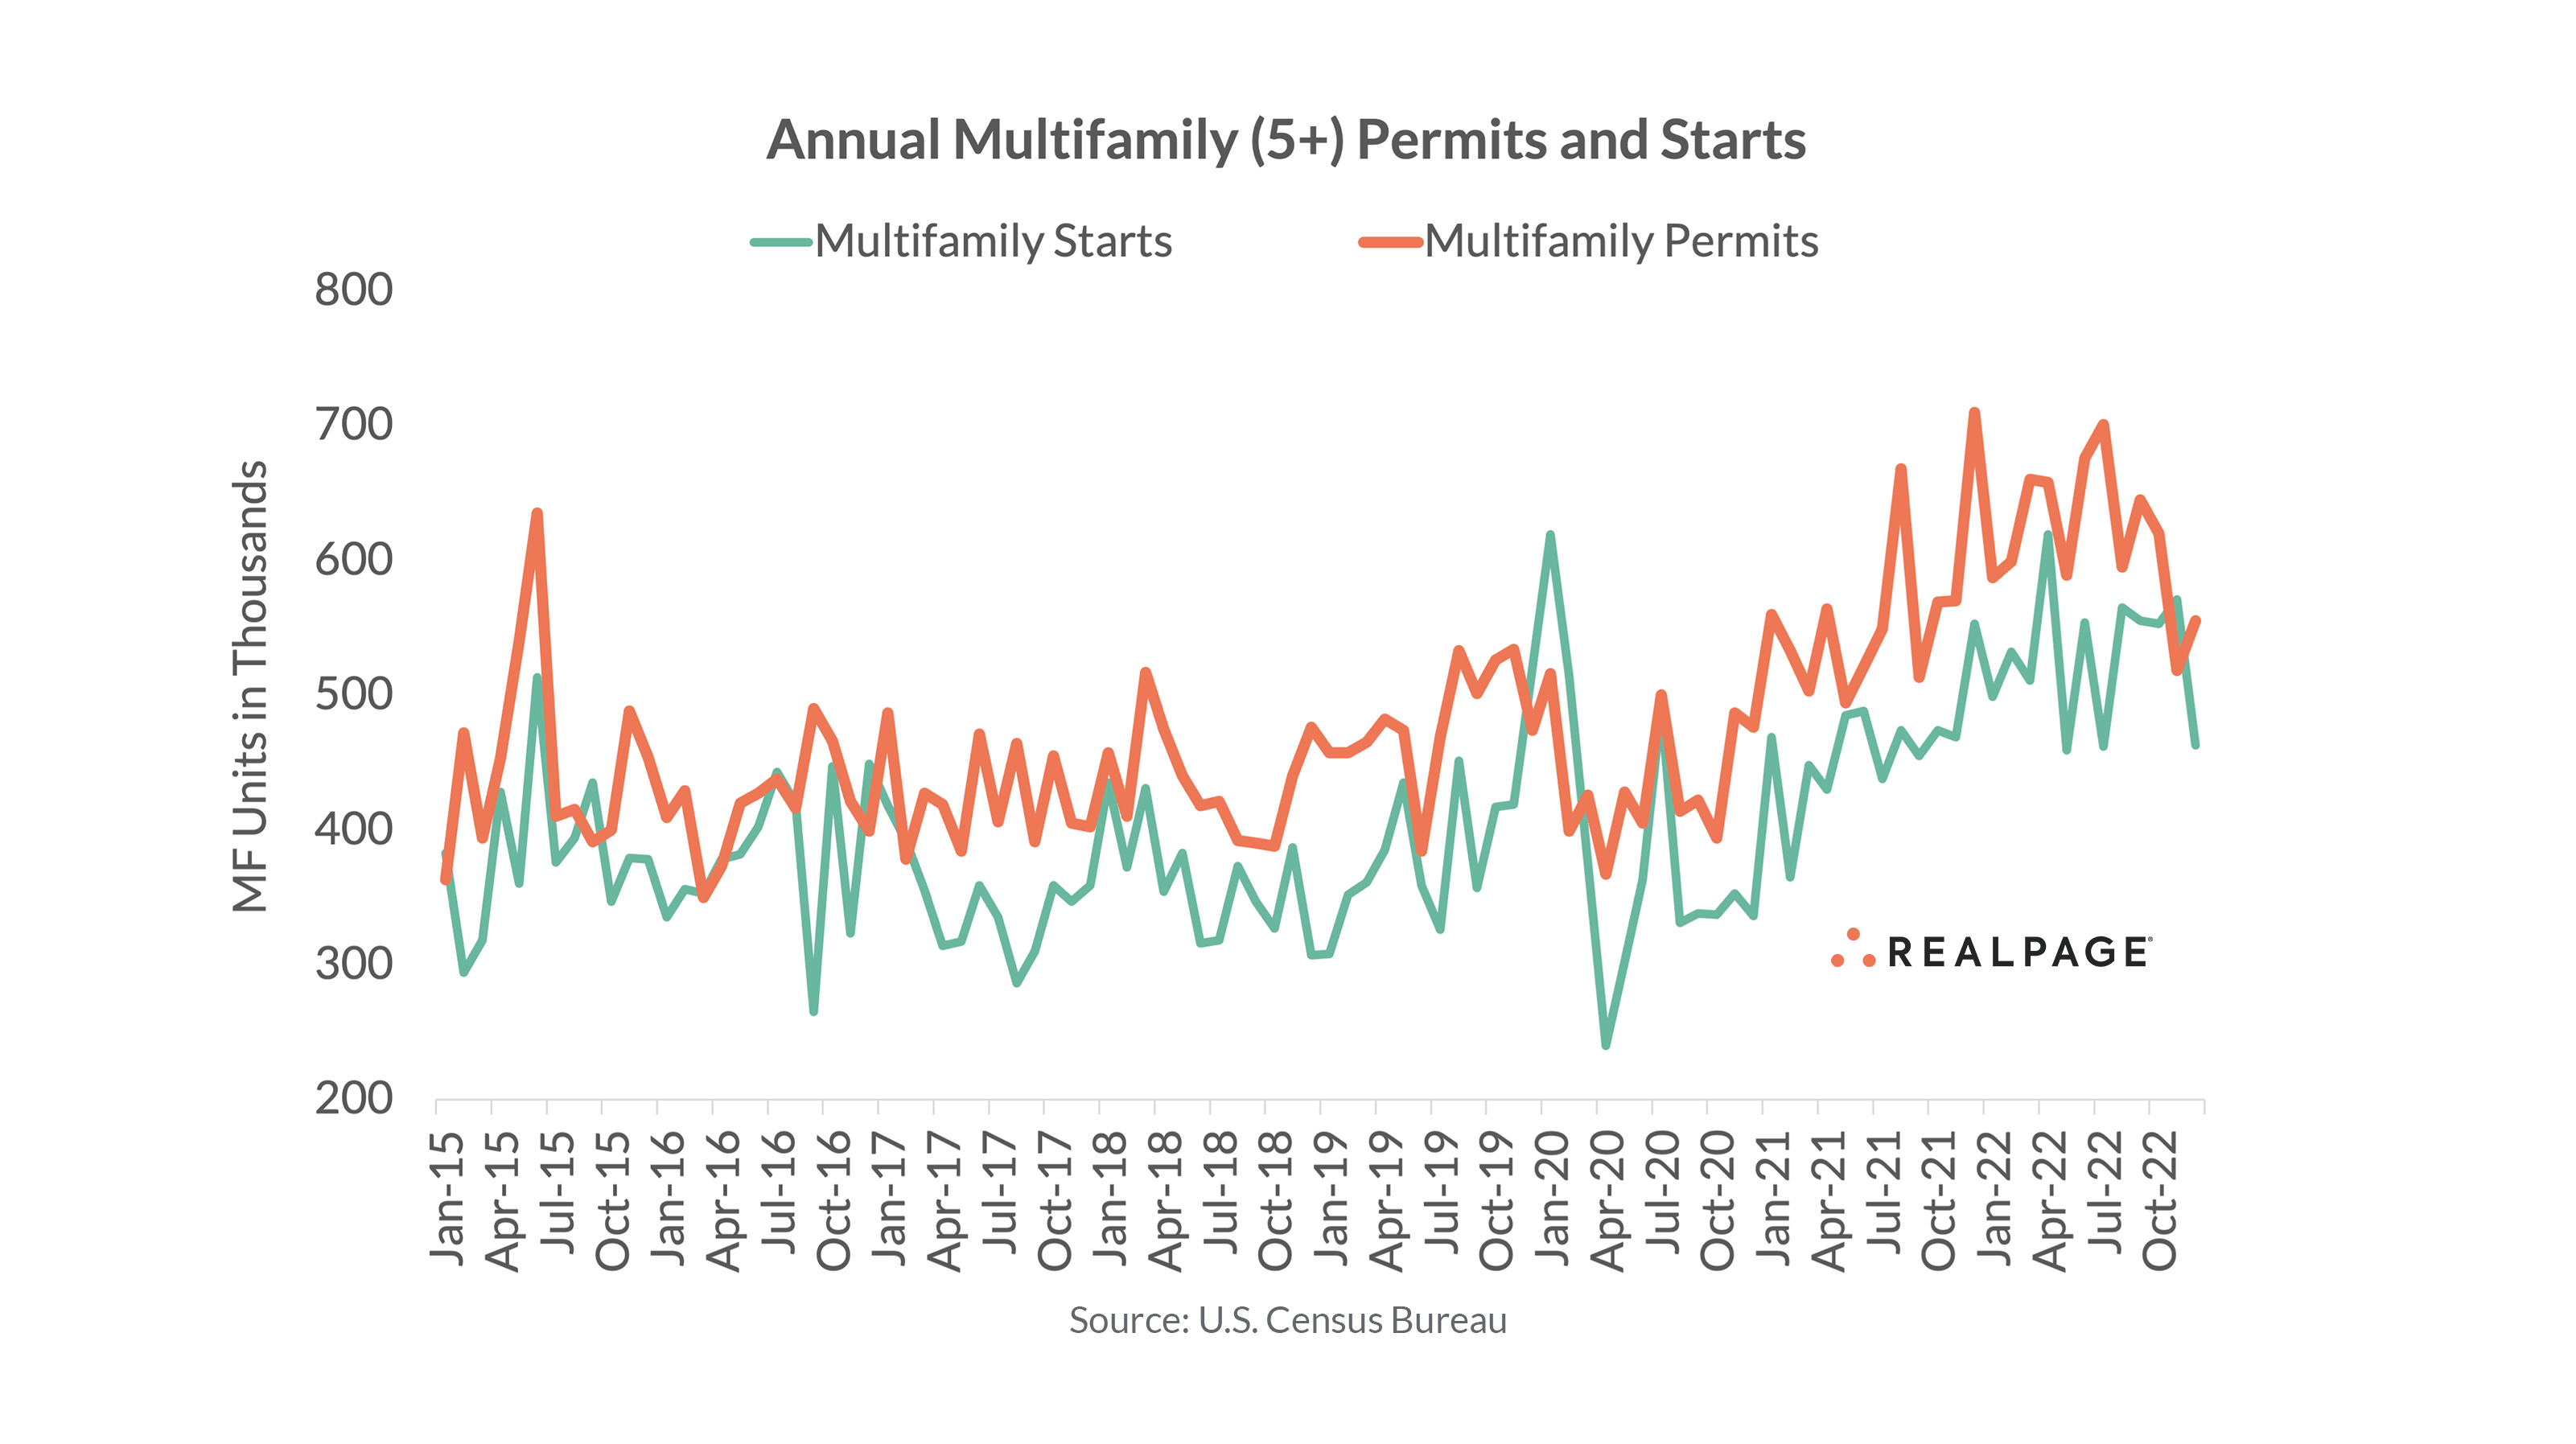
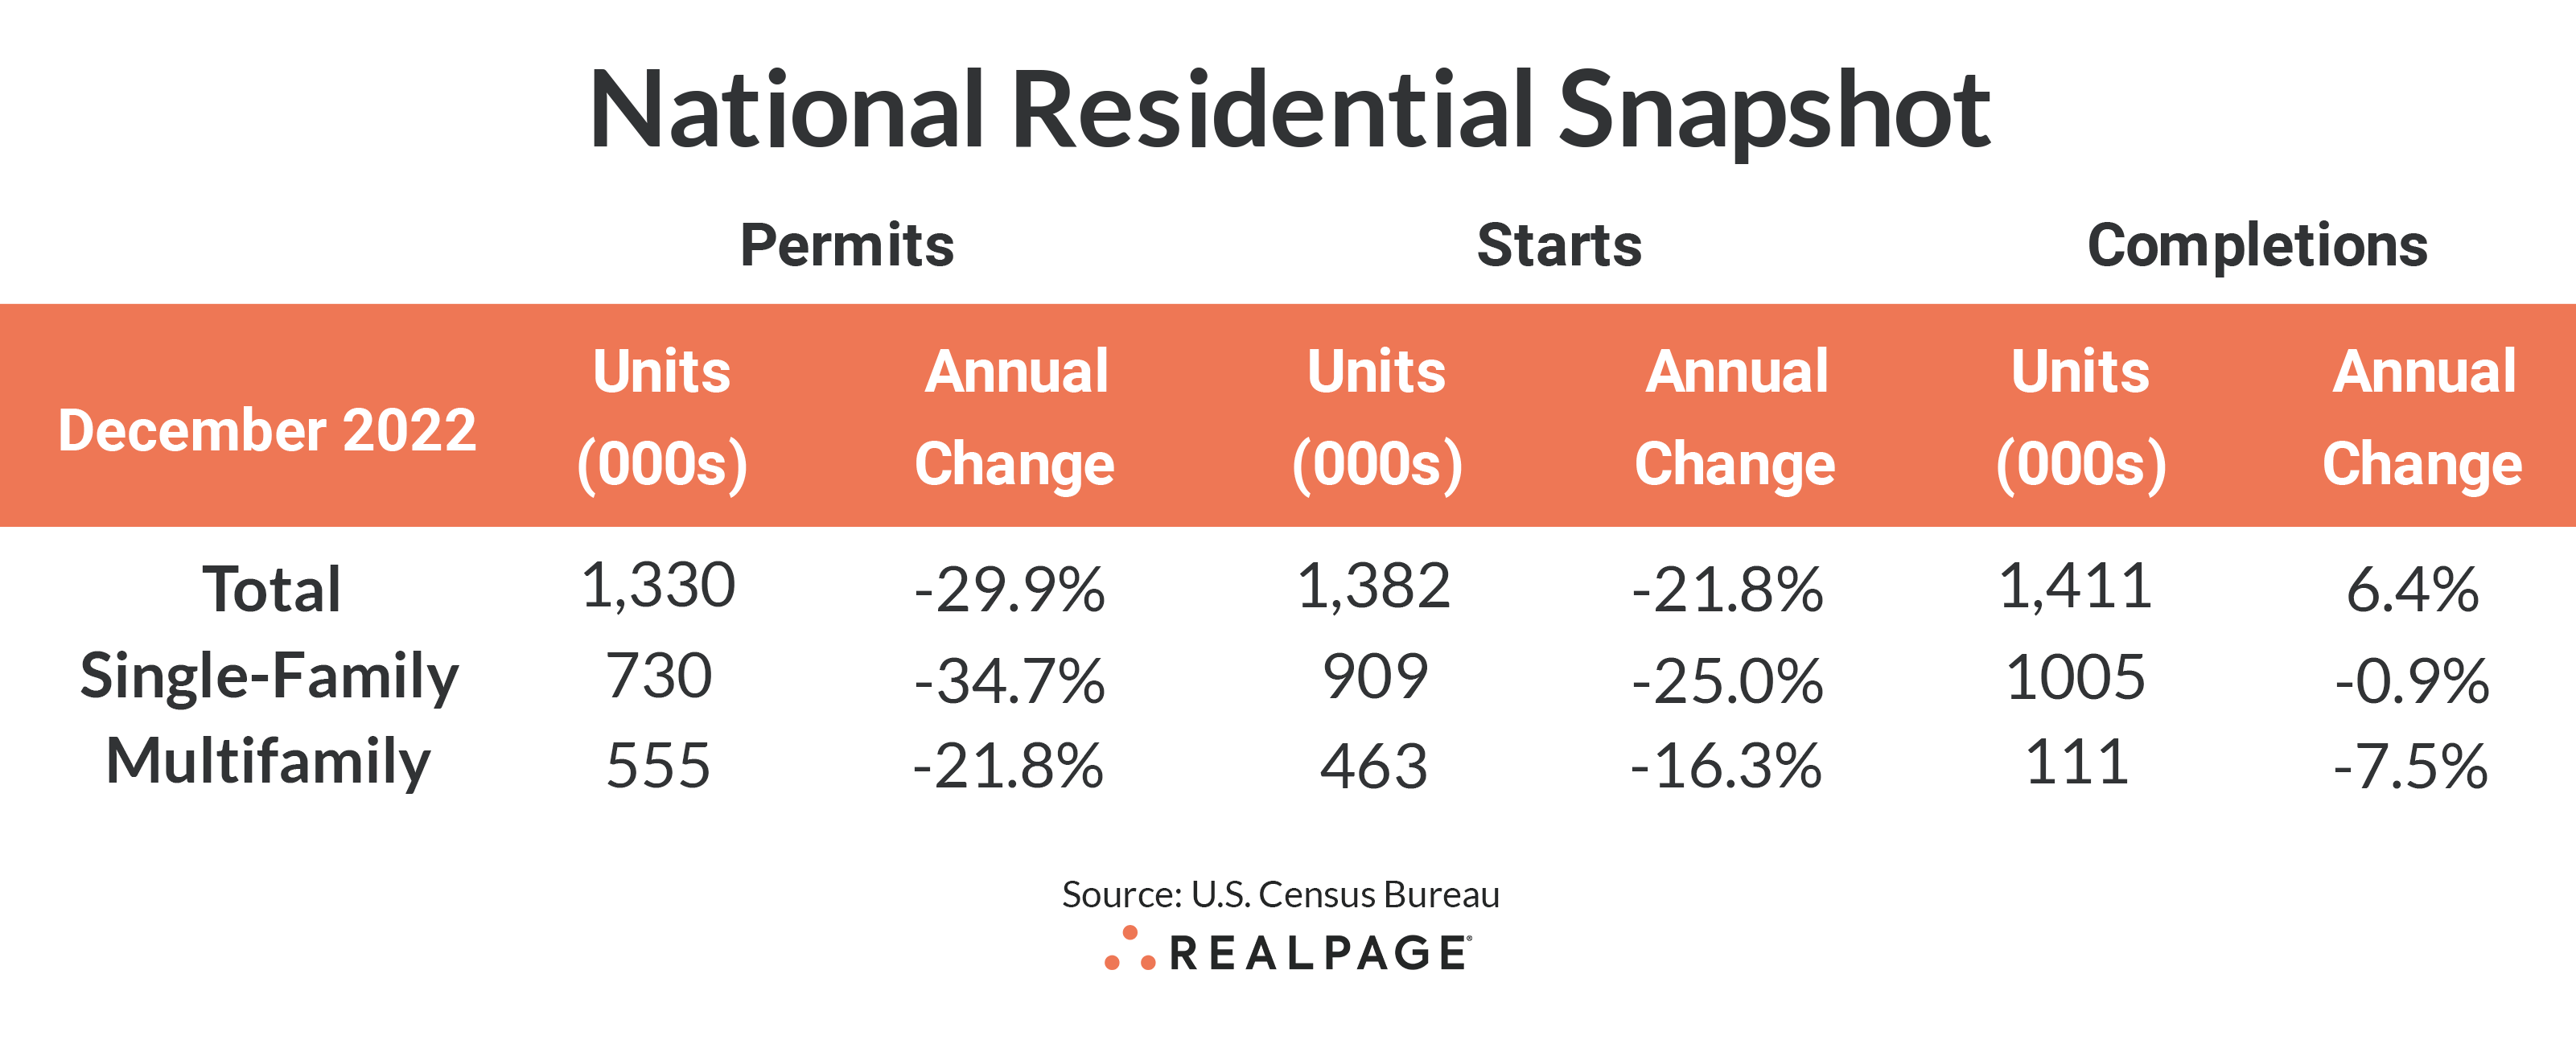
The seasonally adjusted annualized rate of multifamily permitting (5+ units) in December increased by more than 7% from November’s rate to 555,000 units, according to the U.S. Census Bureau’s monthly report. However, multifamily permitting is down almost 22% from one year ago. Meanwhile, annualized multifamily starts fell almost 19% from last month’s pace and more than 16% from December 2021 to 463,000 units.
Early trends appear to indicate that multifamily permitting and starts are beginning to drift closer to their pre-pandemic averages when annualized multifamily permitting hovered around 442,000 units from 2015 to 2019, while multifamily starts averaged 372,000 units annually over the same period. Since 2020, they have averaged 532,000 and 458,000 units, respectively.
Single-family permitting declined for the 10th consecutive month, from an annualized rate of 1.2 million homes in February of this year to just 730,000 units in December. That was the lowest annualized single-family permitting rate since July 2016. Year-over-year, single family permitting is down almost 35%.
However, the annualized rate for single-family starts increased 11.3% from November to 909,000 units, but that was down from last year’s pace by 25%. Single-family starts have fallen below one million units for the sixth consecutive month.
With fewer starts come fewer completions. Multifamily completions were about half the pace of November at 111,000 units and were down 7.5% for the year. Single-family completions are also slowing, dropping 8% from November to just over one million units.
The number of multifamily units authorized but not started slipped 3.4% for the month to 144,000 units but that is still 20% greater than one year ago. Single-family units authorized but not started fell below 140,000 units for the first time all year.
Despite slowing starts and construction delays, the number of multifamily units under construction (926,000 units) currently exceeds that of single-family (769,000 units) and has since May.
Compared to one year ago, the annual rate for multifamily permitting was up only in the Census’ South region (up 7.8% to 288,000 units). The West region saw a decline of 9.5% from last year to 155,000 units and the Midwest fell 28.8% to 65,000 units. The Northeast region dropped almost 74% from last December as the bulge in permitting in Philadelphia that month drops off the total (down 73.6% to 48,000 units). Compared to the previous month, permitting was down in two regions, with the South and West regions showing solid increases from November.
Multifamily starts were up in half of the four regions, with big increases in the Northeast (14.4% to 82,000 units) and West (0.2% to 130,000 units). Starts in the South were down 5.5% (to 218,000 units) and were down significantly in the Midwest region (down 71.8% to just 35,000 units). Compared to November’s rate, starts were down in all regions except the Northeast.
Metro-Level Multifamily Permitting
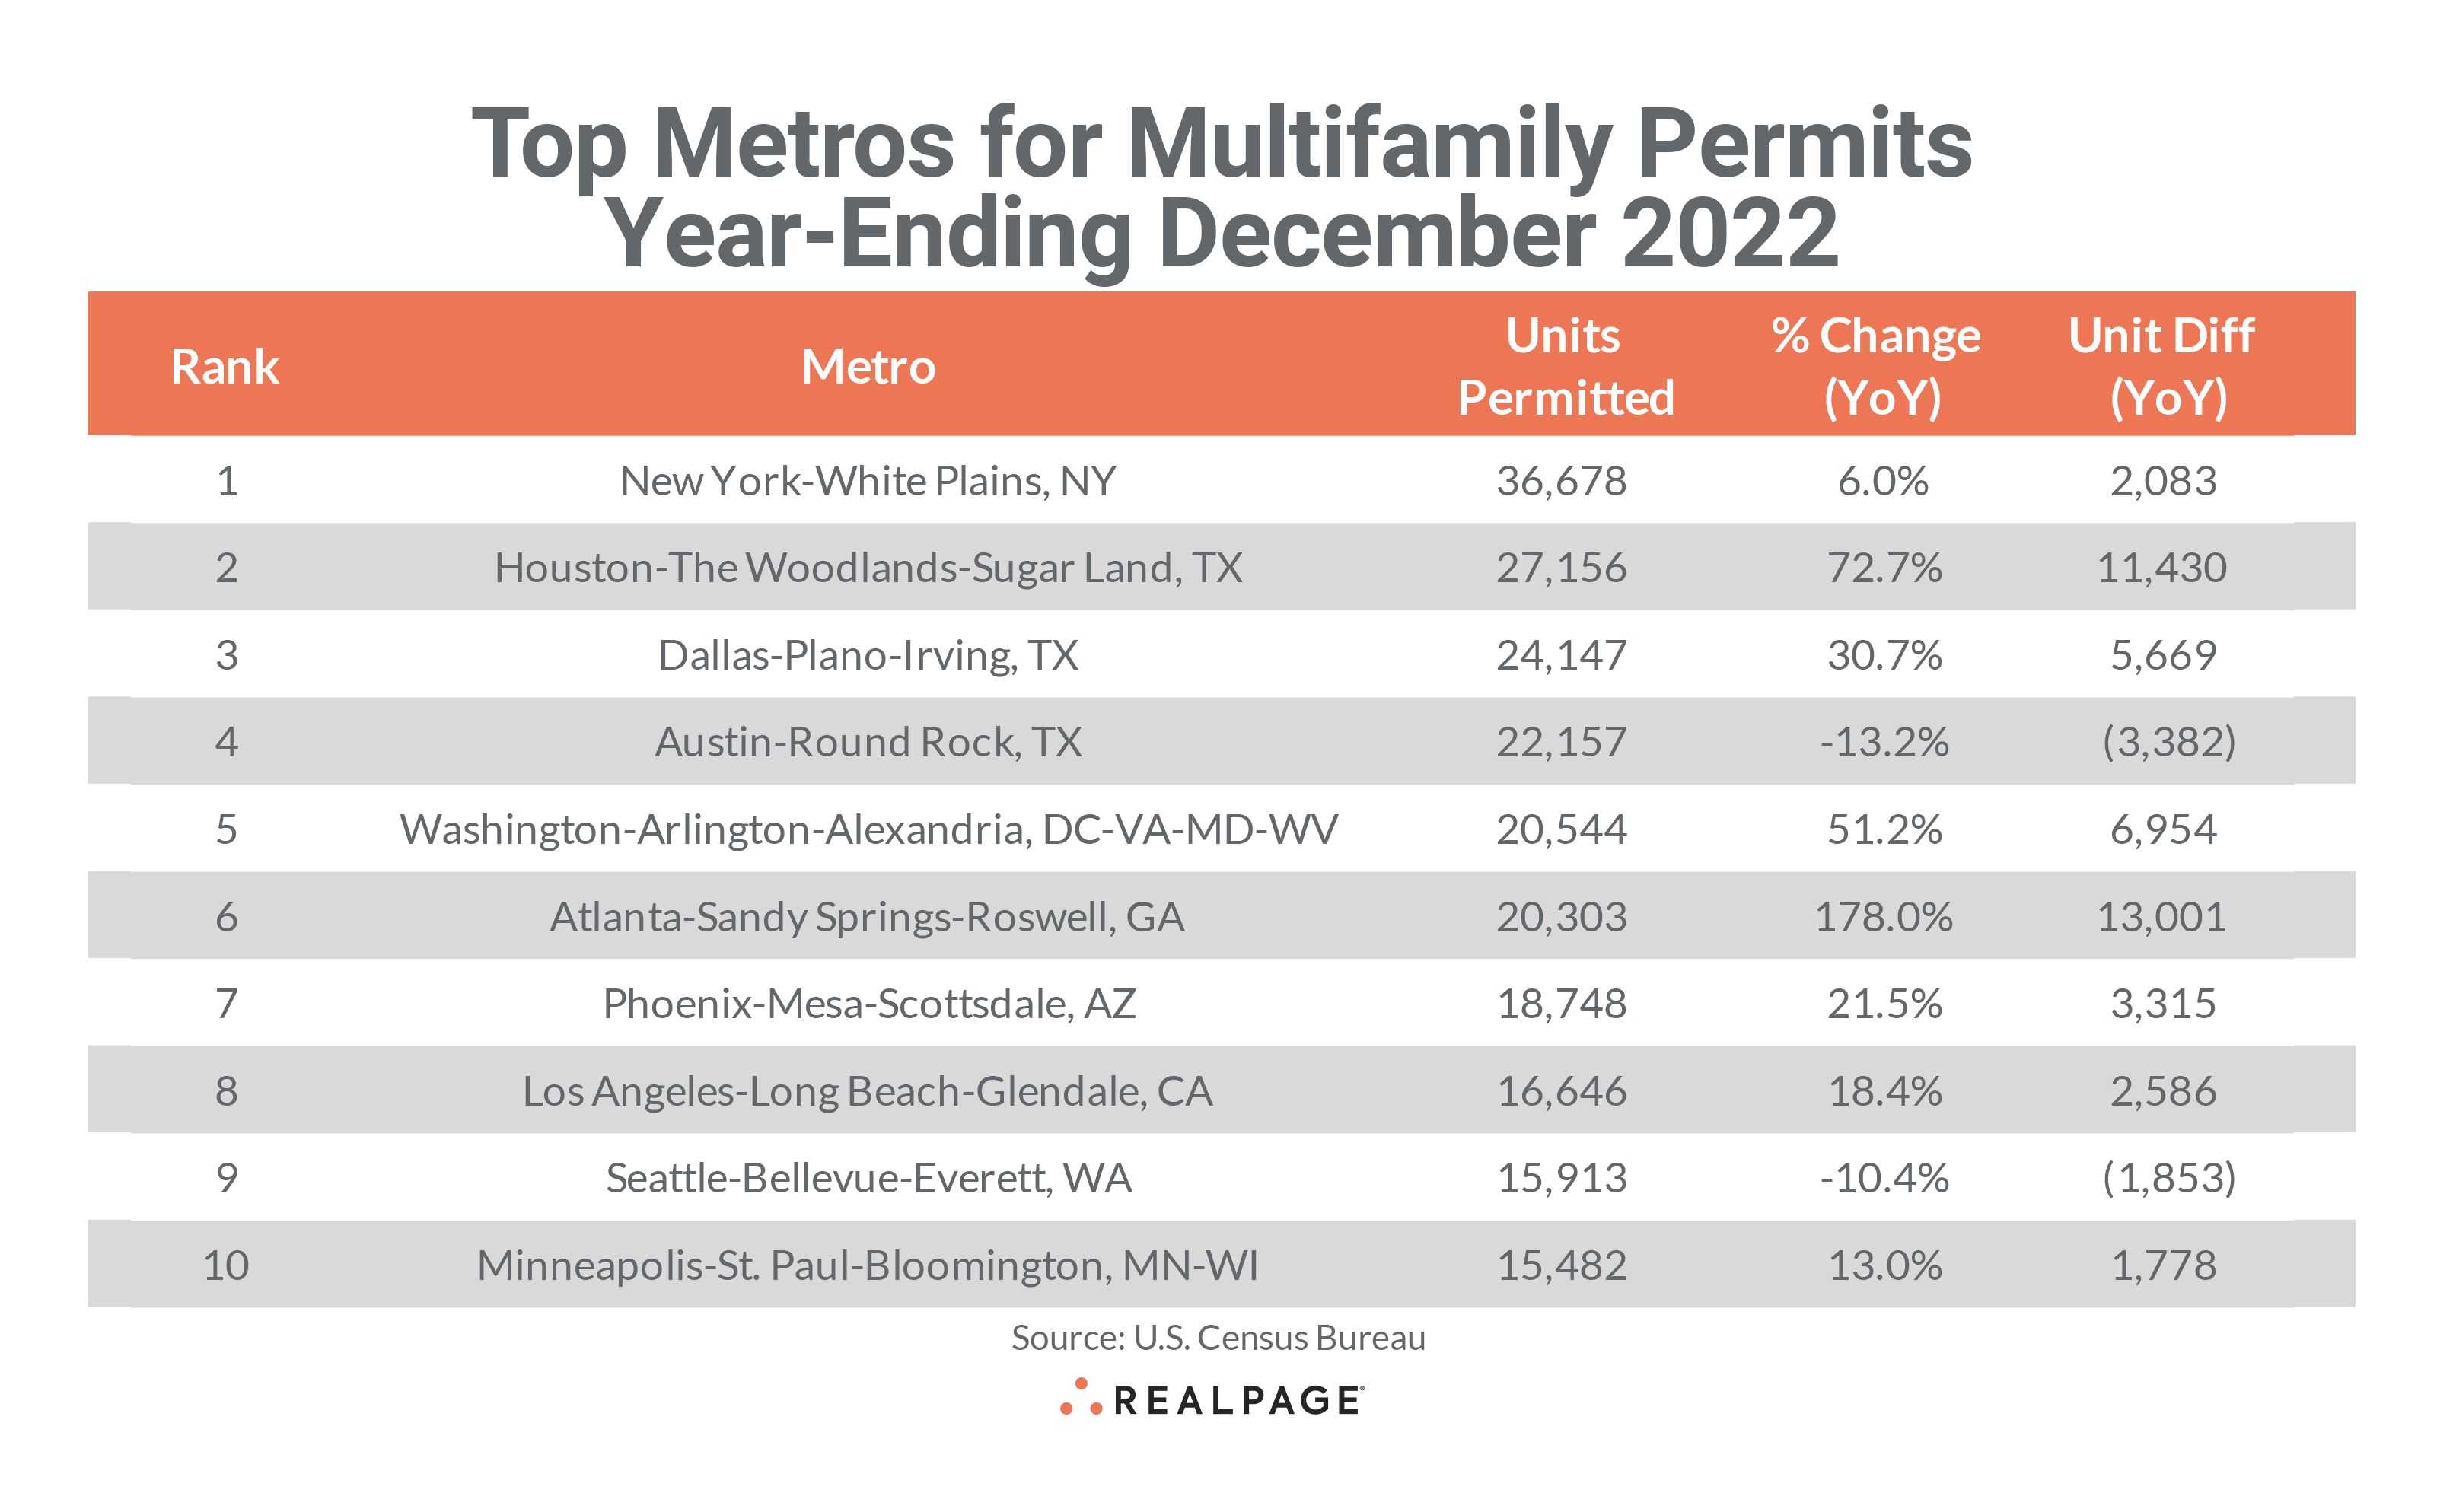
All of the top 10 markets from November’s list returned in December with only the first two remaining in order. New York continues to lead the nation in multifamily permitting, totaling 36,678 units through December, up by more than 2,000 units from last year but about 2,800 fewer than in November.
Houston returned at #2 with 27,156 units permitted, an increase of 11,430 units from last year and the second-highest annual increase after Atlanta. Dallas and Austin switched places at #3 and #4 with 24,147 and 22,157 units permitted, respectively. Dallas jumped their annual pace by almost 5,700 units from last year, while Austin slowed by almost 3,400 units.
Atlanta and Washington, DC also switched their respective places on last month’s list at #5 and #6, with DC boosting annual permitting by almost 7,000 units to 20,544 units. Meanwhile, Atlanta added 13,000 units to their annual permitting total in 2021 to reach 20,303 units at the end of 2022.
Phoenix remained in the #7 spot on the top 10 permitting list with 18,748 units permitted, about 3,300 more than last year. Los Angles moved up to #8 in December with 16,645 units permitted, pushing Seattle down to #9 with 15,913 units permitted, a decrease of 1,853 units from 2021. Minneapolis-St. Paul returned in the #10 spot, permitting 15,482 units in 2020, an increase of almost 1,800 units.
Despite a national trend of slowing multifamily permitting, eight of the top 10 multifamily permitting markets increased their annual totals from the year before and they were generally large increases, ranging from a low of 1,778 units in Minneapolis to 13,001 additional units in Atlanta. Five of the top 10 markets increased multifamily permitting by at least 3,300 units over last year’s pace. Only Austin and Seattle had modest decreases from last year.
Other markets outside of the top 10 that saw significant year-over-year increases in annual multifamily permitting in the year-ending December were Tampa (+7,858 units), San Antonio (+5,382 units), Jacksonville (+2,741 units), and Richmond (+2,564 units).
Significant slowing in annual multifamily permitting occurred in Philadelphia (-21,130 units), Nashville (-10,809 units), Denver (-3,362 units), Madison (-1,514 units), and Fort Lauderdale (-1,508 units).
The annual total of multifamily permits issued in the top 10 metros – 217,774 – was about 24% more than the 176,193 issued in the previous 12 months. The total number of permits issued in the top 10 metros was almost equal to the number of permits issued for the #11 through #41 ranked metros (an increase of 3 from last month).
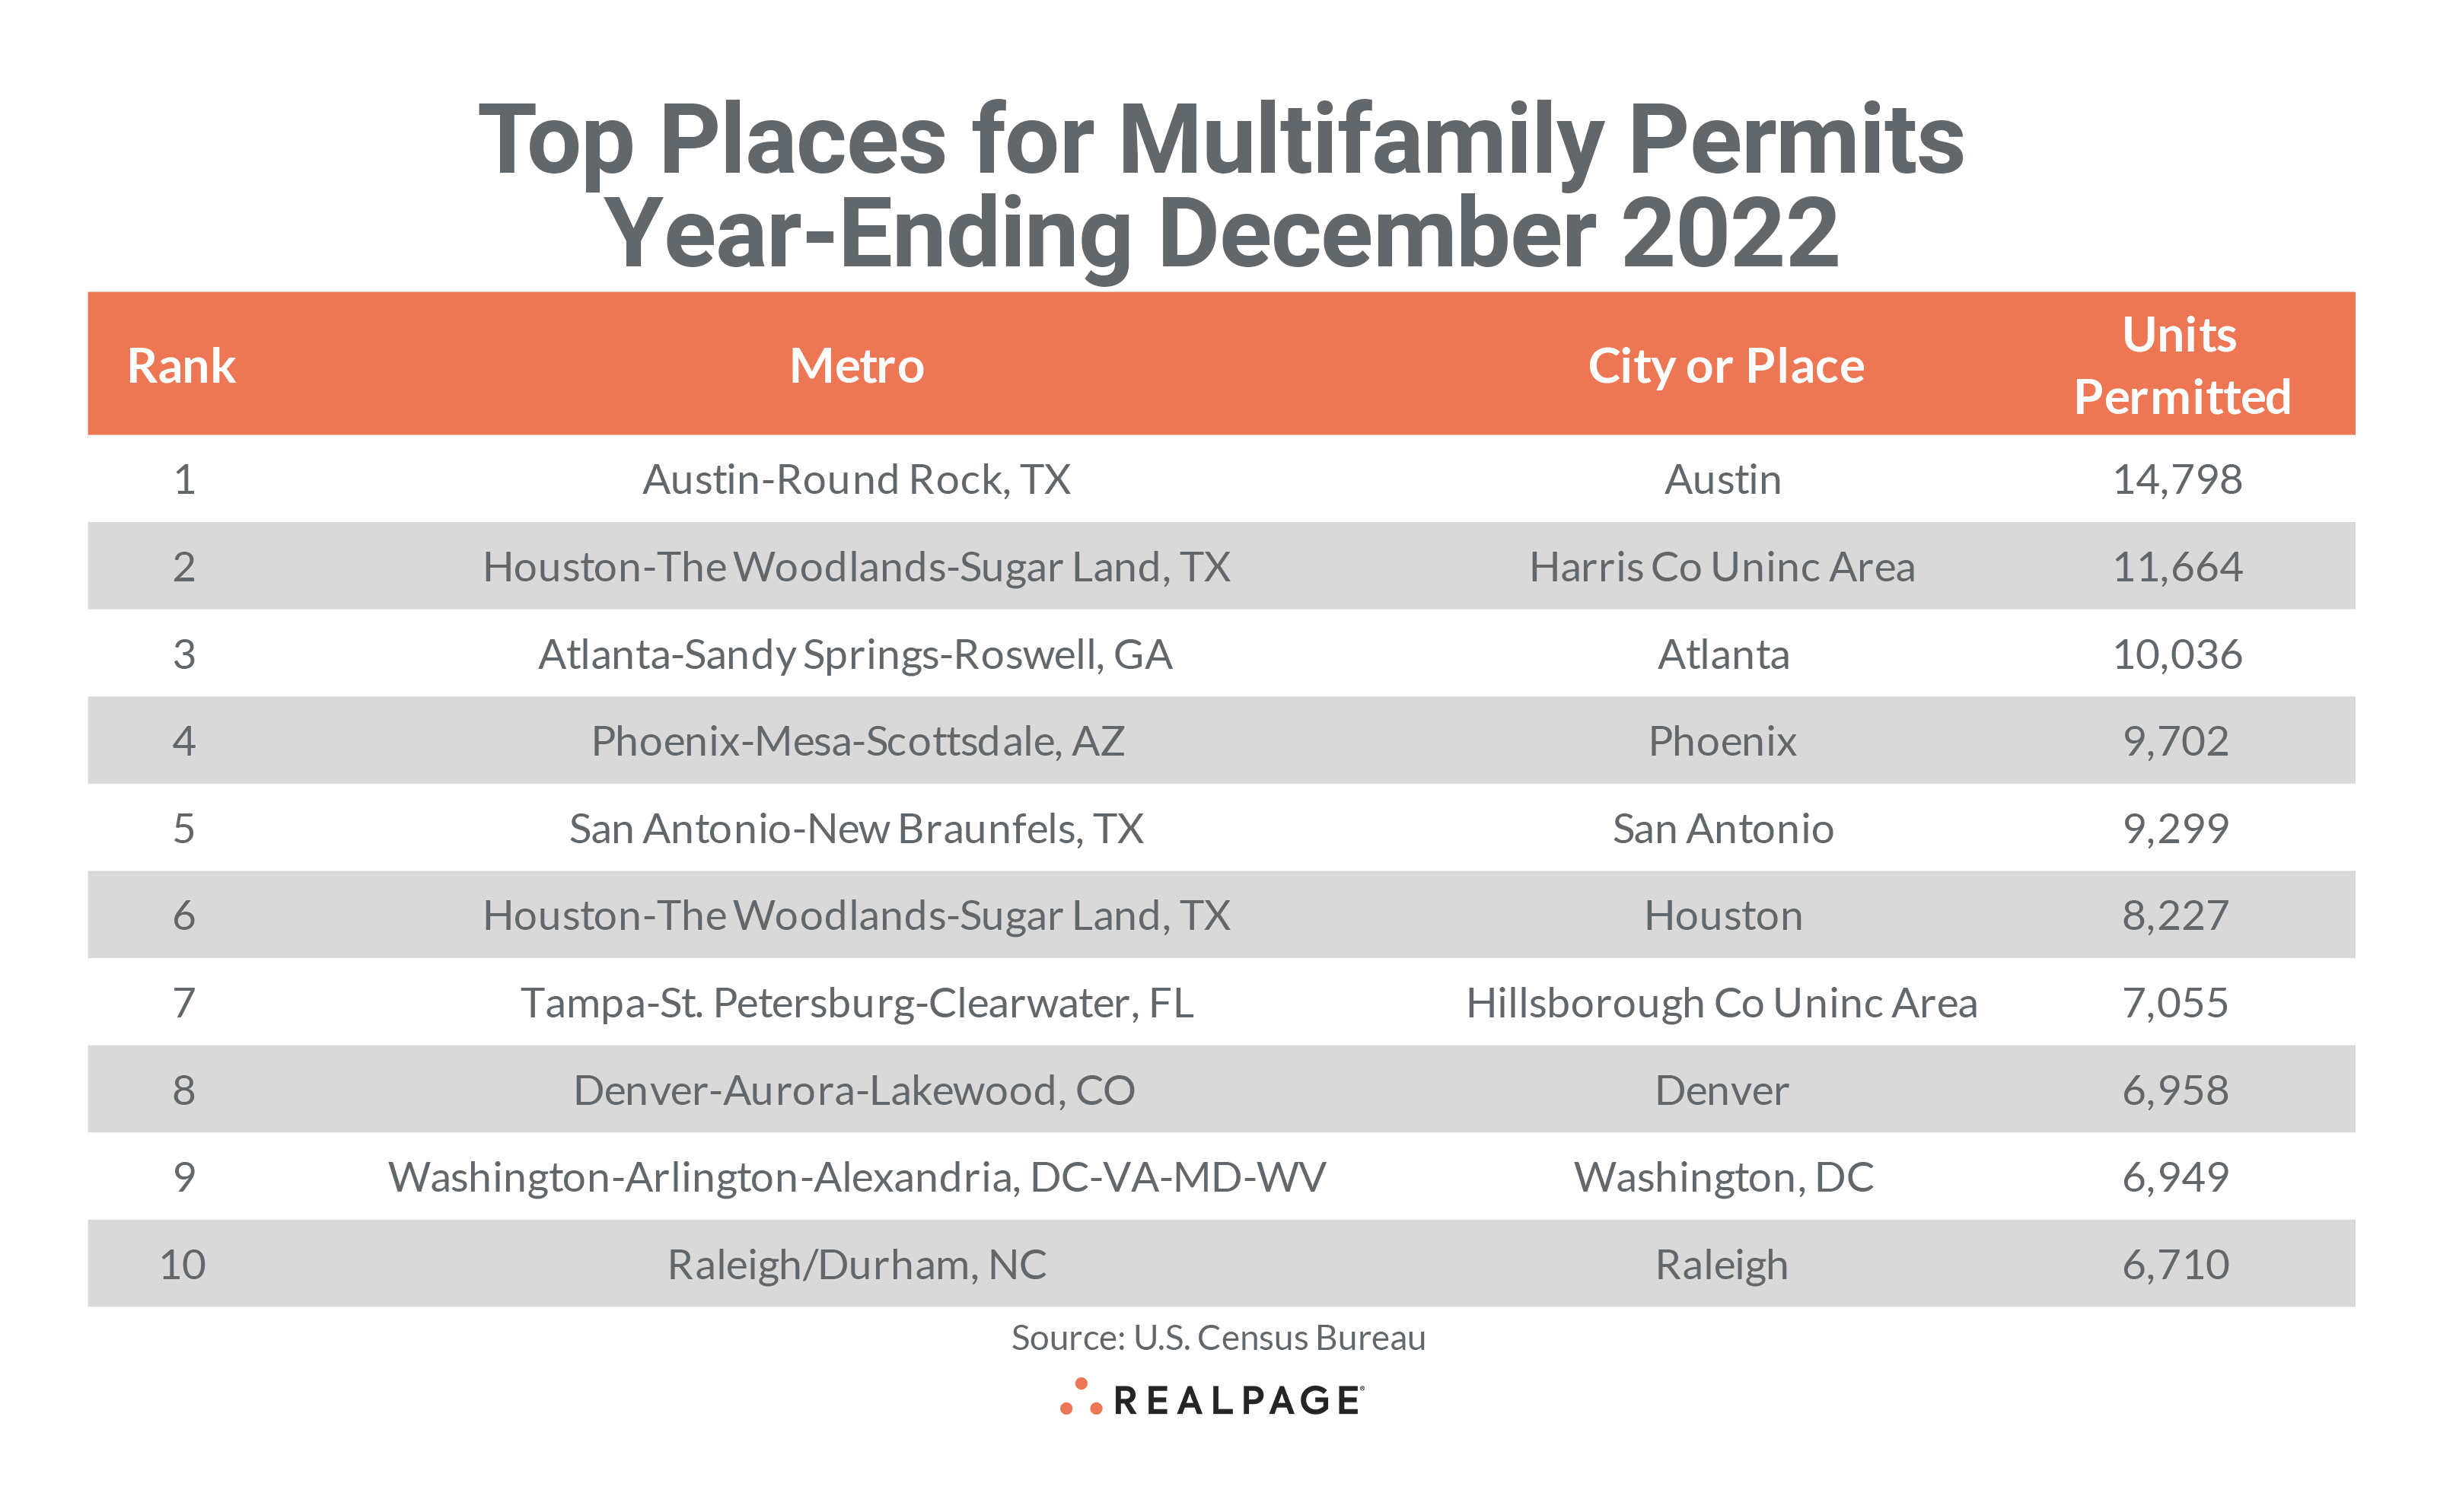
Below the metro level, nine of last month’s top 10 permit-issuing places returned to this month’s list with three remaining in the same place and several others changing places. The list of top individual permitting places (cities, towns, boroughs, and unincorporated counties) generally include the principal city of some of the most active metro areas.
The city of Austin remained in the top spot with an impressive permitting total of 14,798 units. The unincorporated portion of Houston’s Harris County remained at #2 with 11,664 units permitted, while the city of Atlanta was close behind with 10,036 units permitted for the year.
The city of Phoenix moved up three spots to #4 with 9,702 units permitted and the city of San Antonio slipped one spot but permitted 9,299 units for the year. The City of Houston also slipped a spot but still managed to permit a total of 8,227 units in 2022.
Unincorporated Hillsborough County (Tampa) moved up to #7 with 7,055 units permitted and the city of Denver retained the #8 spot with a total of 6,958 units permitted for the year-ending December 2022. The city of Washington (District of Columbia) moved onto the top 10 permitting place list at #9 with 6,949 units permitted, while the city of Raleigh retained the #10 spot, permitting 6,710 units.
The city of Philadelphia fell off the top 10 place list from the #3 spot in November. Additionally, the cities of Austin, Houston, and Denver and Unincorporated Harris County were the only top 10 permitting places on December’s list to see a decline in permitting from November’s annual total.


