Higher interest rates, a stacked pipeline, and difficulty in securing funding has seen multifamily development slow to more sustainable levels.
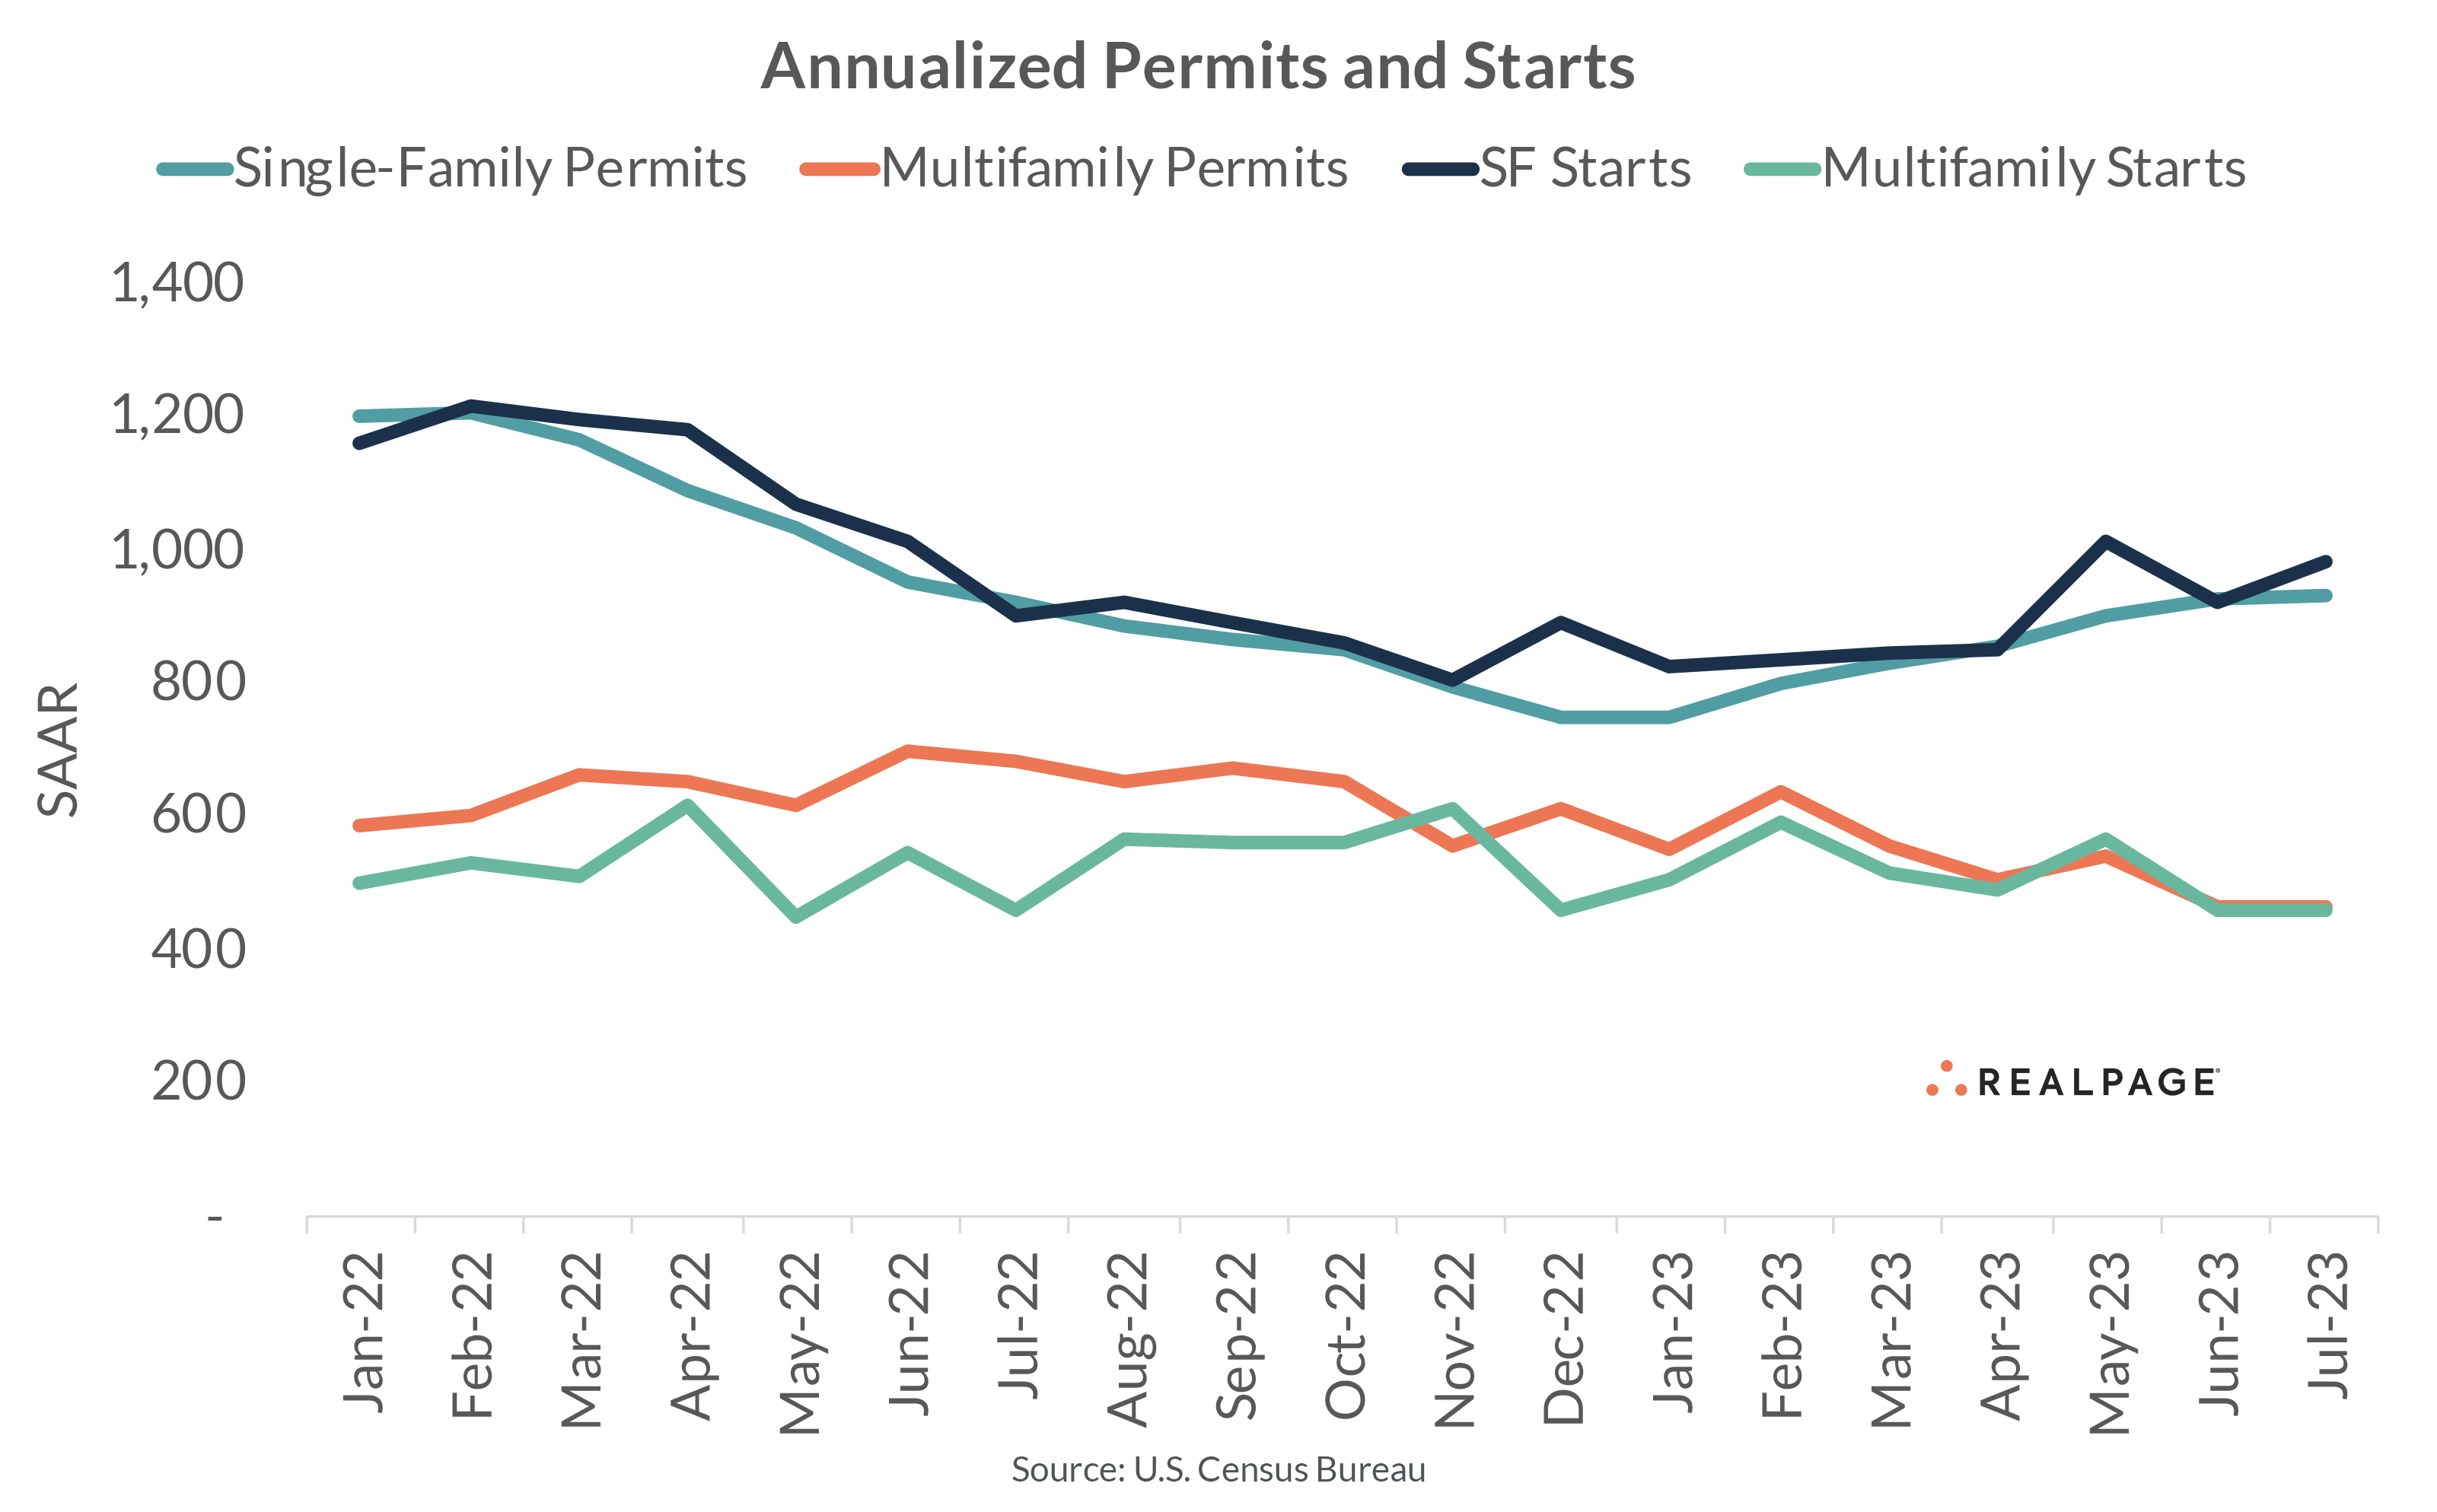
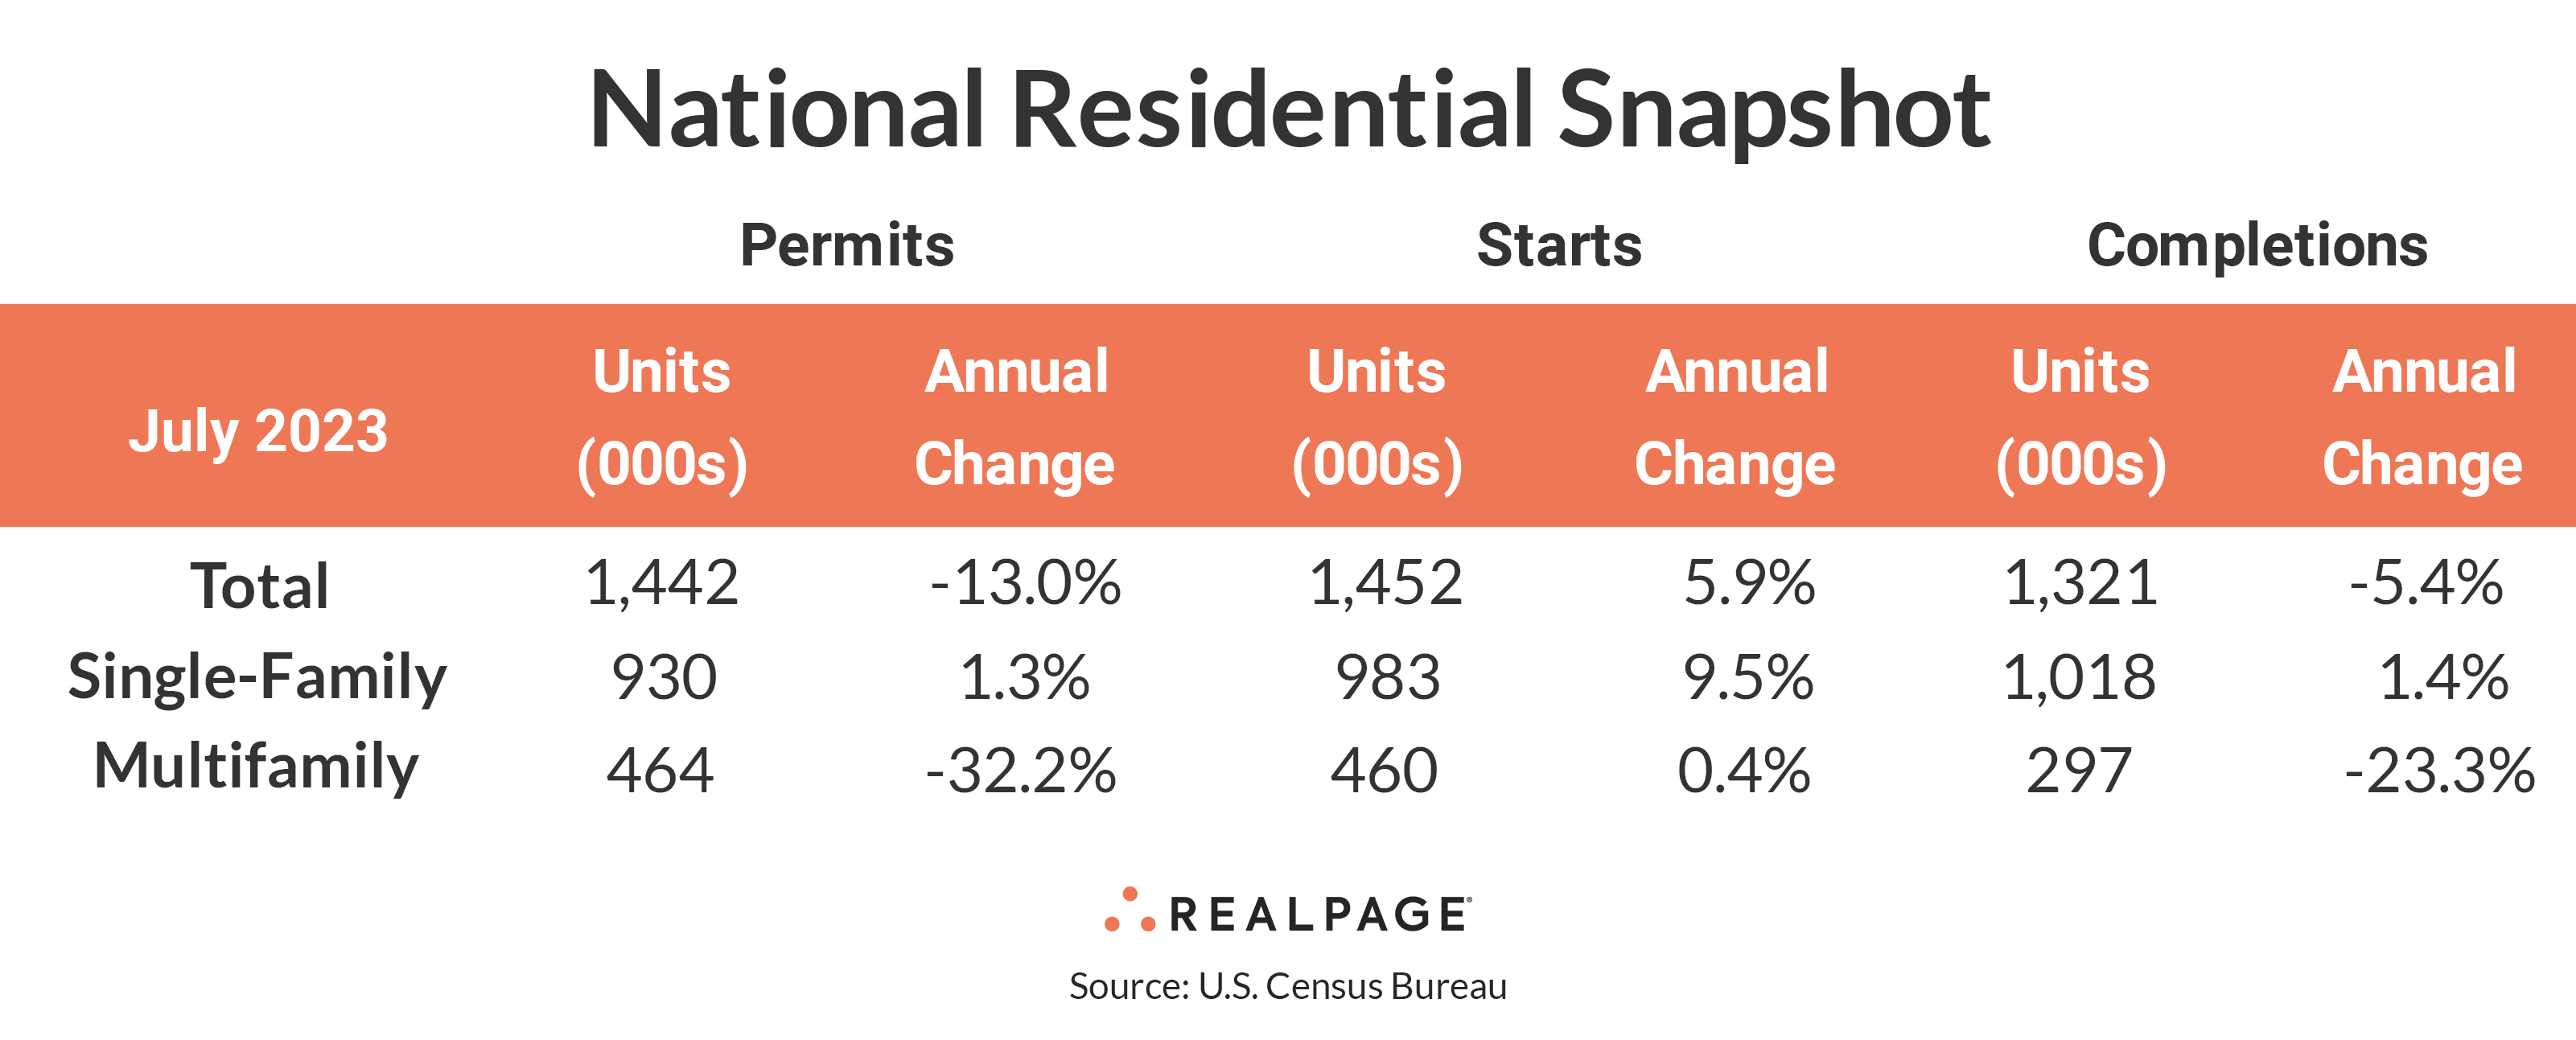
According to the latest release from the Census Bureau, the seasonally adjusted annual rate (SAAR) for multifamily permitting in July 2023 fell 32.2% from one year ago as the current 464,000 unit permitting rate was 220,000 units fewer than July 2022’s rate. July’s annual rate was almost unchanged from June’s and is the lowest since October 2020.
The more volatile multifamily starts rate almost matched that of permitting with July’s SAAR of 460,000 units also equaling that of June’s starts rate. The annual rate of multifamily starts was also about the same as one year ago.
Meanwhile, single-family permitting and starts are edging back up after bottoming at the beginning of the year. At 930,000 units, the SAAR for single-family permitting increased slightly (0.6%) from June and was just 1.3% greater than last year but was 24.3% higher than in January.
Similarly, single-family starts were at an annual rate of 983,000 units in July, up 6.7% from June and 9.5% from last July. The starts rate improved almost 20% from its low point earlier in the year. The decline in multifamily permitting brought the SAAR of total residential permitting down 13% from last year to 1.442 million units, while the rate of total residential starts increased 5.9% from last year to 1.452 million units on the strength of single-family starts.
Multifamily completions plunged 38.8% from June to 297,000 units and are down 23.3% from last July’s completion rate. Single-family completions were up 1.3% in July with the annual rate reaching 1.018 million units, up 1.4% for the year.
The number of multifamily units authorized but not started decreased only 0.7% for the month to 133,000 units, down 10.7% from one year ago. The ratio of multifamily units not started to annualized permits moved to 28.7% from about 22% last July. Single-family units authorized but not started were virtually unchanged at 140,000 units from 141,000 units in June, down 5.4% from last year.
With slowing multifamily permitting, the number of multifamily units under construction (986,000 units) was only slightly higher than last month’s figure, but it continues to exceed that of single-family (678,000 units).
Compared to one year ago, the annual rate for multifamily permitting decreased in all four Census regions, with the deepest decrease in the small Northeast region (down 42.7% to 47,000 units). The South region saw multifamily permitting slow by 34.6% to 233,000 units, while the Midwest region’s permitting was down 29.9% to 54,000 units. The West region saw a 23.1% decrease to 130,000 units in July. Compared to the previous month, permitting was down in only the Midwest region.
Multifamily starts were up in only the South region from last year, with a solid increase of 28.8% to 244,000 units. Starts were down by half (52.6%) in the Northeast region to 43,000 units, and by 4.8% in the Midwest to 50,000 units. The West region decreased by just 2% to 124,000 units. Compared to June’s SAAR, starts were down in the West, up in the Northeast and Midwest, and essentially unchanged in the South.
Metro-Level Multifamily Permitting
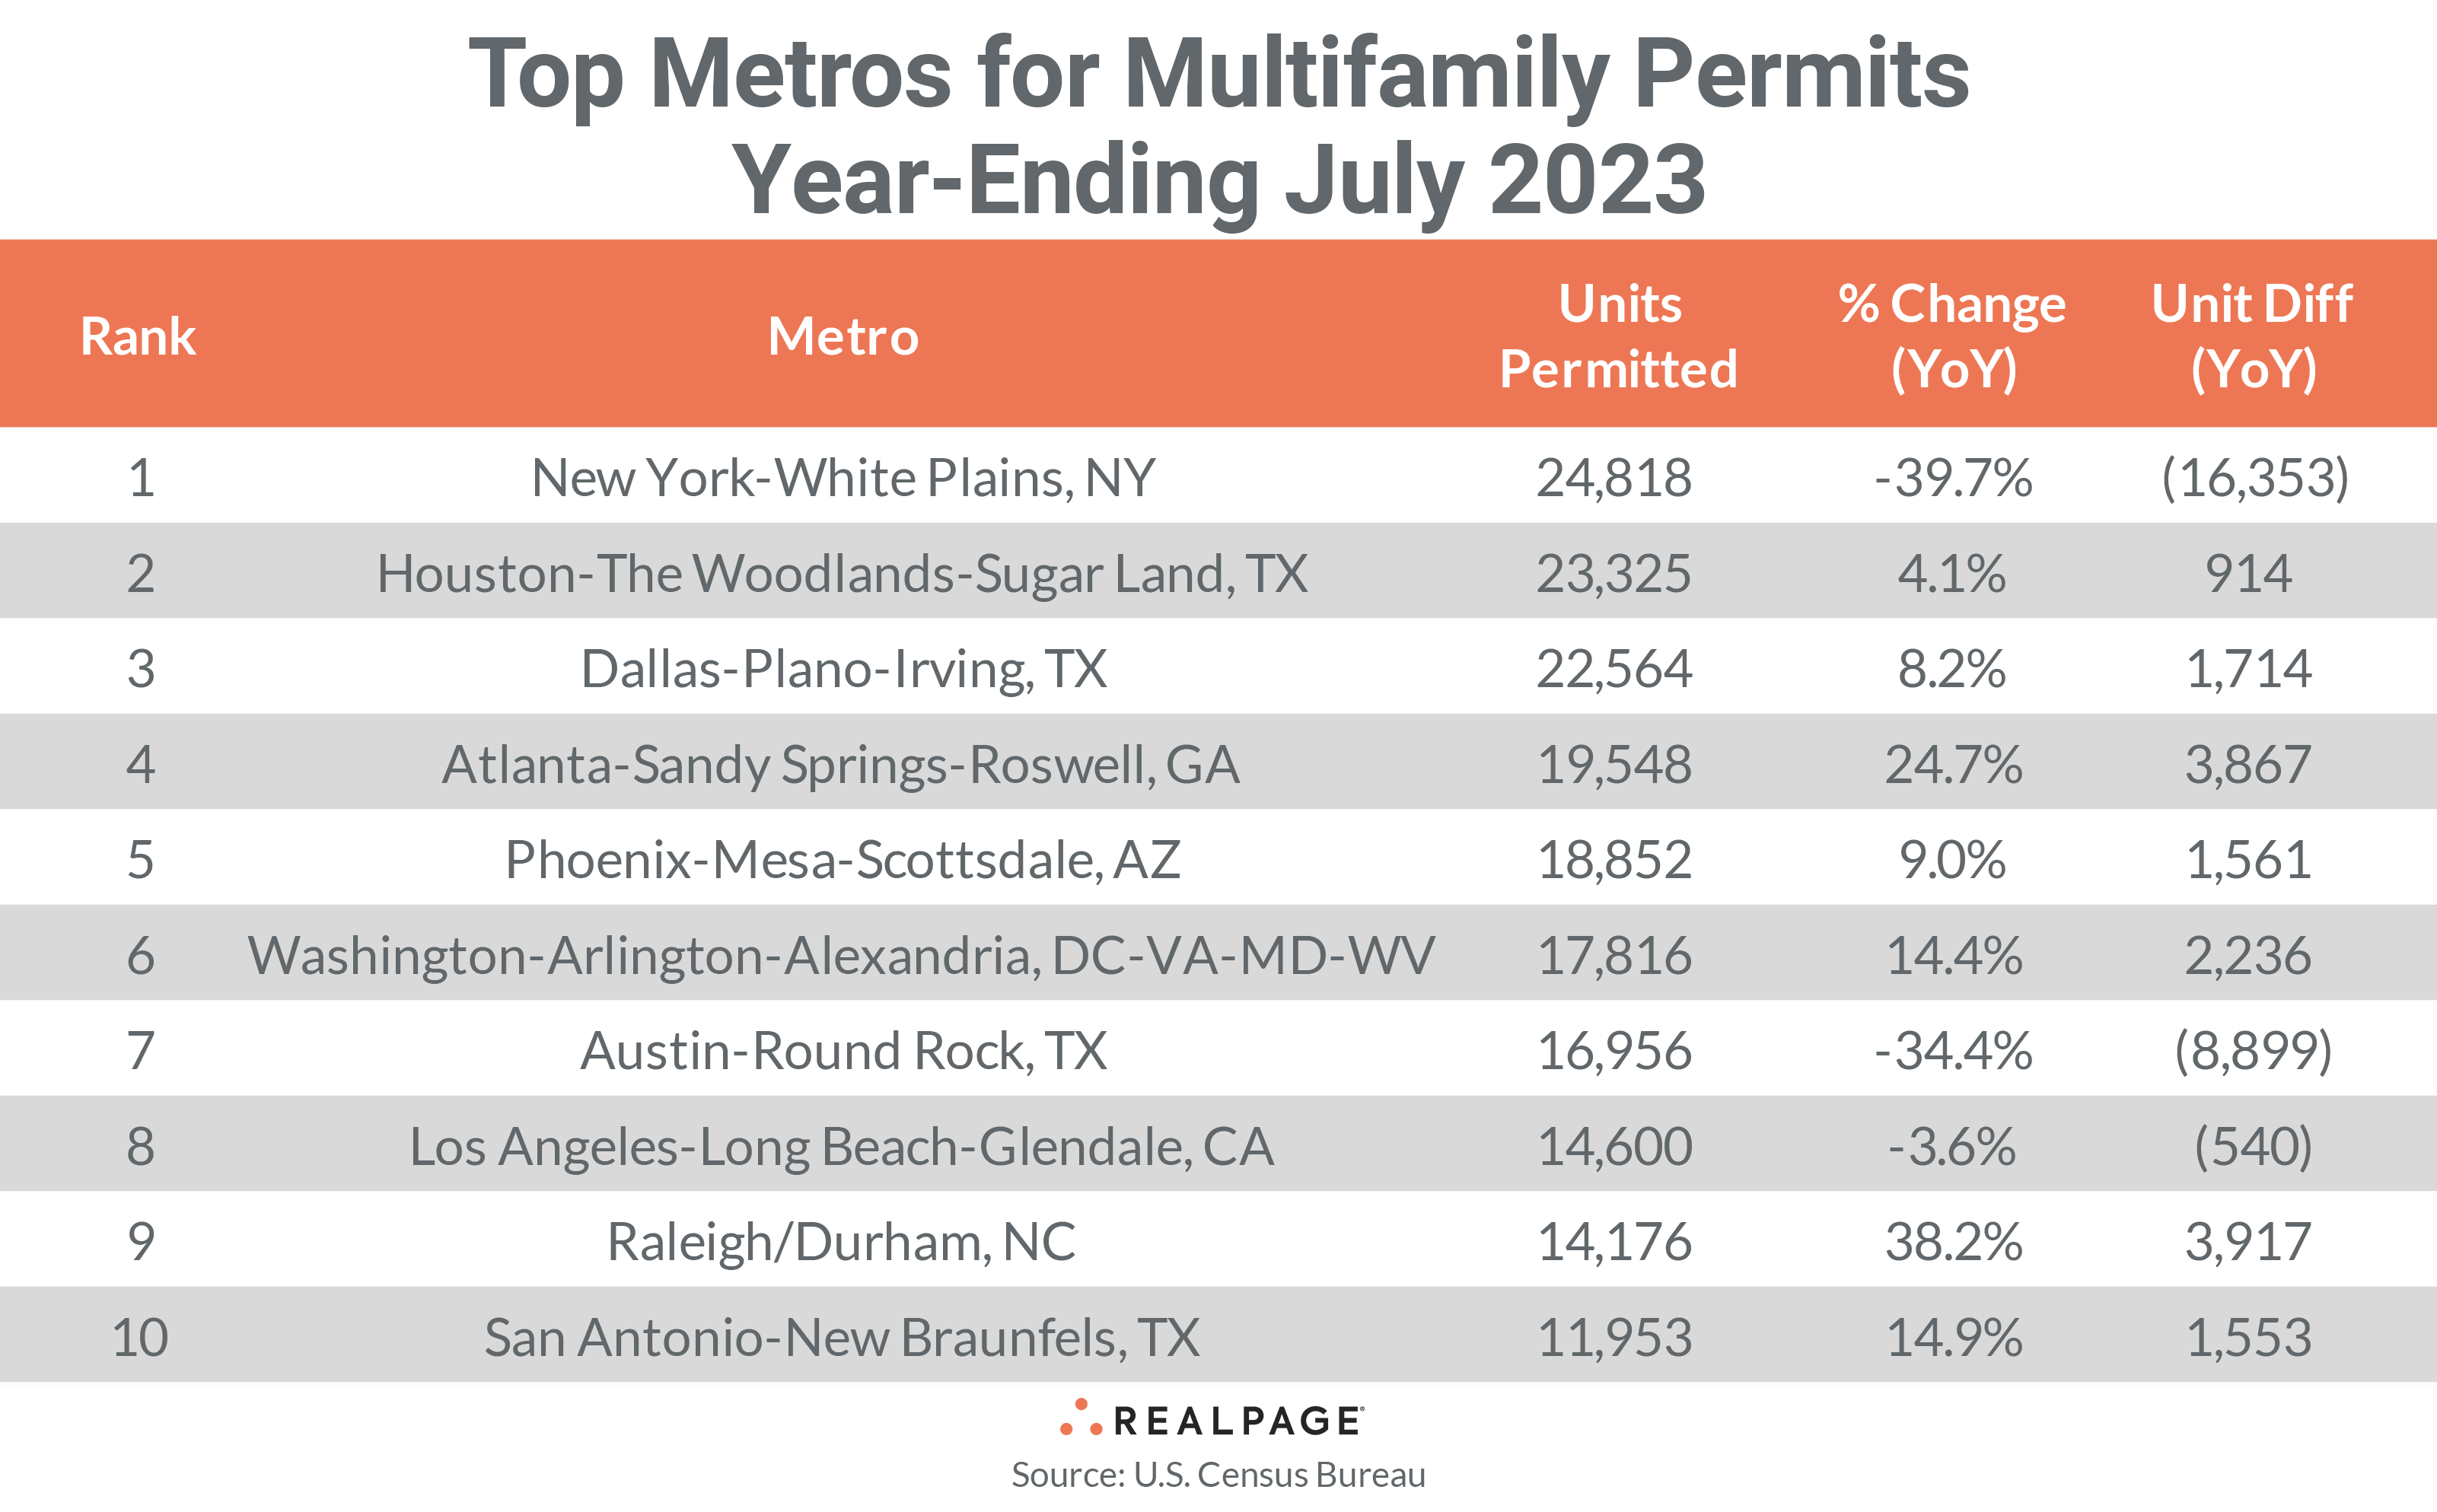
All the top 10 markets from June’s list returned in July (and in the same order). As it usually does, New York continues to lead the nation in multifamily permitting, totaling 24,818 units through July, down by more than 16,300 units from last year and about 1,800 less than in June. New York’s lead over the #2 market has dwindled to just 1,493 units from a 20,000+ unit advantage in early 2022.
Houston returned at #2 with 23,325 units permitted, an increase of 914 units from last year but 1,856 units fewer than last month. Dallas retained the #3 spot with 22,564 units permitted in the past 12 months, down 1,419 units from June’s total but 1,714 units greater than last year. Atlanta returned in the #4 spot with 19,548 units permitted, down 1,716 units from June’s 12-month total but 3,867 units more than last year.
Phoenix came in at #5 on the list, permitting a total of 18,852 units for the year, for an increase of 1,561 units from last July and a decrease of only 109 units from June. Washington, DC remained at #6 with 17,816 units permitted for the year, up 2,236 from last July and 312 units more than in June. Austin returned at #7 permitting 16,956 units for the year, up 208 units from June but almost 8,900 units fewer than last July.
Los Angeles retained the #8 spot with 14,600 units permitted, down 540 units from last July but 290 units more than last month’s total. Raleigh/Durham stayed in the #9 spot this month with a total of 14,176 units for the year-ending July, slightly higher than last month’s level but 3,917 units more than one year ago. San Antonio returned at #10 with 11,953 units permitted for the year, up by 1,553 from last July but down 1,295 units from last month.
Seven of the top 10 multifamily permitting markets increased their annual totals from the year before but the size of the increases has lowered to range from a low of 914 units in Houston to 3,917 additional units in Raleigh/Durham. Two of the three top 10 markets with annual decreases were significantly lower, with a 8,899 unit decrease in Austin and 16,353 unit decrease in New York.
Other markets outside of the top 10 that saw significant year-over-year increases in annual multifamily permitting in the year-ending July were Tampa (+3,224 units), Riverside (+3,082 units), Crestview-Fort Walton Beach-Destin, FL (+2,569 units) and Anaheim (+1,676 units).
In addition to Austin and New York, significant slowing in annual multifamily permitting occurred in Philadelphia (-14,581 units), Seattle (-10,002 units), Denver (-5,026 units), Minneapolis-St. Paul (-4,756 units), Fort Worth (-3,825 units) and Boston (-3,156 units).
The annual total of multifamily permits issued in the top 10 metros – 184,608 – was about 5% less than the 194,638 issued in the previous 12 months and down about 4% from last month. The total number of permits issued in the top 10 metros was almost equal to the number of permits issued for the #11 through #36 ranked metros.
Below the metro level, all of last month’s top 10 permit-issuing places returned to this month’s list with only three remaining in the same place and the rest changing places. The list of top individual permitting places (cities, towns, boroughs, and unincorporated counties) generally include the principal city of some of the most active metro areas.
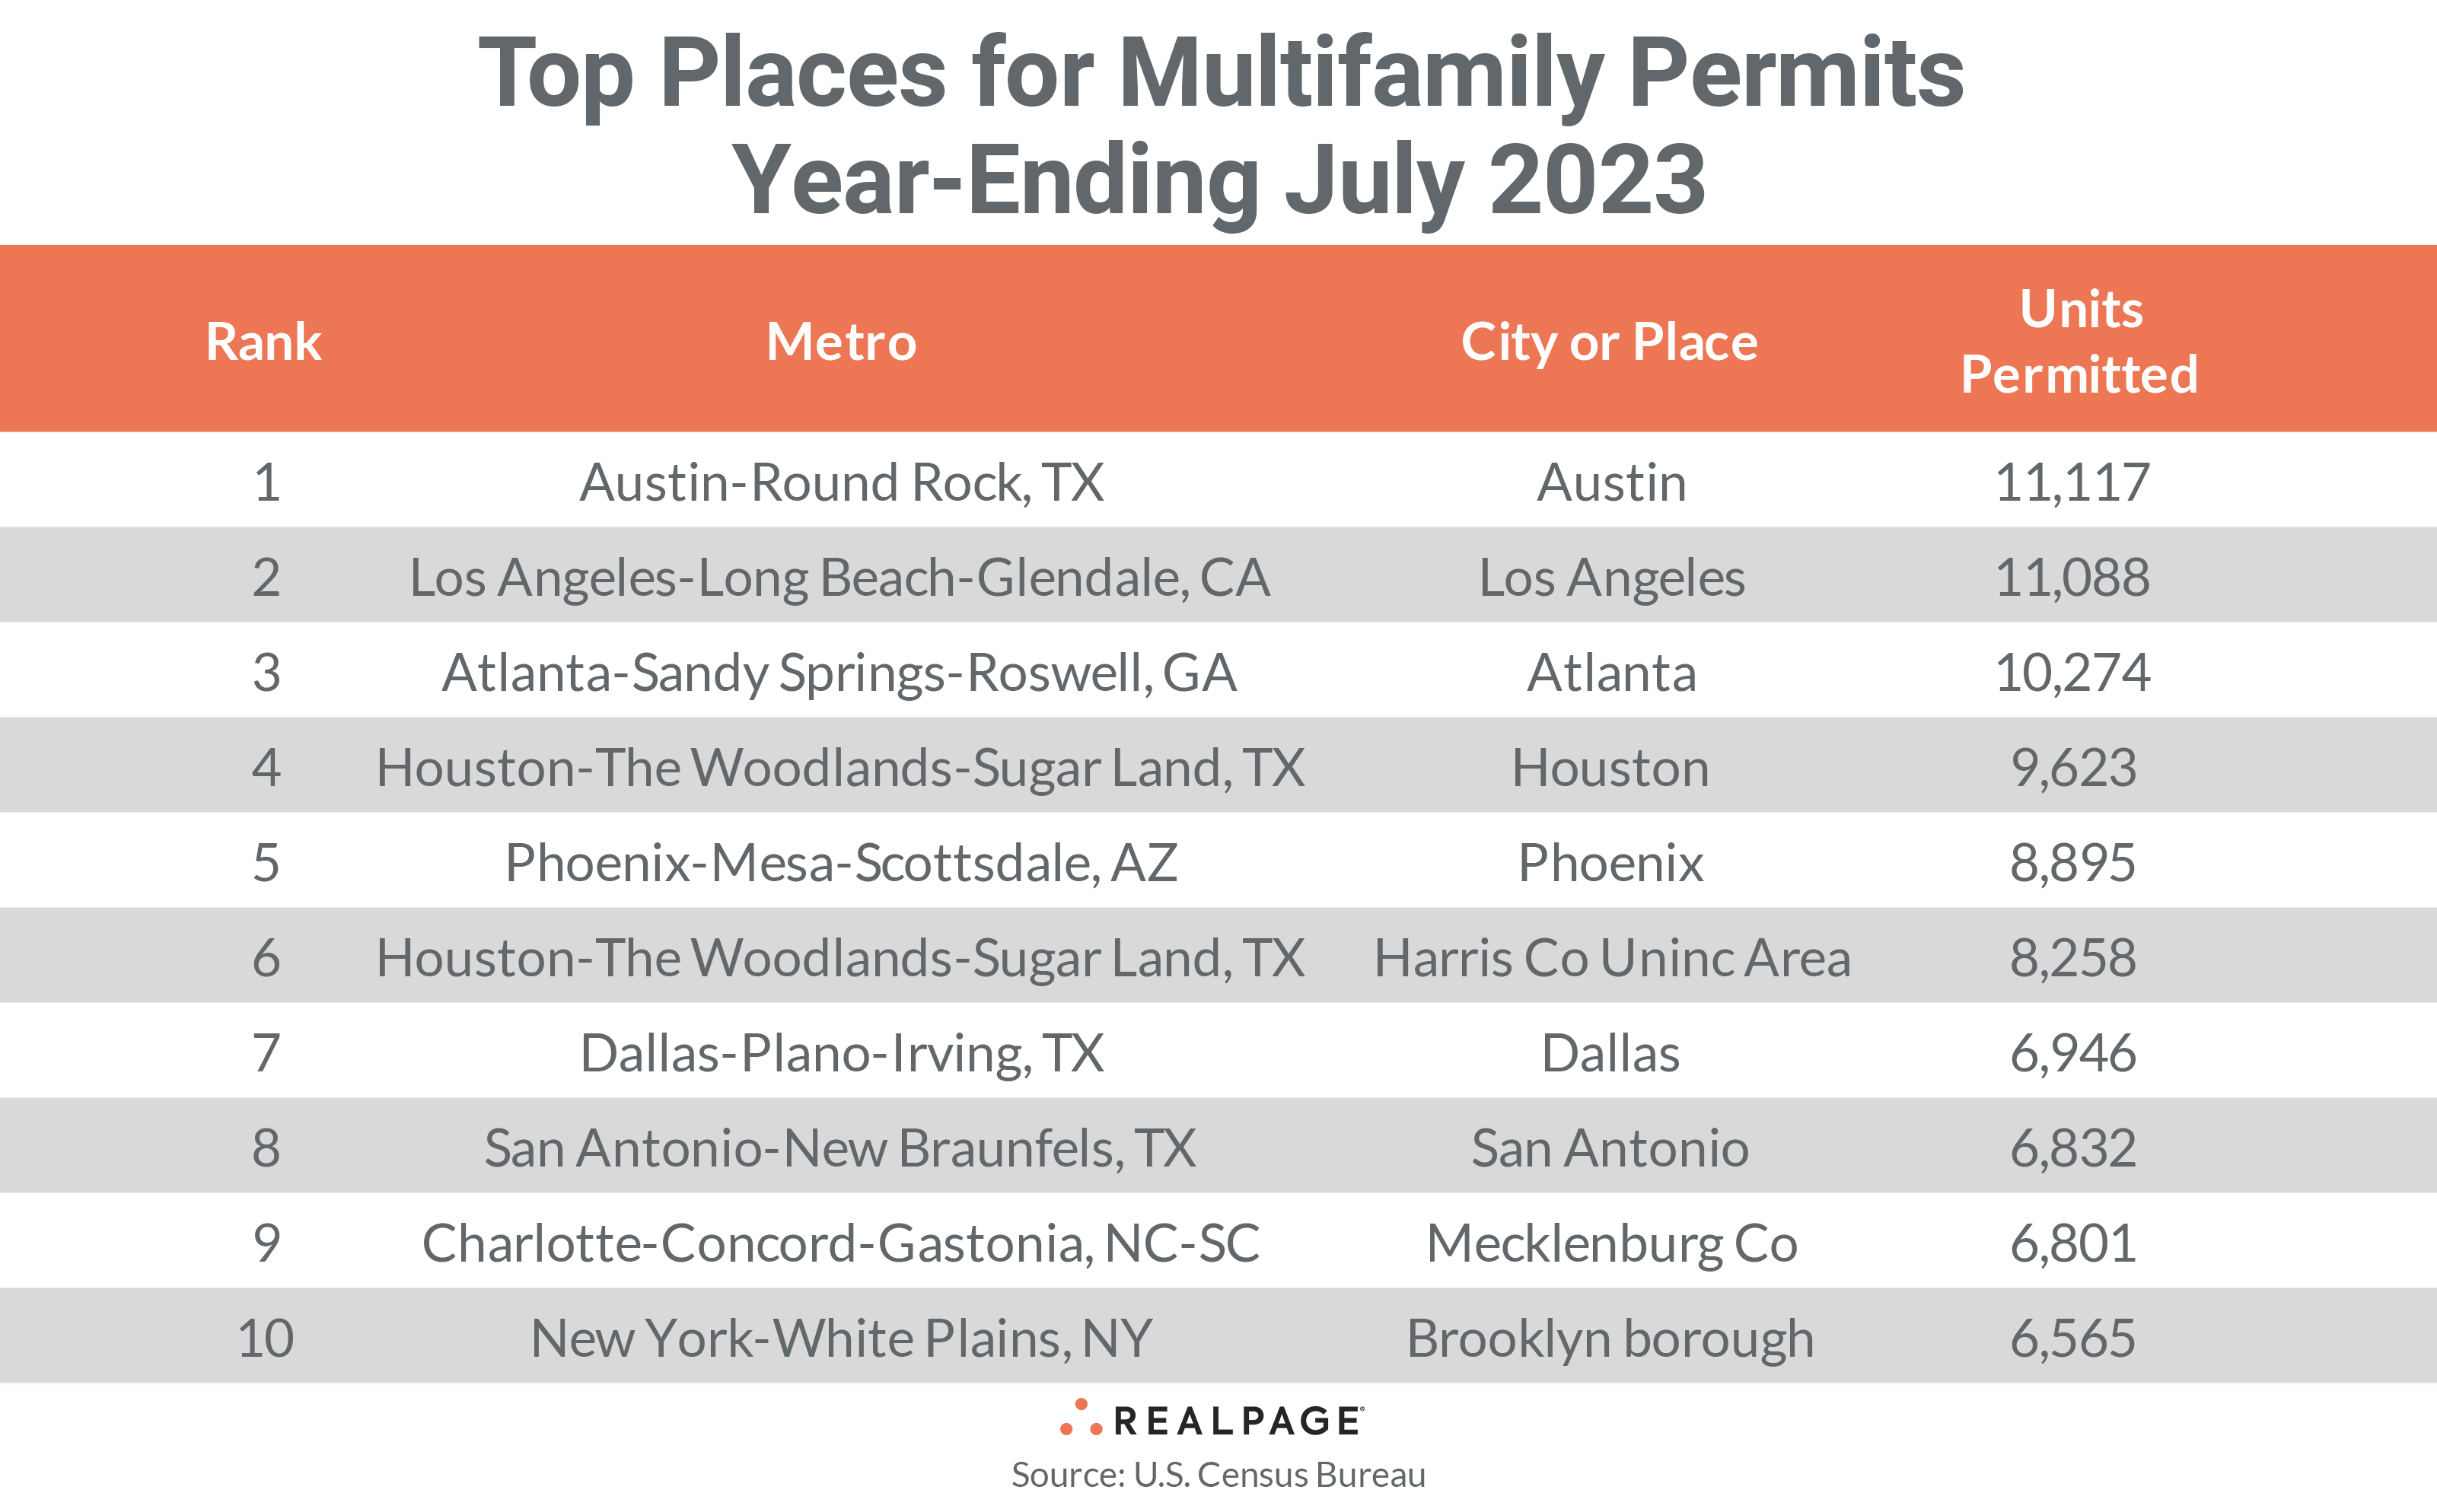
In July, the city of Austin moved up two spots to take the #1 position with 11,117 units permitted, 402 more units than in June. The cities of Los Angeles and Atlanta slipped one spot each to #2 and #3 with 11,088 units permitted in Los Angeles and 10,274 units permitted in Atlanta, little changed from last month in Los Angeles but a decline of 518 units in Atlanta.
The cities of Houston and Phoenix and Unincorporated Harris County (Houston) remained in the #4 through #6 spots in July with about 8,300 to 9,600 units permitted apiece. All three were down from 313 to 976 units permitted from June’s annual totals.
The cities of Dallas and San Antonio switched places this month at #7 and #8 with Dallas permitting 6,946 units to San Antonio’s 6,832 units. However, both permitted an average of about 700 fewer units than in June.
While essentially unchanged from last month, Mecklenburg County (Charlotte) moved up one spot to #9 with 6,801 units permitted, displacing the borough of Brooklyn to the #10 spot this month. Brooklyn had an annual total of 6,565 units permitted through July, which was 316 units less than June’s annual total.
The cities of Austin and Los Angeles and Mecklenburg County were the only top 10 permitting places on July’s list to see an increase in permitting from June’s annual total. The cities of Phoenix and San Antonio and Unincorporated Harris County decreased their annual permitting by about 700 or more units from last month’s annual totals.


