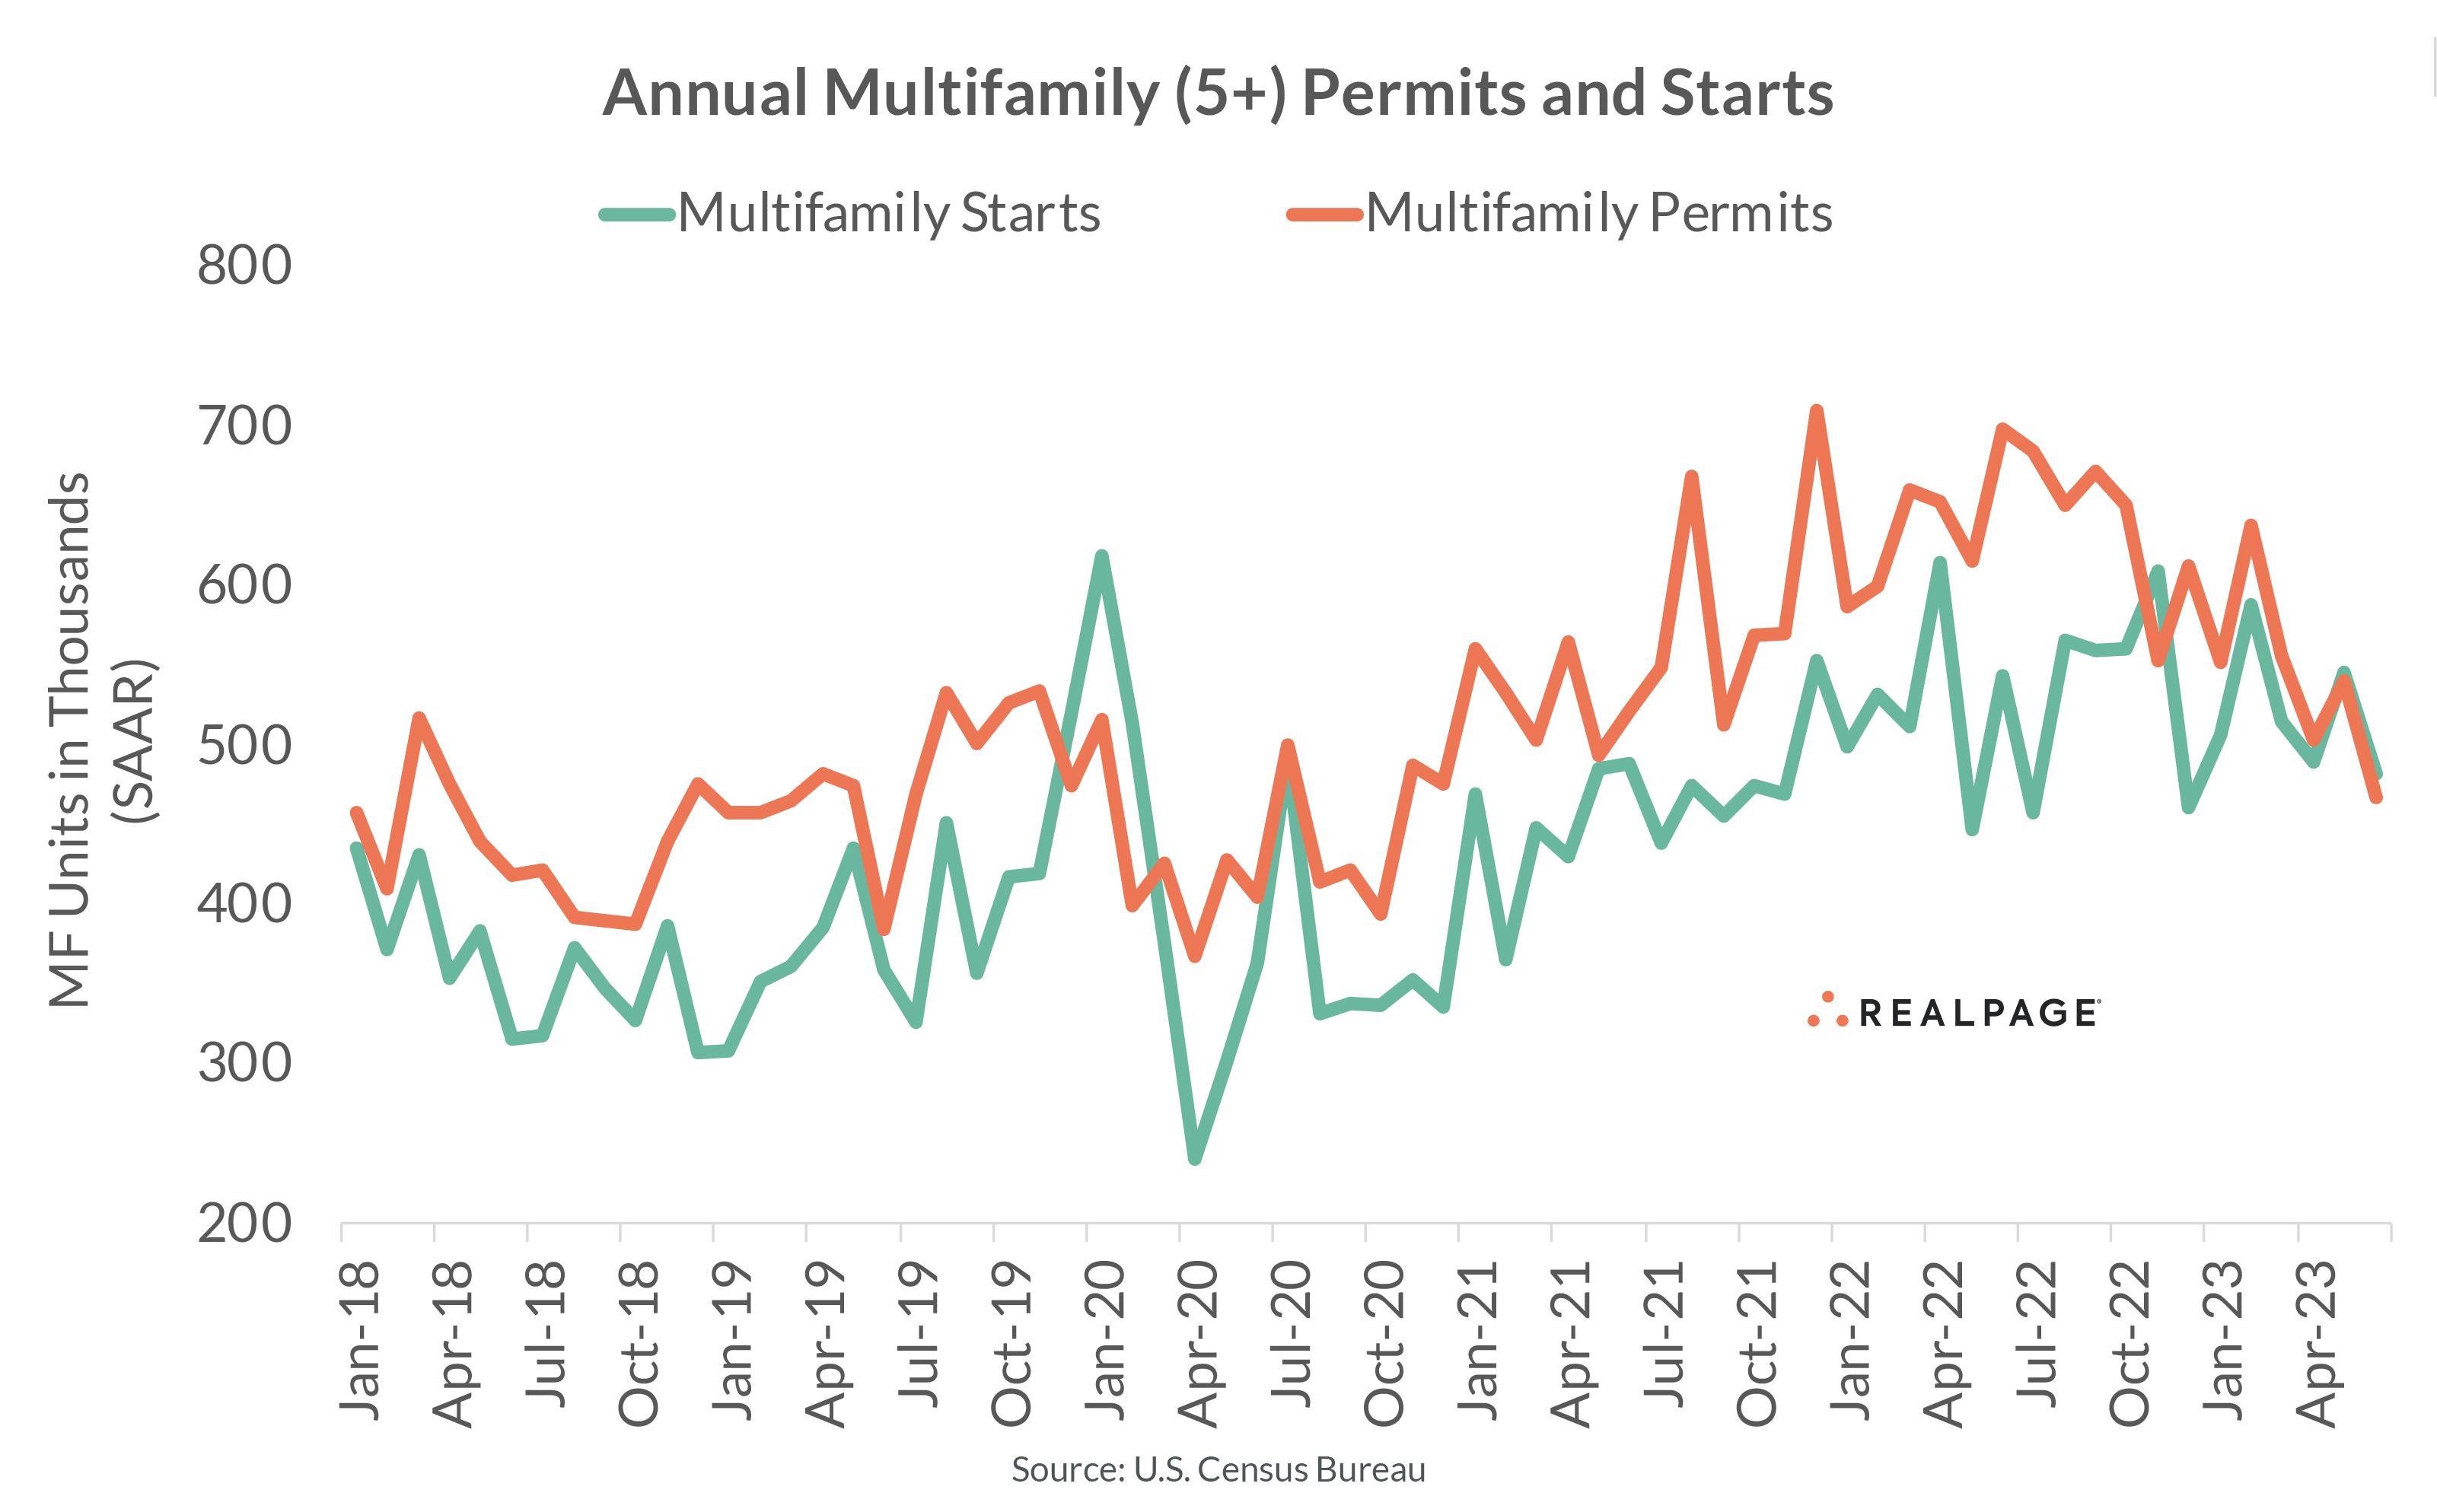
The seasonally adjusted annual rates for both multifamily permitting and starts declined month-over-month and year-over-year as of June. According to the latest release from the U.S. Census Bureau, June’s multifamily permitting rate slowed 13.5% from May to 467,000 units, down 33.1% from last June.
As we suspected, multifamily starts were much lower than initially reported last month. The rate for starts in May was revised down from 624,000 units to 545,000 units, a downward revision of -14.5%. June’s pace for multifamily starts of 482,000 units was still 11.6% below May’s revised rate and 11.3% below last June. We discussed the sampling and survey issues for starts last month.
Another indication that the annual rate for multifamily starts may be overestimated is the disappearance of the typical gap between permits and starts in the past few months. Historically, there are usually about 56,000 more units permitted than started when comparing the rates each month. From January 2018 to October 2022, the difference was about 85,000 units but that fell to an average of 28,000 units since. Granted, there is often a time lag between permits and starts for multifamily and this could mean that permitting is slowing faster than starts.
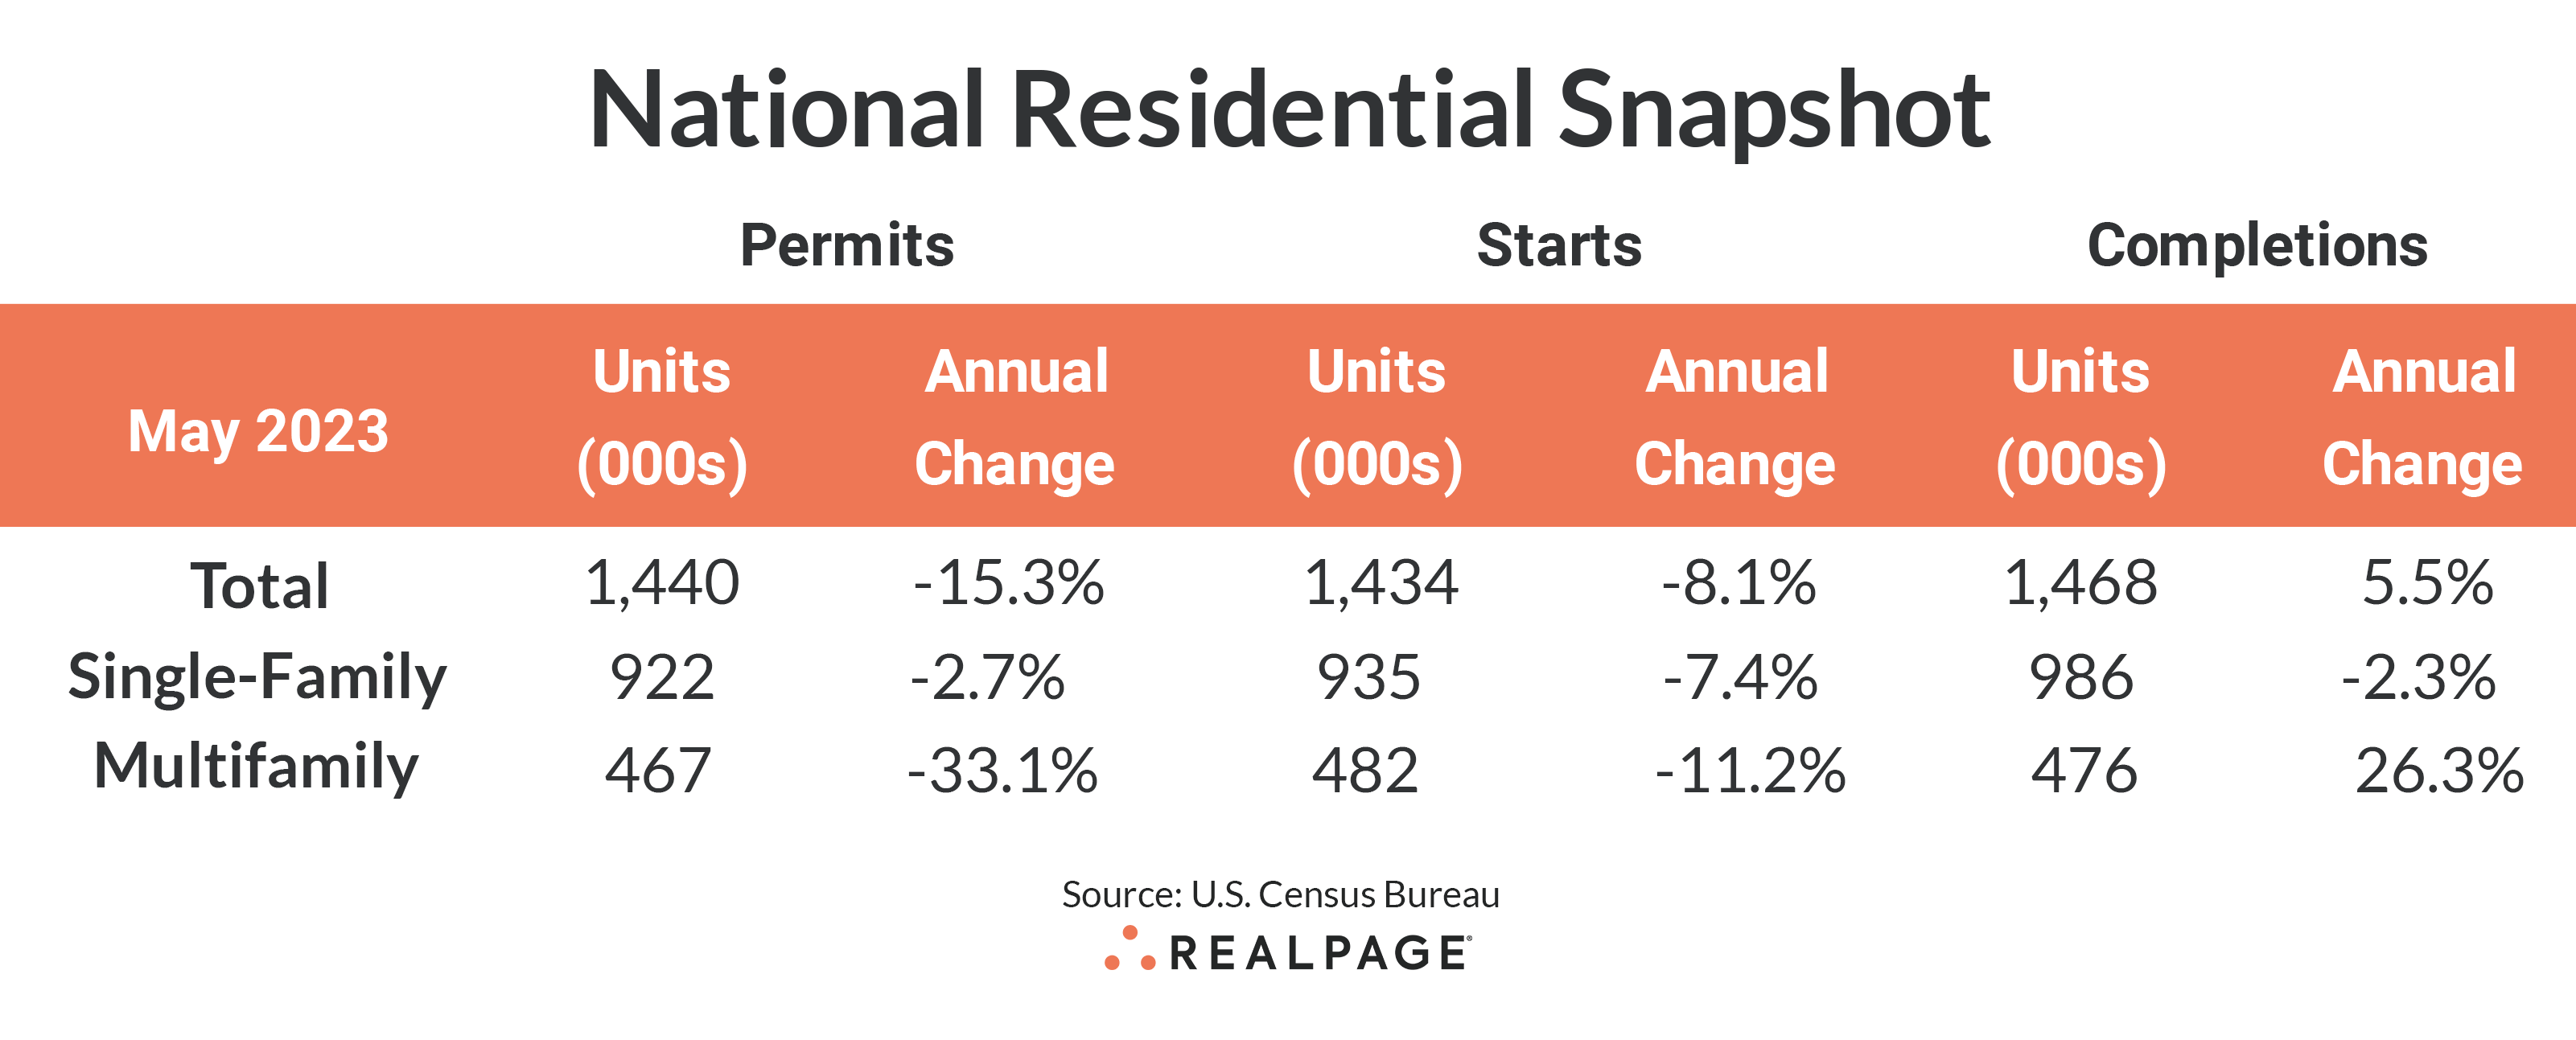
Single-family starts were at 935,000 units in June, down 7% from May and down 7.4% from last year. Combined total residential starts fell about 8% for the month and year to 1.434 million units. Single-family permitting reached an annual rate of 922,000 units in June, up a modest 2.2% from May and only 2.7% below last year’s pace. Total residential permitting dipped 3.7% in May to 1.44 million units but were down 15.3% for the year.
Multifamily completions dipped 2.5% from May to 476,000 units but are up 26.3% from last June’s completion rate. Single-family completions were down 2.8% in June with the annual rate reaching 986,000 units, down 2.3% for the year.
The number of multifamily units authorized but not started decreased 5.6% for the month to 136,000 units, down 2.9% from one year ago. The ratio of multifamily units not started to annualized permits moved to 29.1% from about 20% last June. Single-family units authorized but not started were virtually unchanged at 141,000 units from 140,000 units in May, down 2.1% from last year.
With slowing multifamily permitting, the number of multifamily units under construction (977,000 units) was almost the same as last month’s figure, but it continues to exceed that of single-family (688,000 units).
Compared to one year ago, the annual rate for multifamily permitting decreased in three of the four Census regions, with the deepest decrease in the small Northeast region (down 55.4% to 36,000 units). The West region saw multifamily permitting slow by 37.1% to 127,000 units, while the South region’s permitting was down 33.4% to 229,000 units. The Midwest region saw a mild increase of 5.7% to 74,000 units in June. Compared to the previous month, permitting was also up in the Midwest but down in the remaining three regions.
Multifamily starts were up in only the South region from last year, with a moderate increase of 5.9% to 266,000 units. Starts plunged by 49% in the Northeast region to 39,000 units, and by 25.8% in the Midwest to 47,000 units. The West region decreased by 14.5% to 131,000 units. Compared to May’s seasonally adjusted annual rate, starts were also down in the Midwest and West, up in the Northeast, and essentially unchanged in the South.
Metro-Level Multifamily Permitting
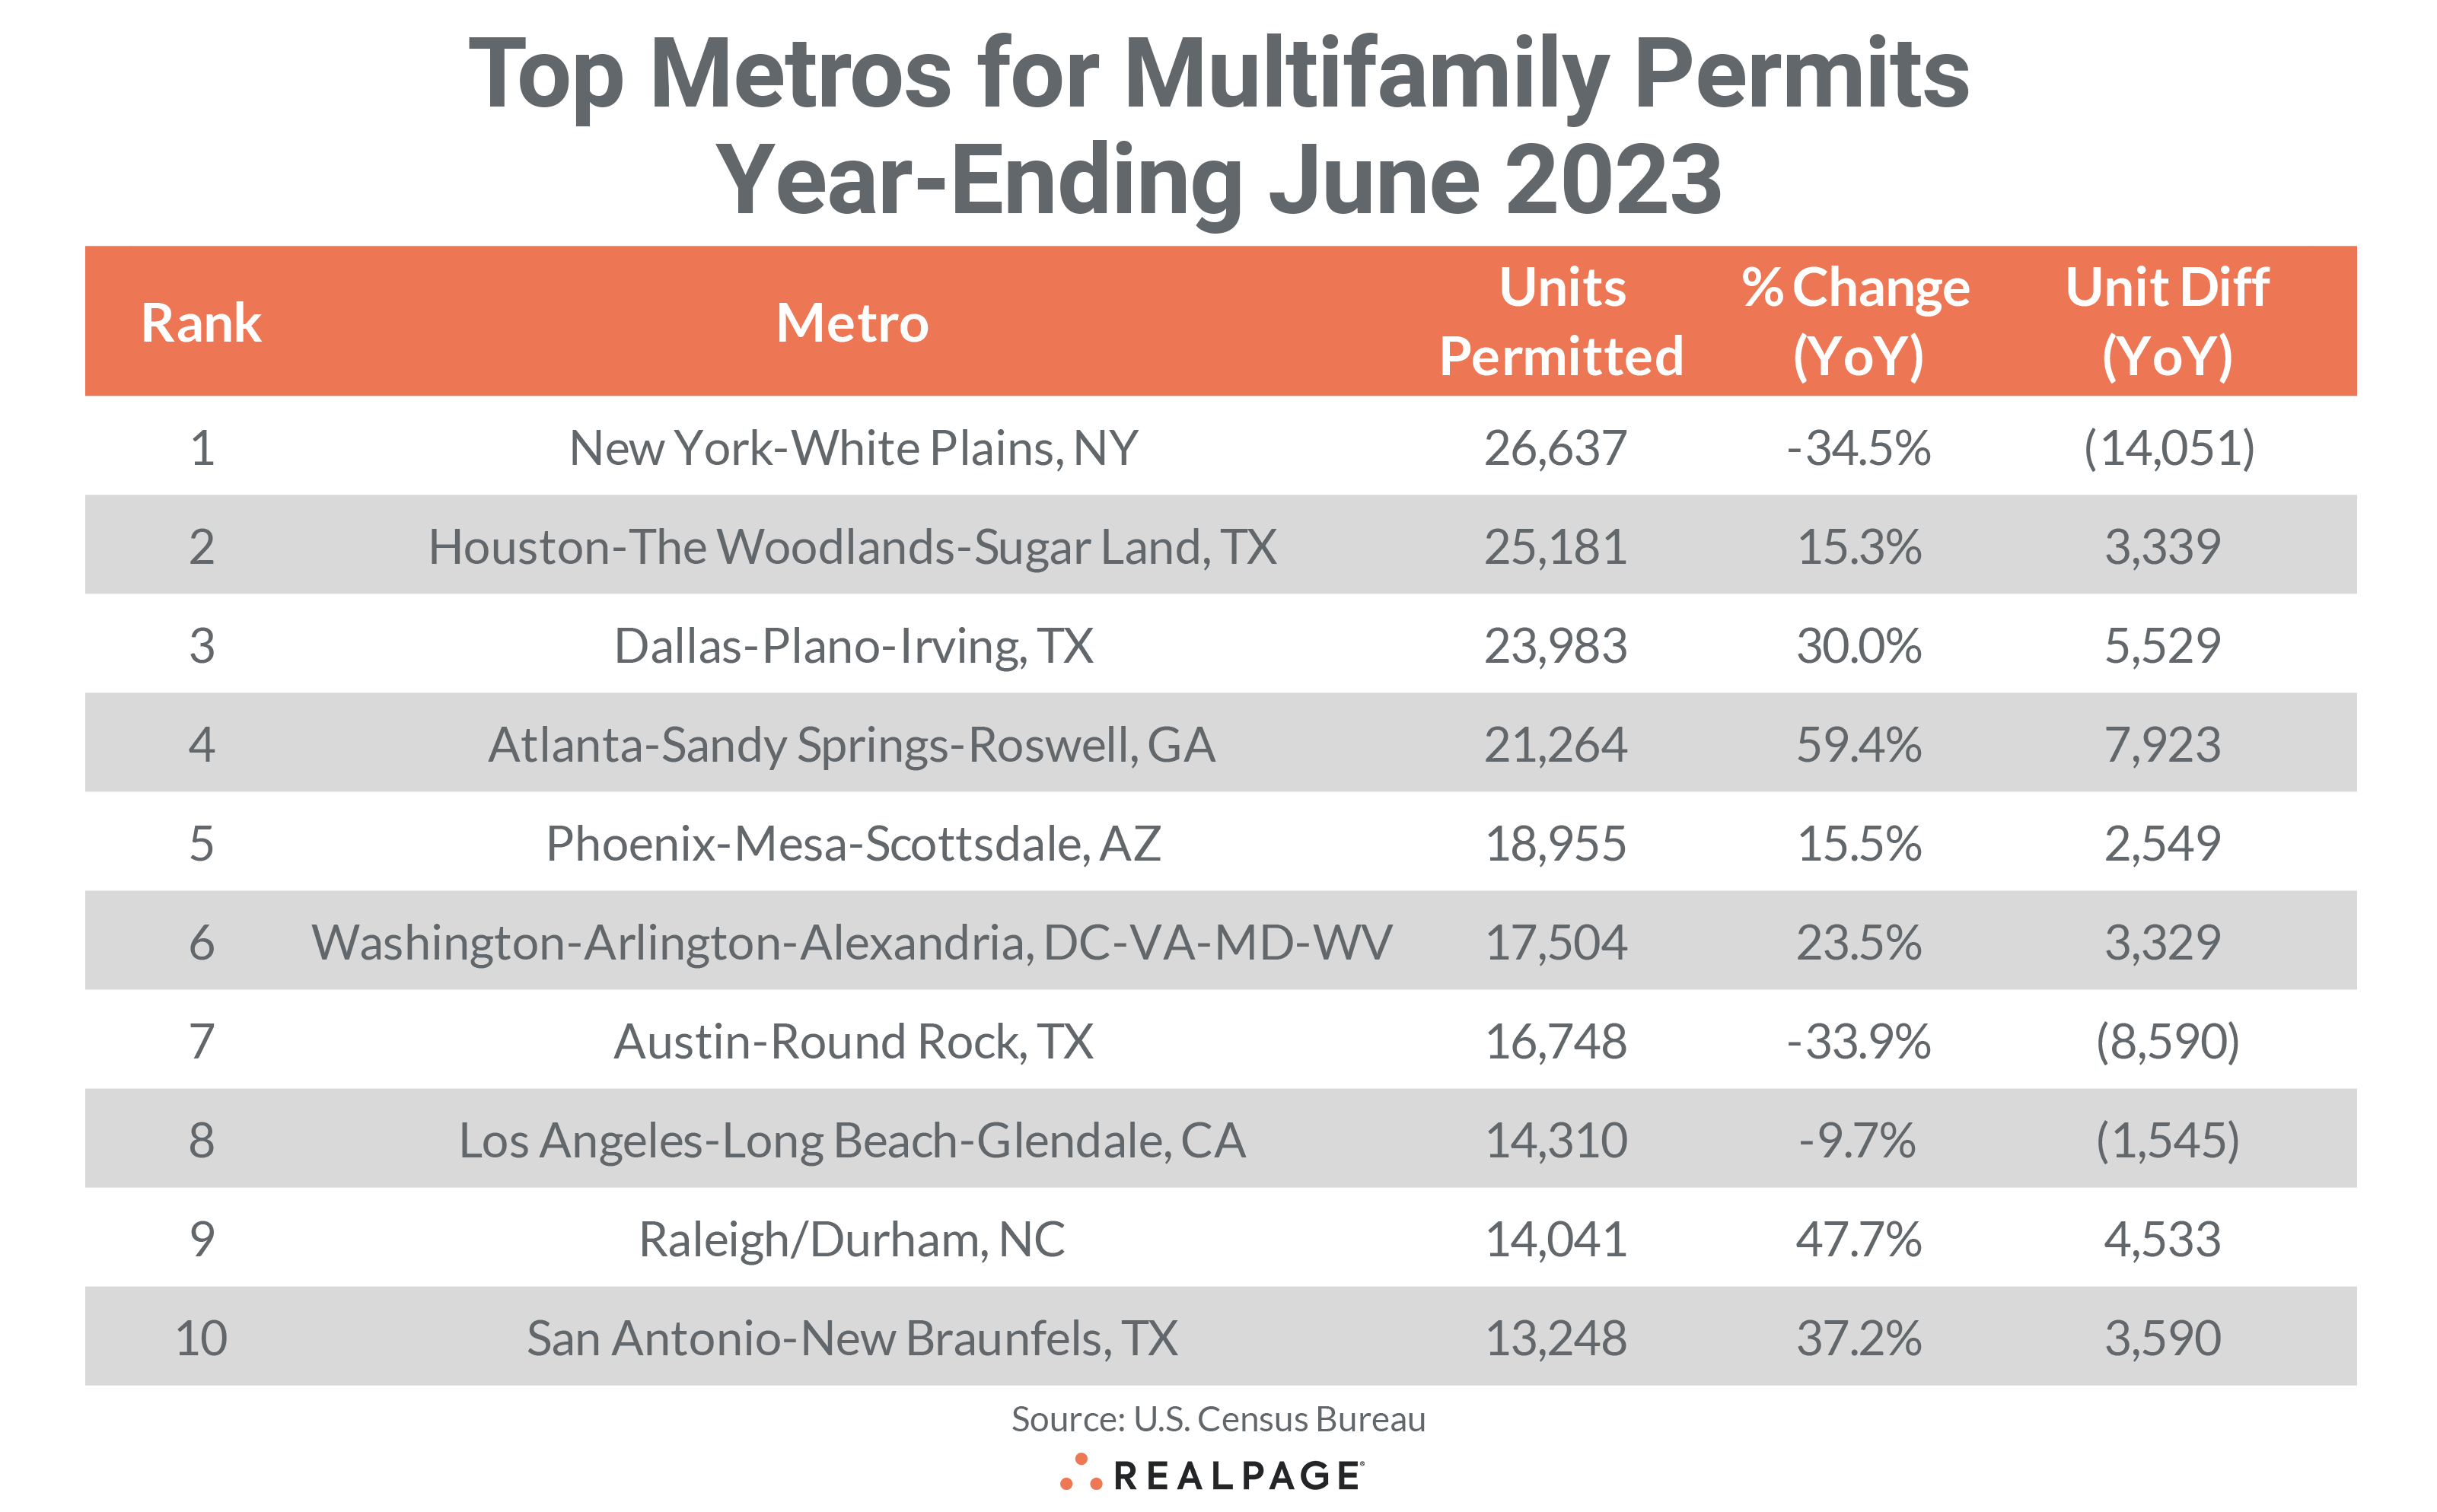
Nine of the top 10 markets from May’s list returned in June with six of them returning in order. New York continues to lead the nation in multifamily permitting, totaling 26,637 units through June, down by more than 14,000 units from last year and more than 4,000 less than in May.
Houston returned at #2 with 25,181 units permitted, an increase of 3,339 units from last year but 2,734 units fewer than last month. Dallas retained the #3 spot with 23,983 units permitted in the past 12 months, down 771 units from May’s total but 5,529 units greater than last year. Atlanta returned in the #4 spot with 21,264 units permitted, about the same as May’s 12-month total but 7,923 units more than last year.
Phoenix was the last of the first five to return in order, permitting a total of 18,955 units for the year, for an increase of 2,549 units from last June and a decrease of 1,534 units from May. Washington, DC and Austin switched places at #6 and #7, with the nation’s capital permitting 17,504 units for the year (down just 206 units from May), while Texas’ capital permitted 16,748 units through June, declining 8,590 units from last year and 1,302 units from May.
Los Angeles retained the #8 spot with 14,310 units permitted, down 1,545 units from last June and about the same as last month. Raleigh/Durham moved up a spot to #9 this month with a total of 14,041 units for the year-ending June, slightly higher than last month’s level but 4,533 units more than one year ago. San Antonio cracked the top 10 with 13,248 units permitted for the year, up by 3,560 from last June and by 644 units from last month.
Seven of the top 10 multifamily permitting markets increased their annual totals from the year before and they were generally large increases, ranging from a low of 2,549 units in Phoenix to 7,923 additional units in Atlanta. Three of the top 10 markets increased multifamily permitting by at least 4,000 units over last year’s pace. Only New York, Austin and Los Angeles had decreases from last year of the top 10 markets.
Other large markets outside of the top 10 that saw significant year-over-year increases in annual multifamily permitting in the year-ending June were Tampa (+4,461 units), Riverside (+2,662 units), Portland, OR (+2,263 units), and Anaheim (+1,116 units).
Smaller markets with big increases include Crestview-Fort Walton Beach-Destin (+2,270 units), Cape Coral-Fort Myers (+1,369 units), Louisville/Jefferson County, KY (+1,349 units), Akron, OH (+1,176 units), Palm Bay-Melbourne-Titusville, FL (+1,153 units) and Macon/Warner Robins, GA (+1,130 units).
Significant slowing in annual multifamily permitting occurred in Philadelphia (-15,000 units), Seattle (-9,553 units), Minneapolis-St. Paul (-4,518 units), Denver (-4,366 units), Orlando (-3,080 units), Nashville (-2,951 units), Salt Lake City (-2,769 units), and Boston (-2,684 units).
The annual total of multifamily permits issued in the top 10 metros – 191,871 – was about 4% more than the 185,265 issued in the previous 12 months but down about 5% from last month. The total number of permits issued in the top 10 metros was almost equal to the number of permits issued for the #11 through #36 ranked metros.
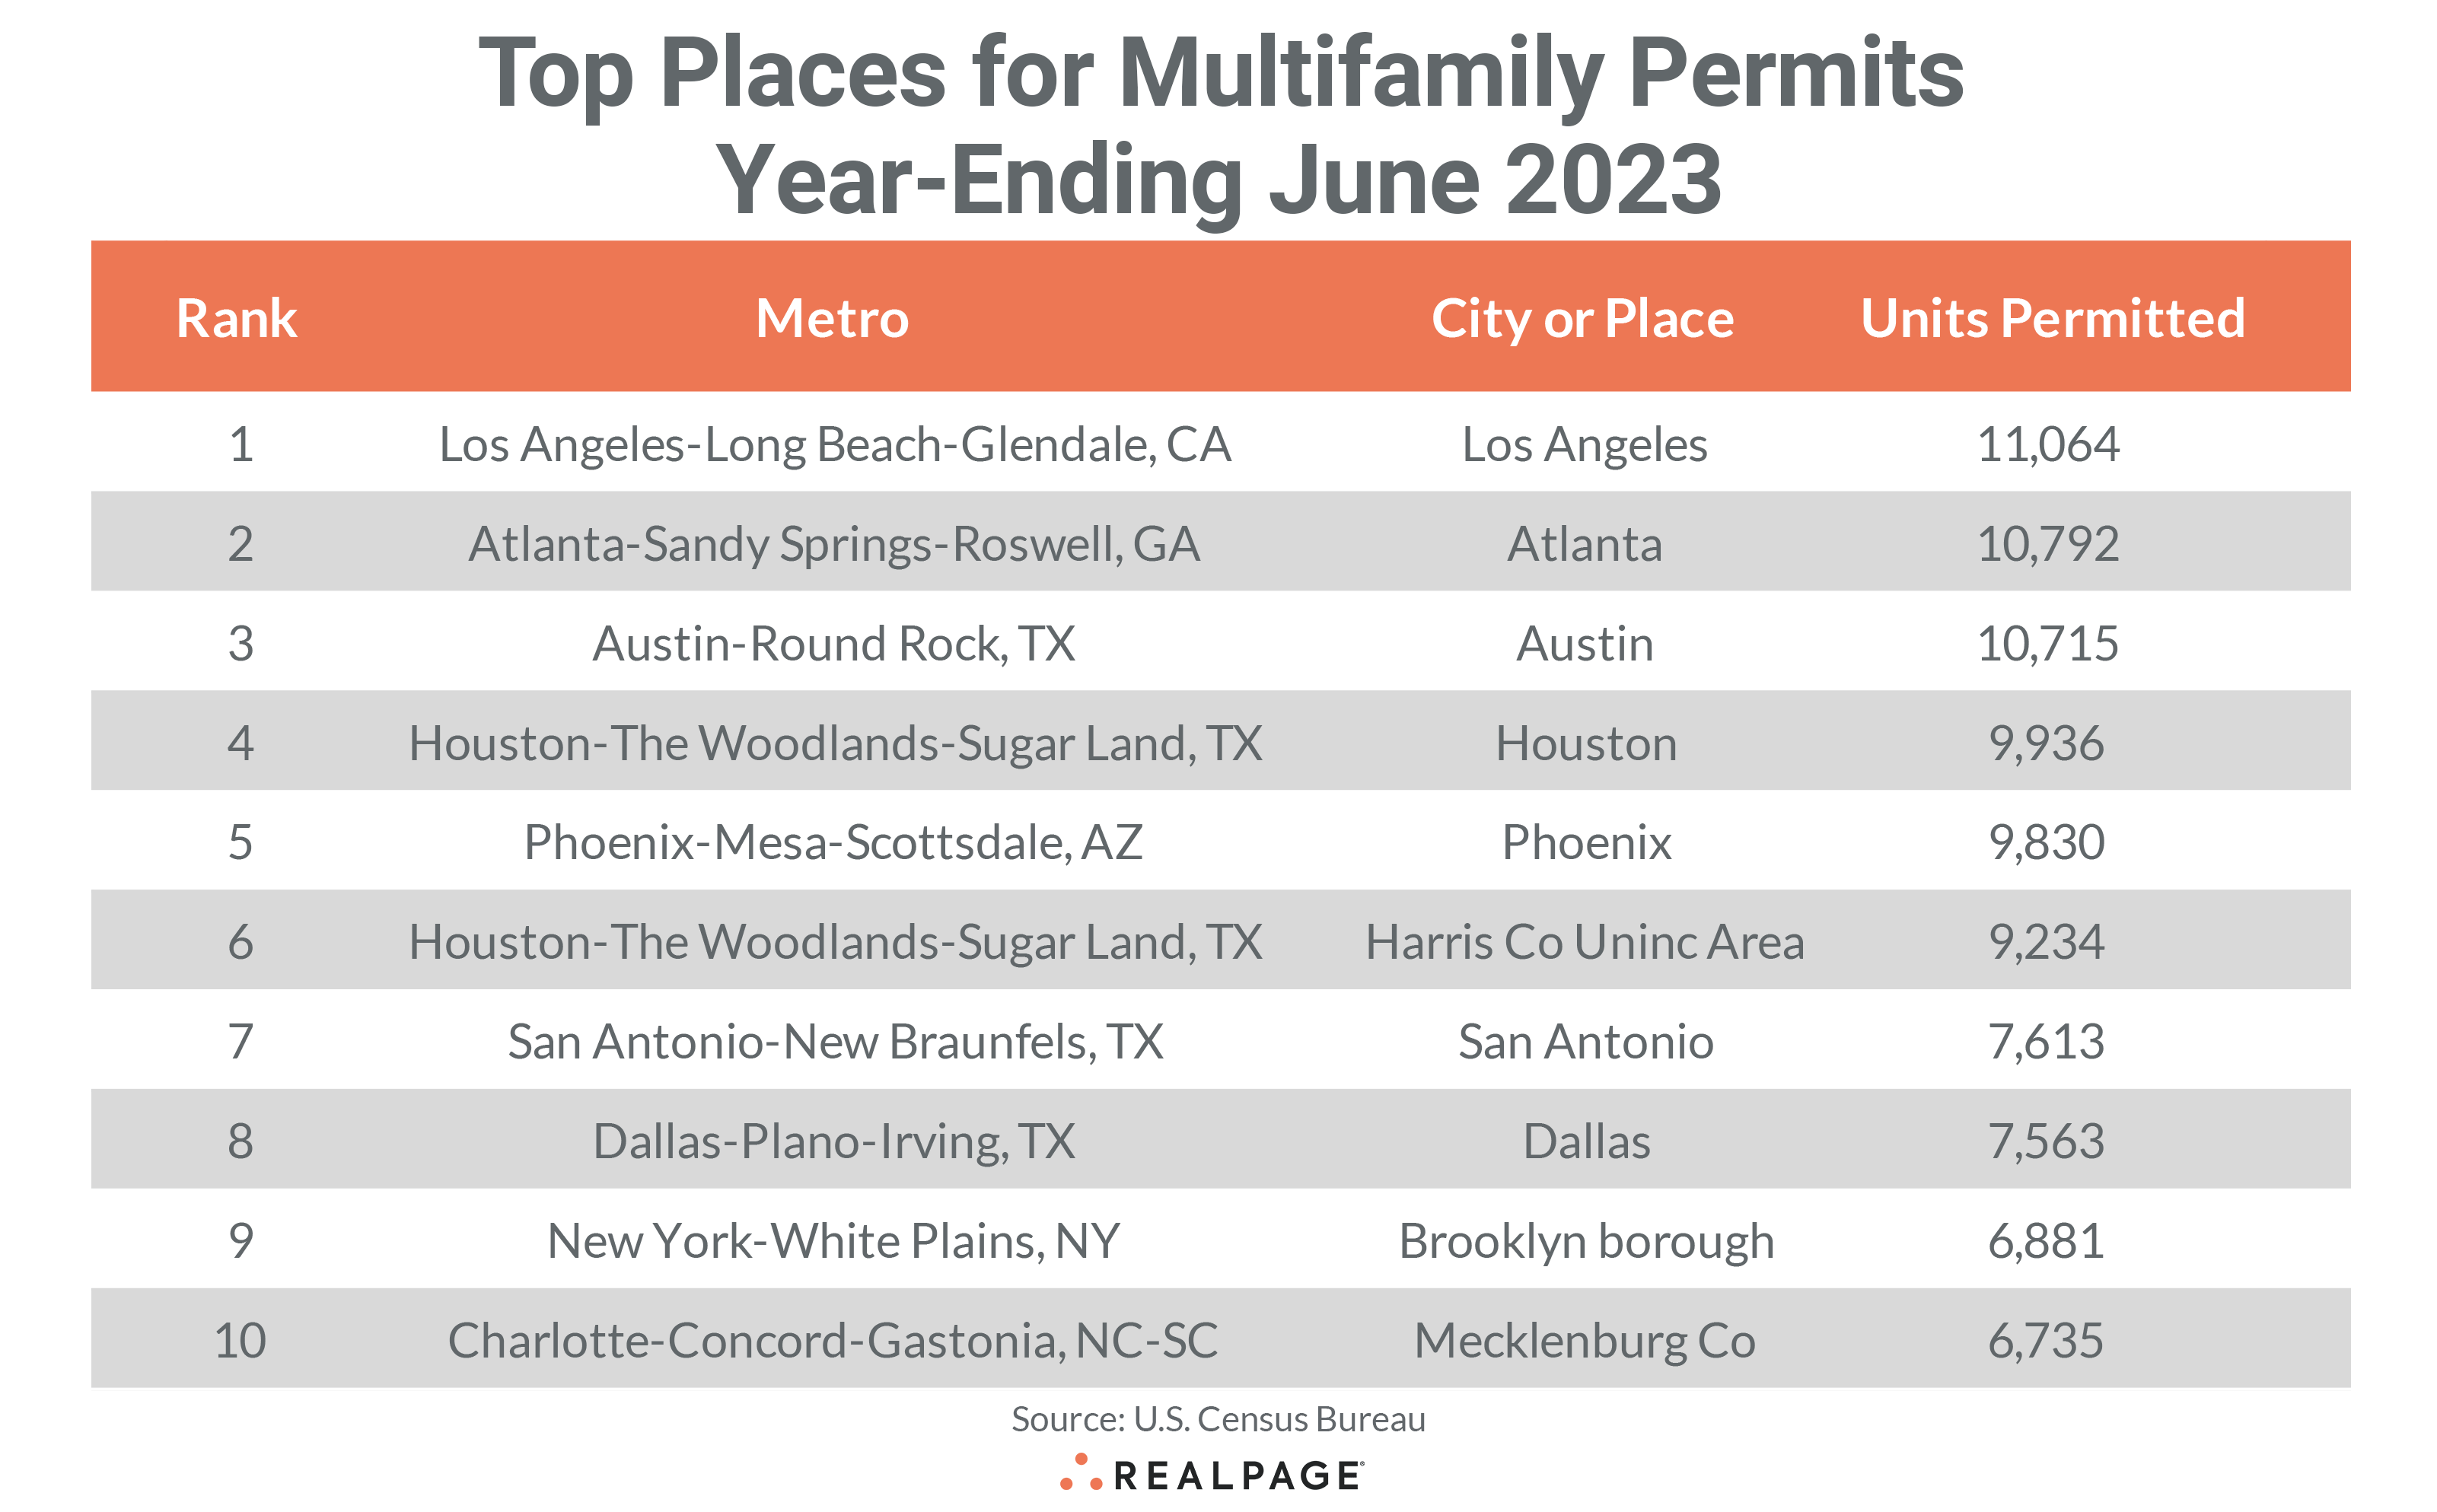
Below the metro level, all of last month’s top 10 permit-issuing places returned to this month’s list with only one remaining in the same place and the rest changing places. The list of top individual permitting places (cities, towns, boroughs, and unincorporated counties) generally include the principal city of some of the most active metro areas.
In June, the city of Los Angeles moved up two spots to take the #1 position with 11,064 units permitted, about the same as in May. The city of Atlanta jumped three spots to #2 with 10,792 units permitted but only increased their annual total by 351 units from last month. The city of Austin slipped to the #3 spot, permitting 10,715 units for the year, and down by 966 units from May.
The city of Houston fell to the #4 spot with an annual total of 9,936 units but saw a decline in permitting of 1,173 units from May’s 12-month total. The city of Phoenix moved up a spot to #5 but also declined from last month’s total, recording 9,830 units permitted for the year-ending June.
Houston’s Unincorporated Harris County fell to the #6 spot with an annual total of 9,234 units permitted, down 1,280 units from May, while the city of San Antonio moved up to the #7 spot with 7,613 units permitted. The city of Dallas slipped one spot to #8 with 7,563 units permitted through June, 799 units fewer than the month before.
The borough of Brooklyn also fell one spot (to #9), permitting 6,881 units for the year but declining by 1,314 units from May’s total. Mecklenburg County (Charlotte) retained its #10 spot, permitting 6,735 units for the year, almost unchanged from May’s annual figure.
The cities of Los Angeles and Atlanta were the only top 10 permitting places on June’s list to see an increase in permitting from May’s annual total. The cities of Austin and Houston, the borough of Brooklyn and Unincorporated Harris County decreased their annual permitting by about 1,000 or more units from last month’s annual totals.


