Multifamily Permitting Appears to Have Peaked for This Cycle

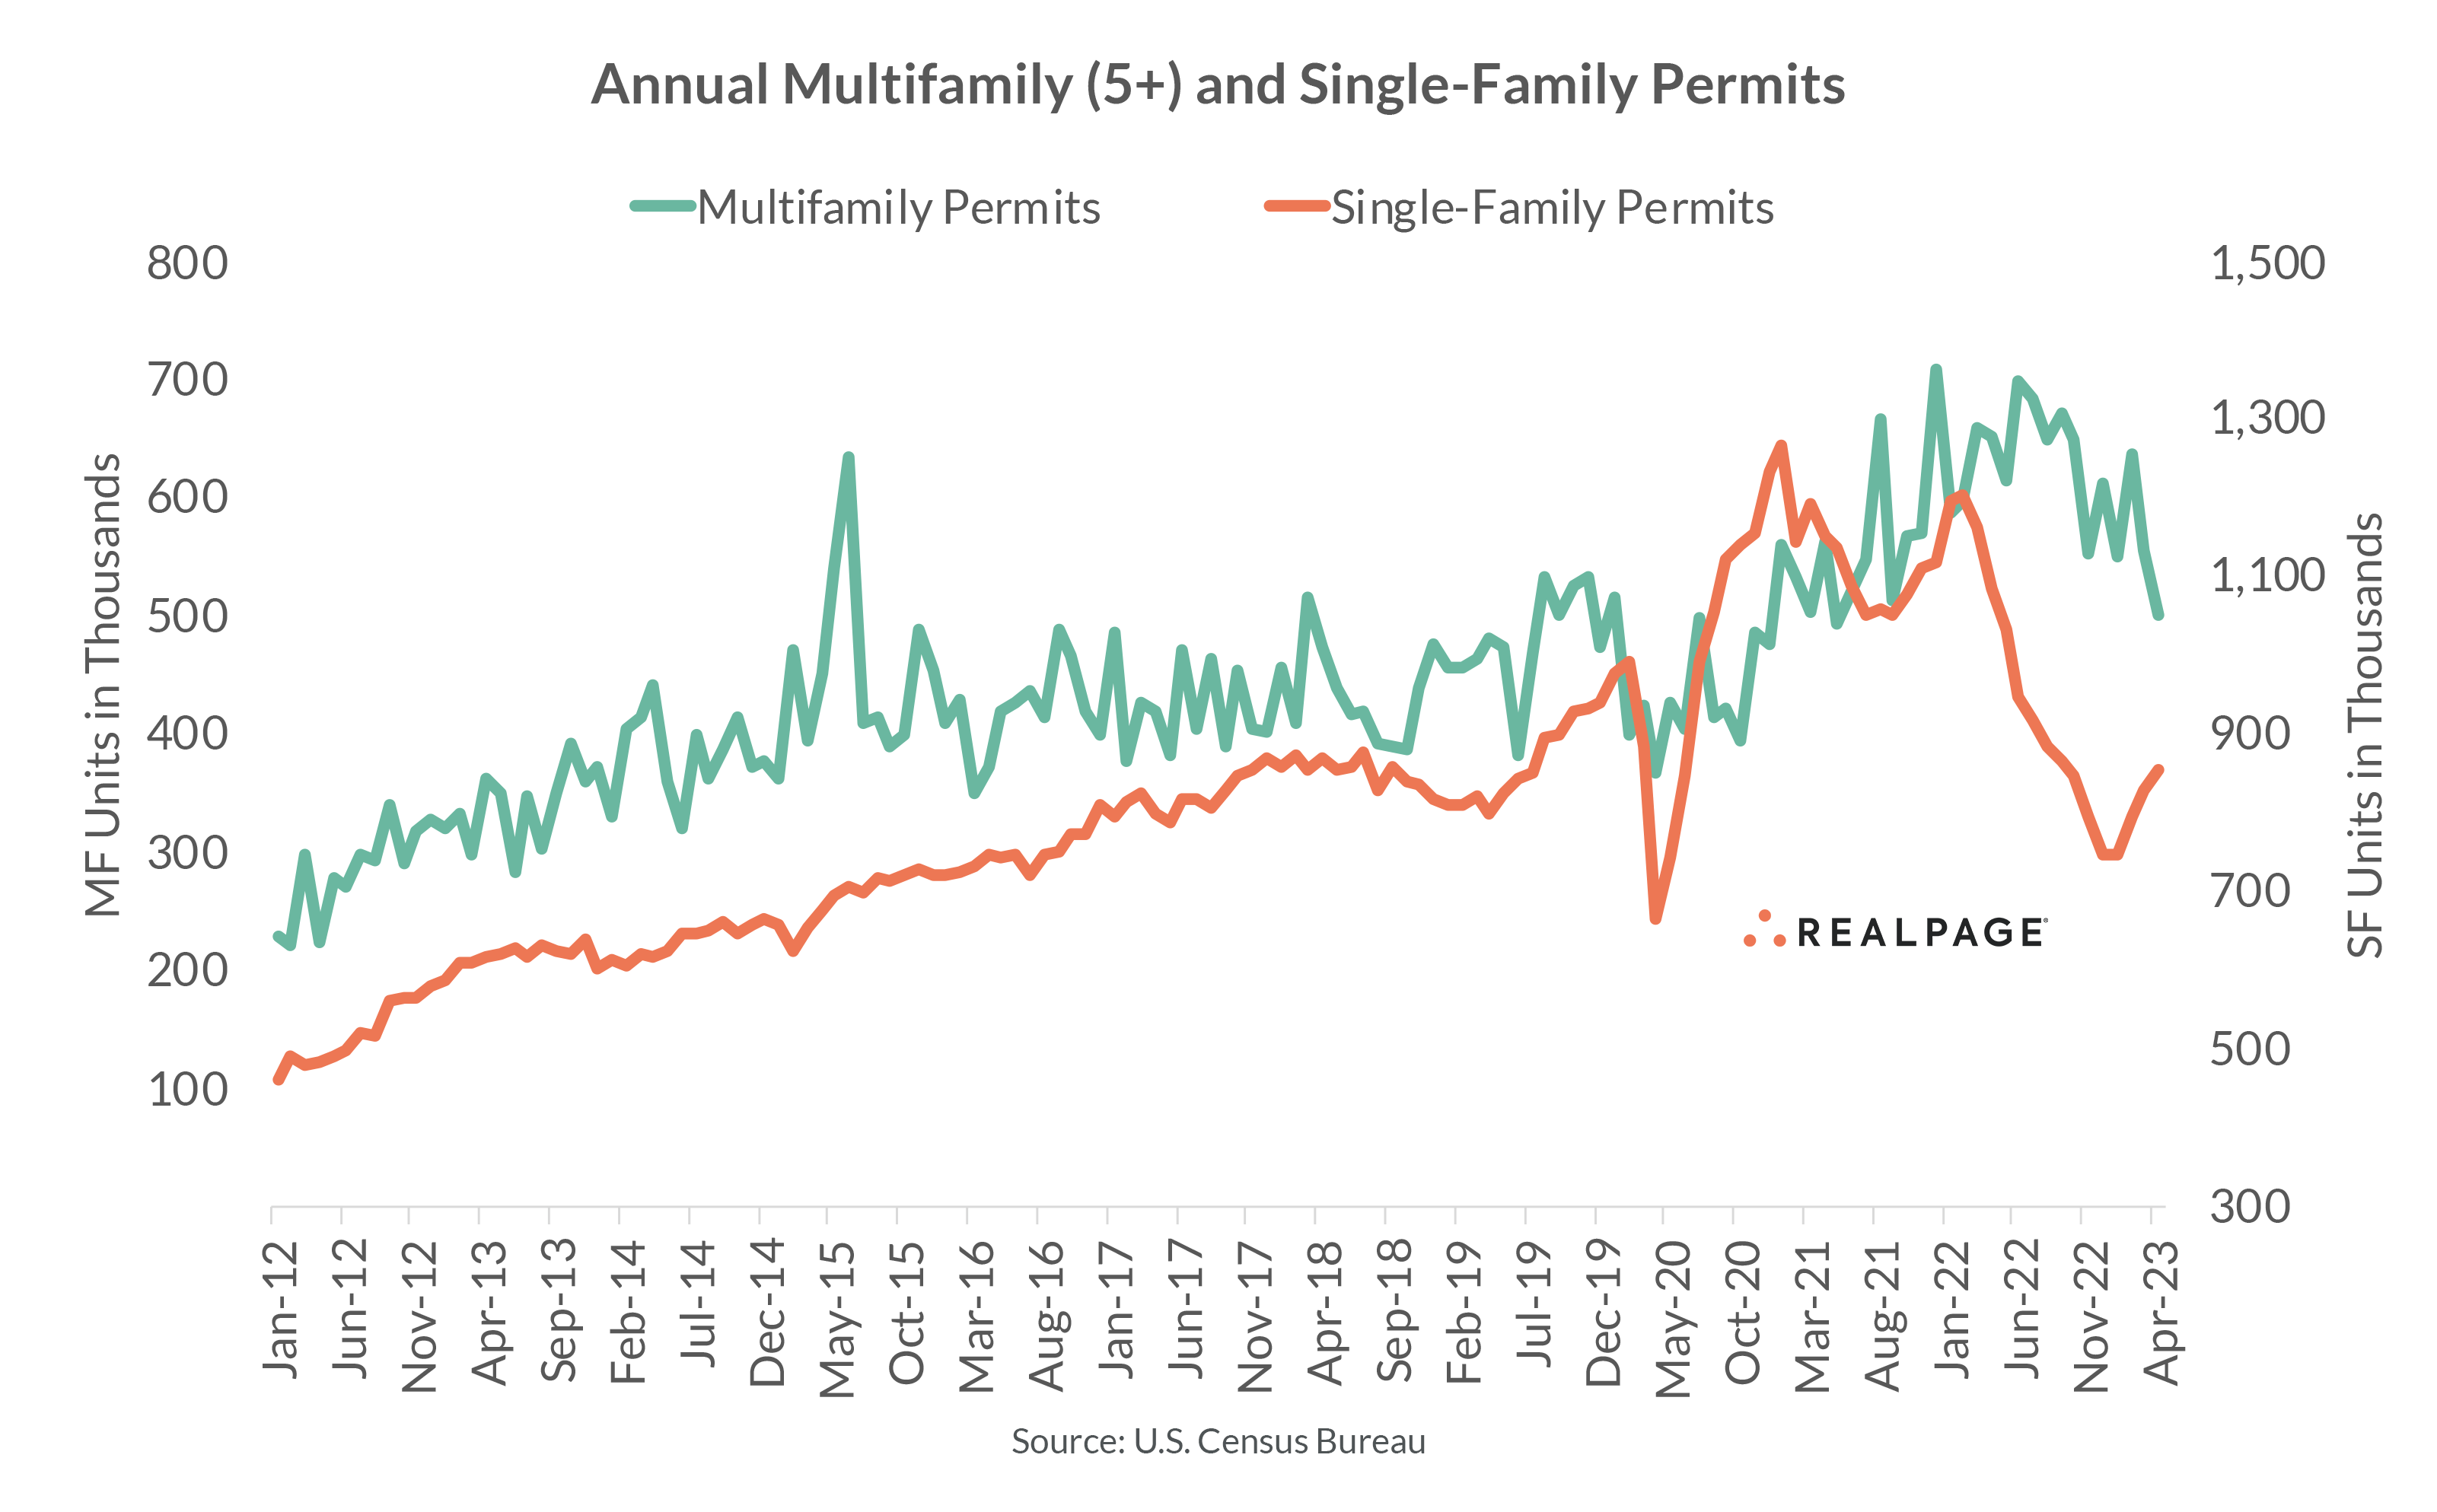
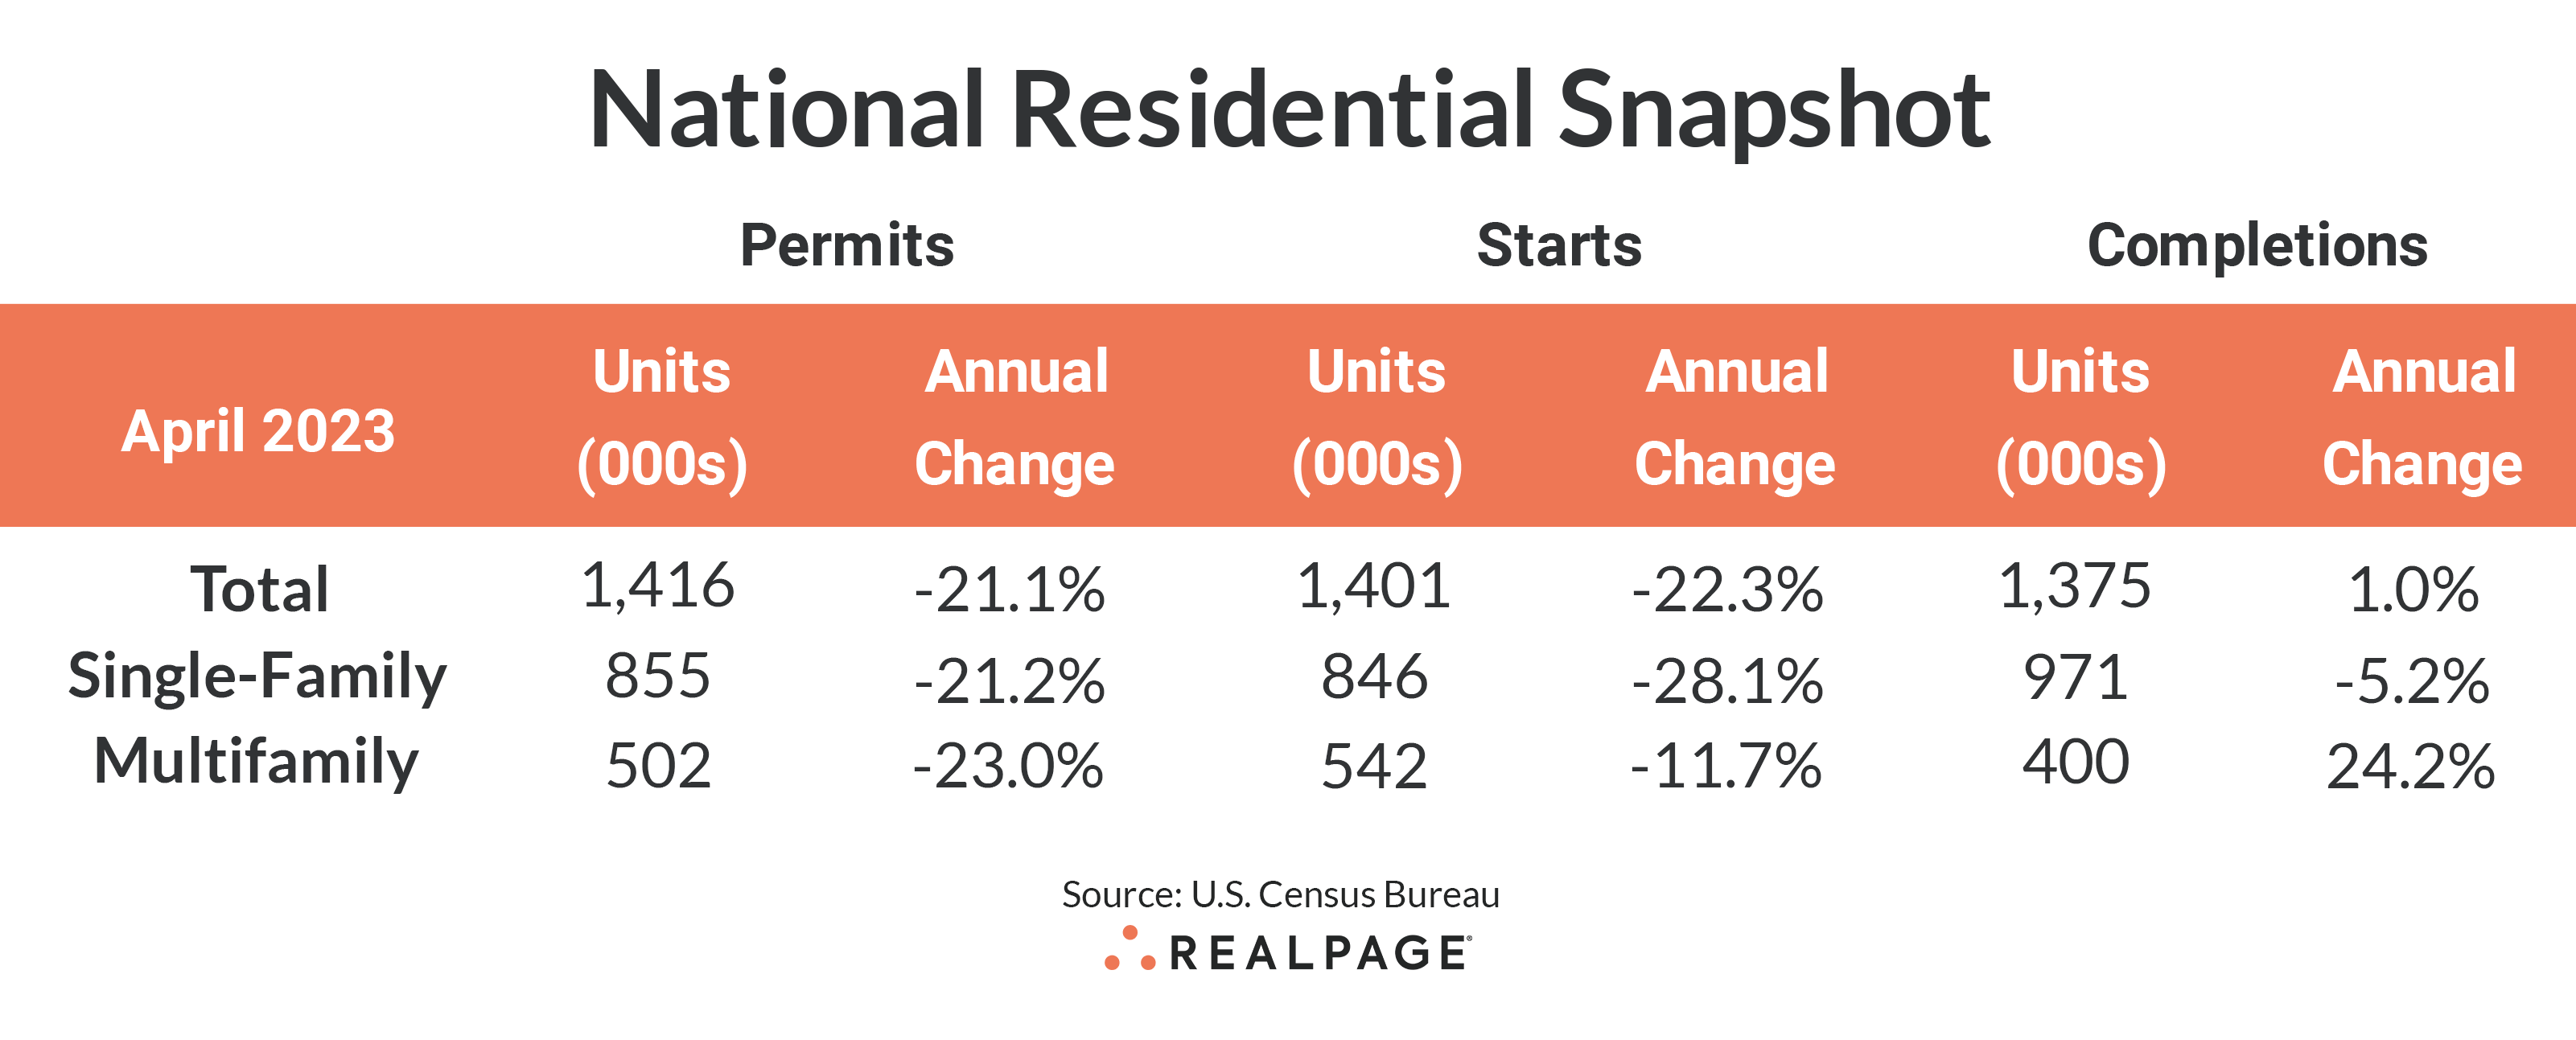
The seasonally adjusted annual rate for multifamily permitting has been declining since peaking at around 700,000 units in 2022. According to the U.S. Census Bureau’s monthly report, the annualized rate of multifamily permitting was 502,000 units in April 2023, down 9.7% from March and 23% from last April.
Multifamily permitting had been on an upward trajectory since 2021, averaging about 590,000 units since the end of the pandemic. That was well above the annual average SAAR of about 440,000 units from 2015 to 2020.
Multifamily starts have seen a similar pattern, with starts averaging 375,000 units from 2015 to 2020 before jumping to an annual average pace of about 500,000 units since. In April, the annual rate for multifamily starts was 542,000 units, up 5.2% from last month but down 11.7% year-over-year.
Conversely, single-family permitting seems to have “bottomed out” after the severe slowdown caused by higher interest rates and tighter lending practices. The annualized rate for single-family permitting peaked at almost 1.4 million units in January 2021 and hit its nadir at 748,000 units in December 2022. April’s annualized rate for single-family permitting was 855,000 units, up 3.1% from March’s pace but still down 21.2% from last year.
Single-family starts were up 1.6% in April, to 846,000 units. Still, that was down 28.1% from last April’s annual rate. Single-family permitting and starts mirror each other with only a slight lag for starts.
Multifamily completions fell 17.4% from March to 400,000 units but are up 24.2% from last April’s completion rate. Single-family completions were down 6.5% in April with the annual rate reaching 971,000 units, down 5.2% for the year.
The number of multifamily units authorized but not started decreased 6.4% for the month to 147,000 units, up 11.4% from one year ago. The ratio of multifamily units not started to annualized permits moved up to 29.3% from about 20% last April. Single-family units authorized but not started rose 4.5% to 139,000 units from a revised 133,000 units in March, down 7.9% from last year.
With slowing but still elevated permitting, the number of multifamily units under construction (959,000 units) continues to exceed that of single-family (698,000 units) and is up a modest 1.7% from last month.
Compared to one year ago, the annual rate for multifamily permitting decreased in all four Census regions, with the deepest decreases in the small Northeast region (down 48.2% to 42,000 units), and the Midwest region (down 47.4% to 50,000 units). The South region saw multifamily permitting slow by 15.7% to 265,000 units, while the West region’s permitting was down 10.1% to 144,000 units). Compared to the previous month, permitting was down sharply in the Northeast and Midwest but up moderately in the South and West.
Multifamily starts were up in only the Midwest region from last year, with a strong increase of 29.6% to 79,000 units. Starts fell by almost 16% in the South region to 286,000 units, and by 18.4% in the West to 111,000 units. The Northeast region declined 14.1% to 67,000 units. Compared to March’s pace, starts were down in the Northeast and South but up moderately in the West and surged in the Midwest (by 600%, from an unusually weak level in March).
Metro-Level Multifamily Permitting
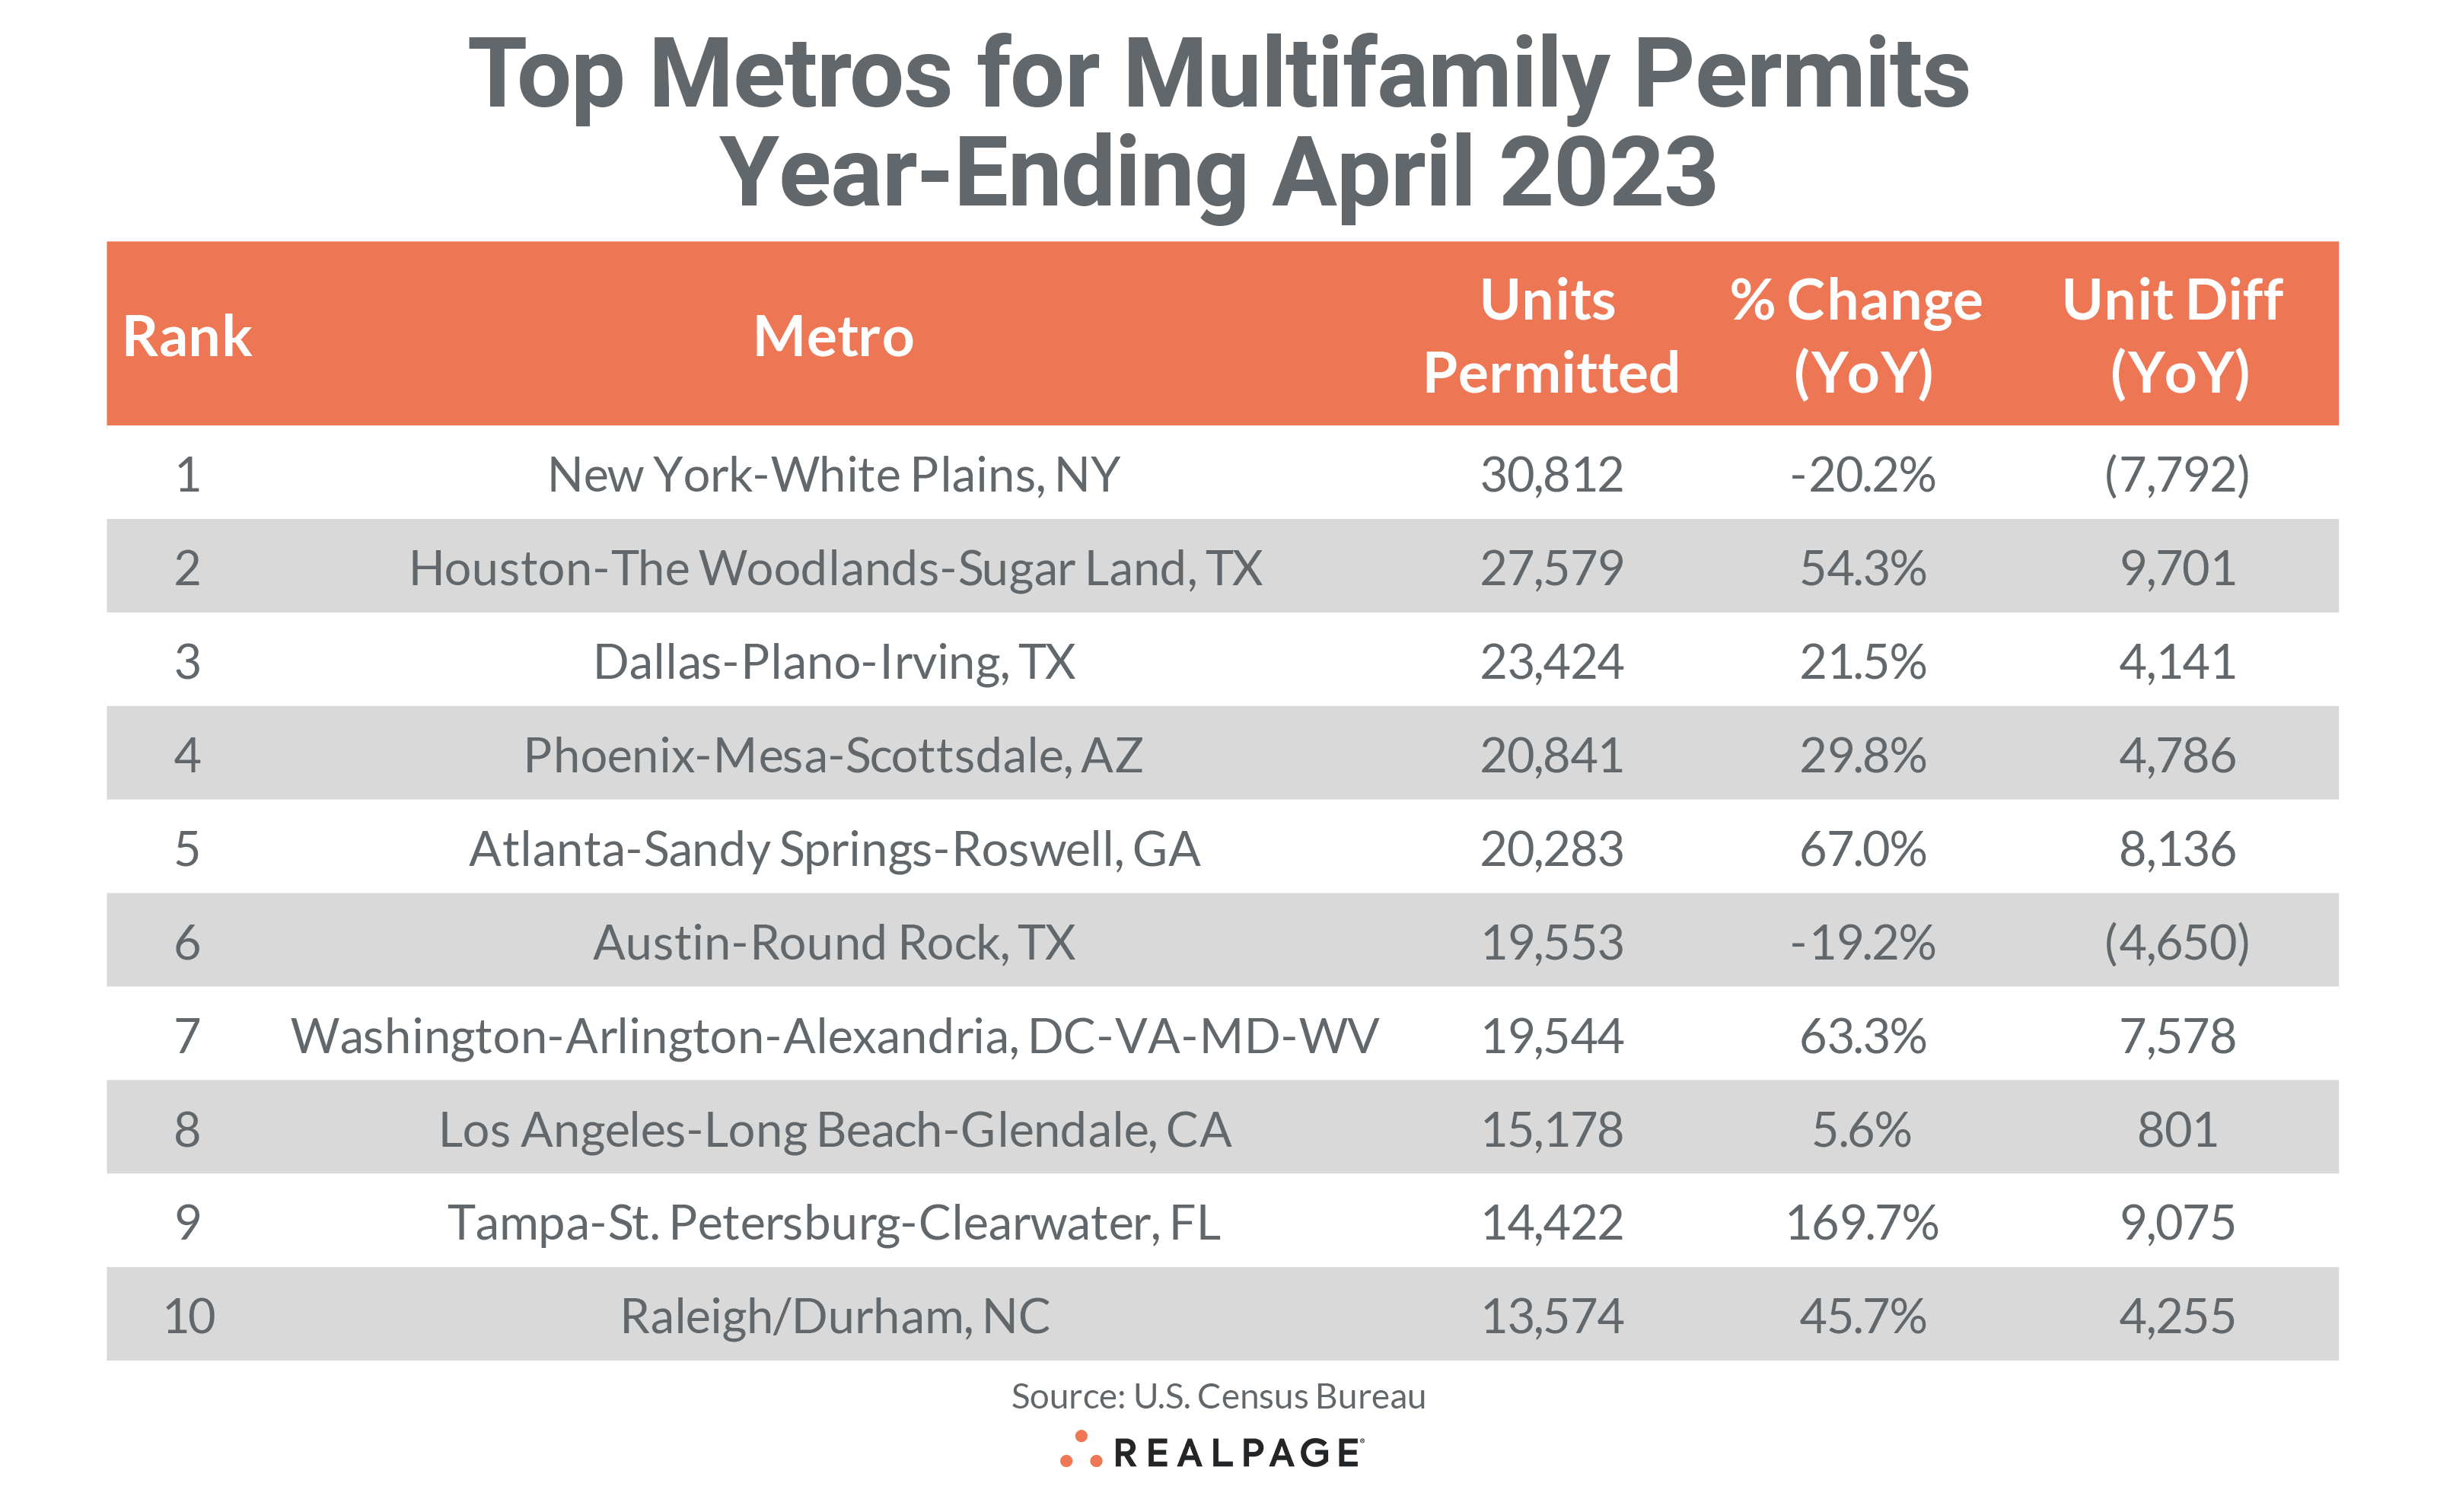
Nine of the top 10 markets from March’s list returned in April with six of them remaining in order. New York continues to lead the nation in multifamily permitting, totaling 30,812 units through April, down by almost 7,800 units from last year and about 2,100 fewer than in March.
Houston returned at #2 with 27,579 units permitted, an increase of 9,701 units from last year and the highest annual increase of all markets. Dallas retained the #3 spot with 23,424 units permitted in the past 12 months, down almost 900 units from March’s total but up 4,141 units from last year. Phoenix leapt over Atlanta and Austin to take the #4 spot with 20,841 units permitted, up only 185 units for the month but 4,486 units greater than last year.
Atlanta slipped to #5 with 20,283 units permitted in the year-ending April, jumping by 8,136 units from the year before but down 949 units from last month. Austin slowed by 1,414 units from March to 19,553 units permitted and fell by 4,650 units from last April to land at #6.
Washington, DC returned in the #7 spot, permitting 19,544 units for the year, an increase of 7,578 from the previous year and up 490 units from March’s total. Los Angeles retained the #8 spot with 15,178 units permitted, up 801 units from last April but 444 fewer than last month. Tampa also returned to its #9 spot from March, permitting a total of 14,422 units, jumping 9,075 units from last year and about even with last month.
Raleigh/Durham moved into the #10 spot this month, displacing Seattle, as the Research Triangle area permitted a total of 13,574 units for the year-ending April, close to last month’s level but 4,255 units more than one year ago.
Eight of the top 10 multifamily permitting markets increased their annual totals from the year before and they were generally large increases, ranging from a low of 4,141 units in Dallas to 9,701 additional units in Houston. Four of the top 10 markets increased multifamily permitting by at least 7,500 units over last year’s pace. Only New York and Austin had decreases from last year.
Other large markets outside of the top 10 that saw significant year-over-year increases in annual multifamily permitting in the year-ending April were San Antonio (+4,139 units), Riverside (+2,292 units), Portland, OR (+1,981 units) and Anaheim (+1,767 units).
Smaller markets with big increases include the Florida markets of Jacksonville (+2,567 units), Cape Coral-Fort Myers (+2,443 units), Crestview-Fort Walton Beach-Destin (+1,989 units), Deltona-Daytona Beach-Ormond Beach (+1,667 units) and Lakeland-Winter Haven (+1,425 units).
Significant slowing in annual multifamily permitting occurred in Philadelphia (-16,696 units), Nashville (-5,795 units), Seattle (-5,667 units), Orlando (-3,374 units), Boston (-2,891 units), Salt Lake City (-2,777 units) and Denver (-2,507 units).
The annual total of multifamily permits issued in the top 10 metros – 205,210 – was about 21% more than the 169,179 issued in the previous 12 months but down almost 3% from last month. The total number of permits issued in the top 10 metros was almost equal to the number of permits issued for the #11 through #38 ranked metros.
Below the metro level, nine of last month’s top 10 permit-issuing places returned to this month’s list with only four remaining in the same place and several others changing places. The list of top individual permitting places (cities, towns, boroughs, and unincorporated counties) generally include the principal city of some of the most active metro areas.
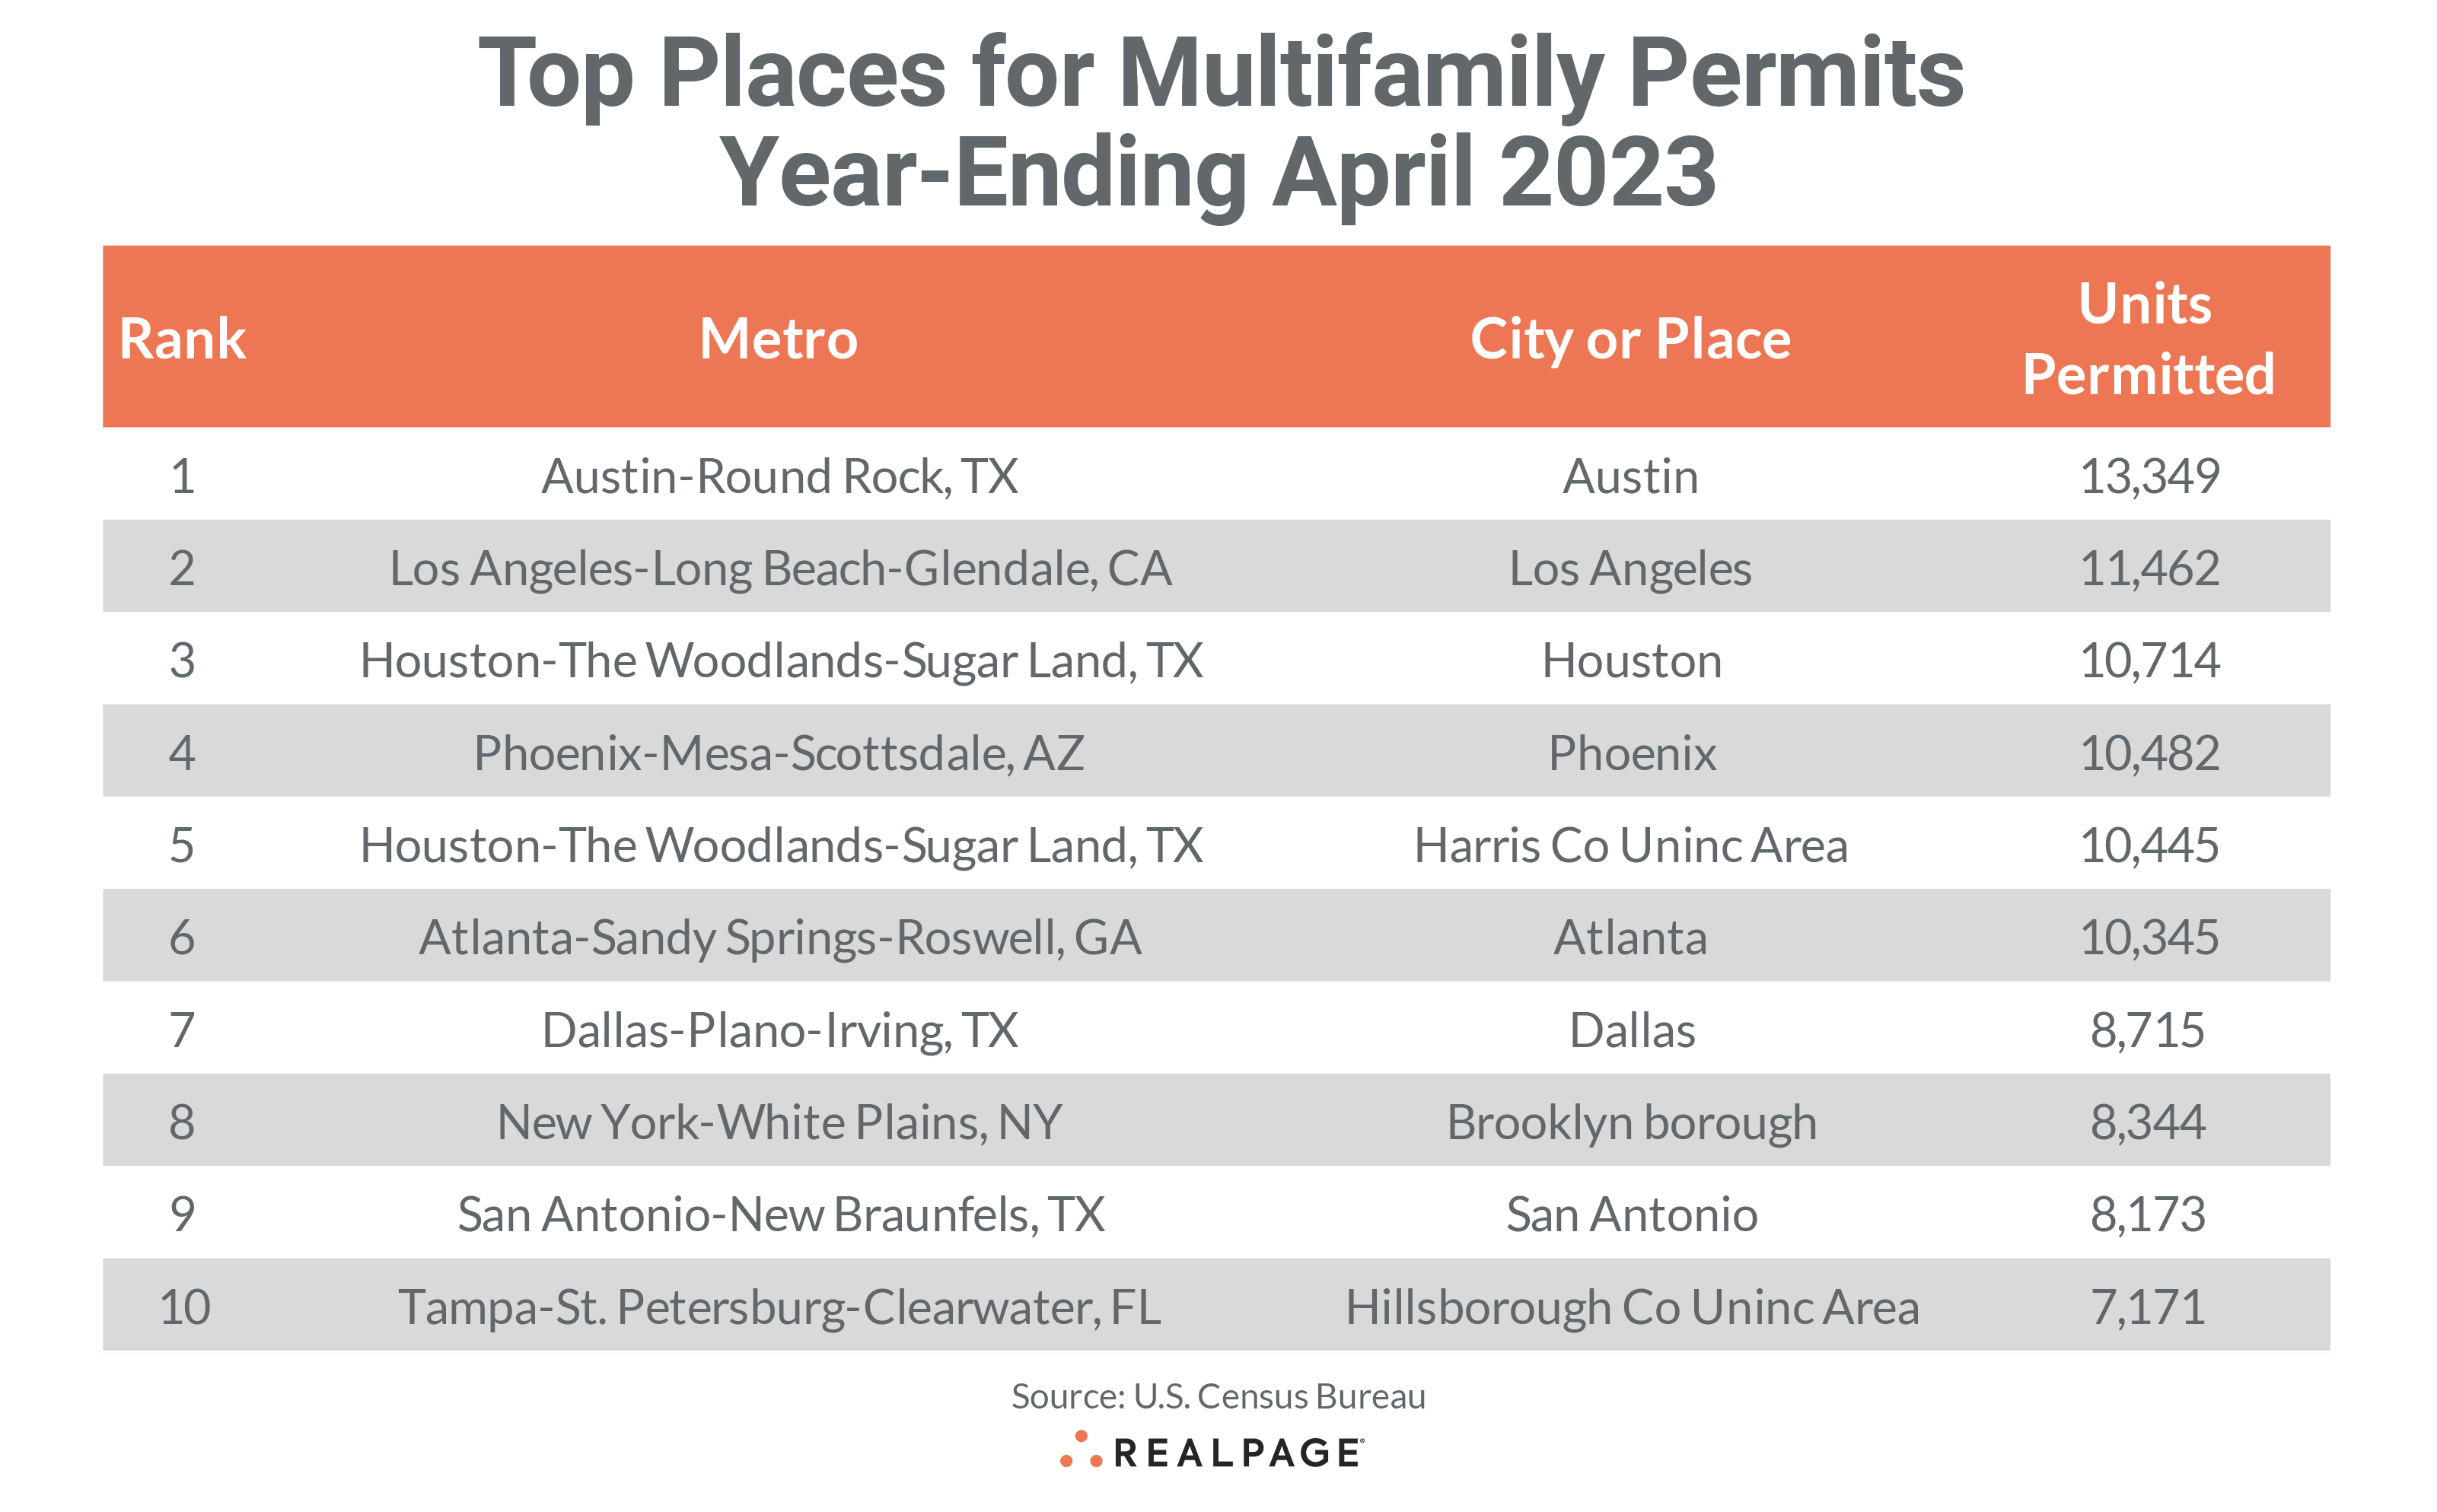
The city of Austin remained in the top spot with a permitting total of 13,349 units, about 1,400 units less than in March. The city of Los Angeles also kept its spot from last month at #2 with 11,462 units permitted, down 475 units from last month. The city of Houston moved up three spots from last month to #3 with 10,714 units permitted, increasing their total by about 1,000 units. The city of Phoenix returned in the #4 spot, permitting 10,482 units for the year while the unincorporated portion of Houston’s Harris County slipped to the #5 spot, permitting a similar 10,445 units.
The city of Atlanta slipped one spot to #6 with an annual total of 10,345 units permitted, down 124 units from March. The city of Dallas filled the #7 spot again this month with an annual total of 8,715 units permitted, down 514 units for the month.
The borough of Brooklyn and the city of San Antonio switched places again at #8 and #9 and permitted similar amounts at 8,344 units for Brooklyn and 8,173 units for San Antonio. The unincorporated portion of Hillsborough County (Tampa) moved into the #10 spot with 7,171 units permitted, up 352 units from March’s total.
The city of Houston, Brooklyn borough and Unincorporated Hillsborough County were the only top 10 permitting places on April’s list to see an increase in permitting from March’s annual total. The city of Austin, Unincorporated Harris County and the cities of Phoenix and Dallas decreased annual permitting by at least 500 units from last month’s annual total.


