Concession Usage in Minneapolis More Than Doubles Midwest Average

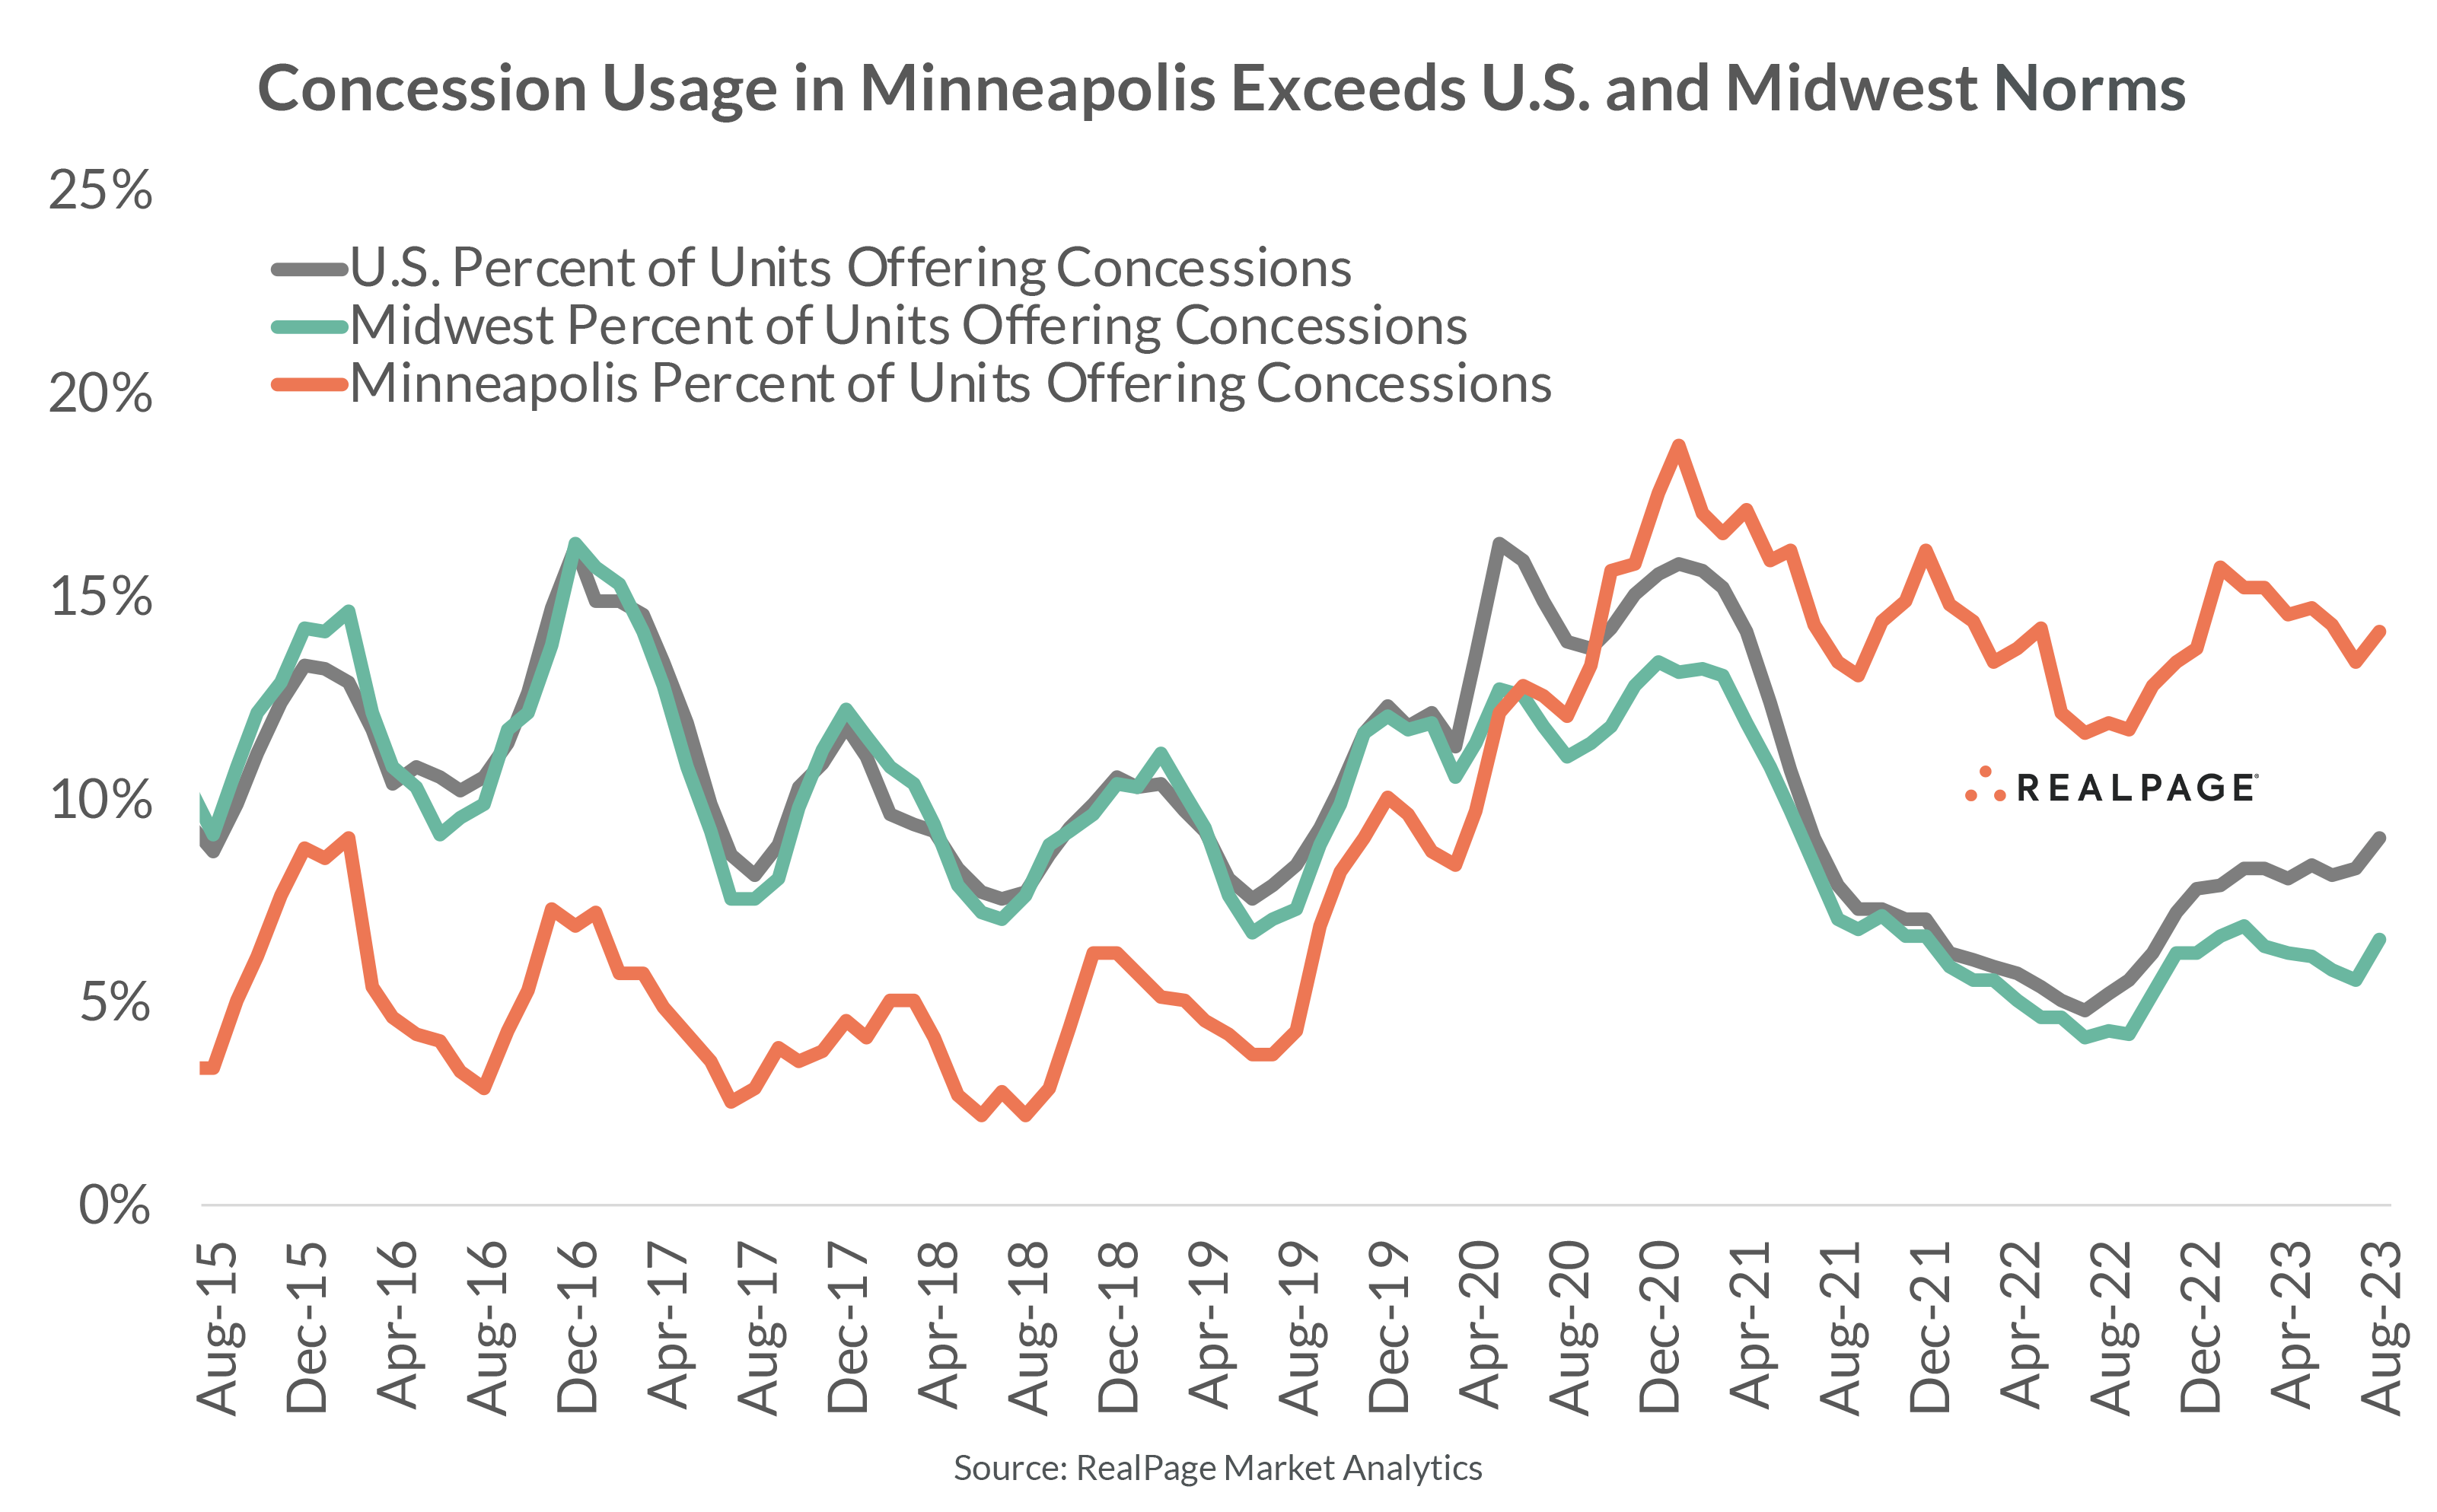
Apartment operators in the Minneapolis-St. Paul-Bloomington market have used concessions at elevated levels in recent years. The percentage of units offering discounts began to pick up in late 2019, continued trending upward through 2020 and has remained high since.
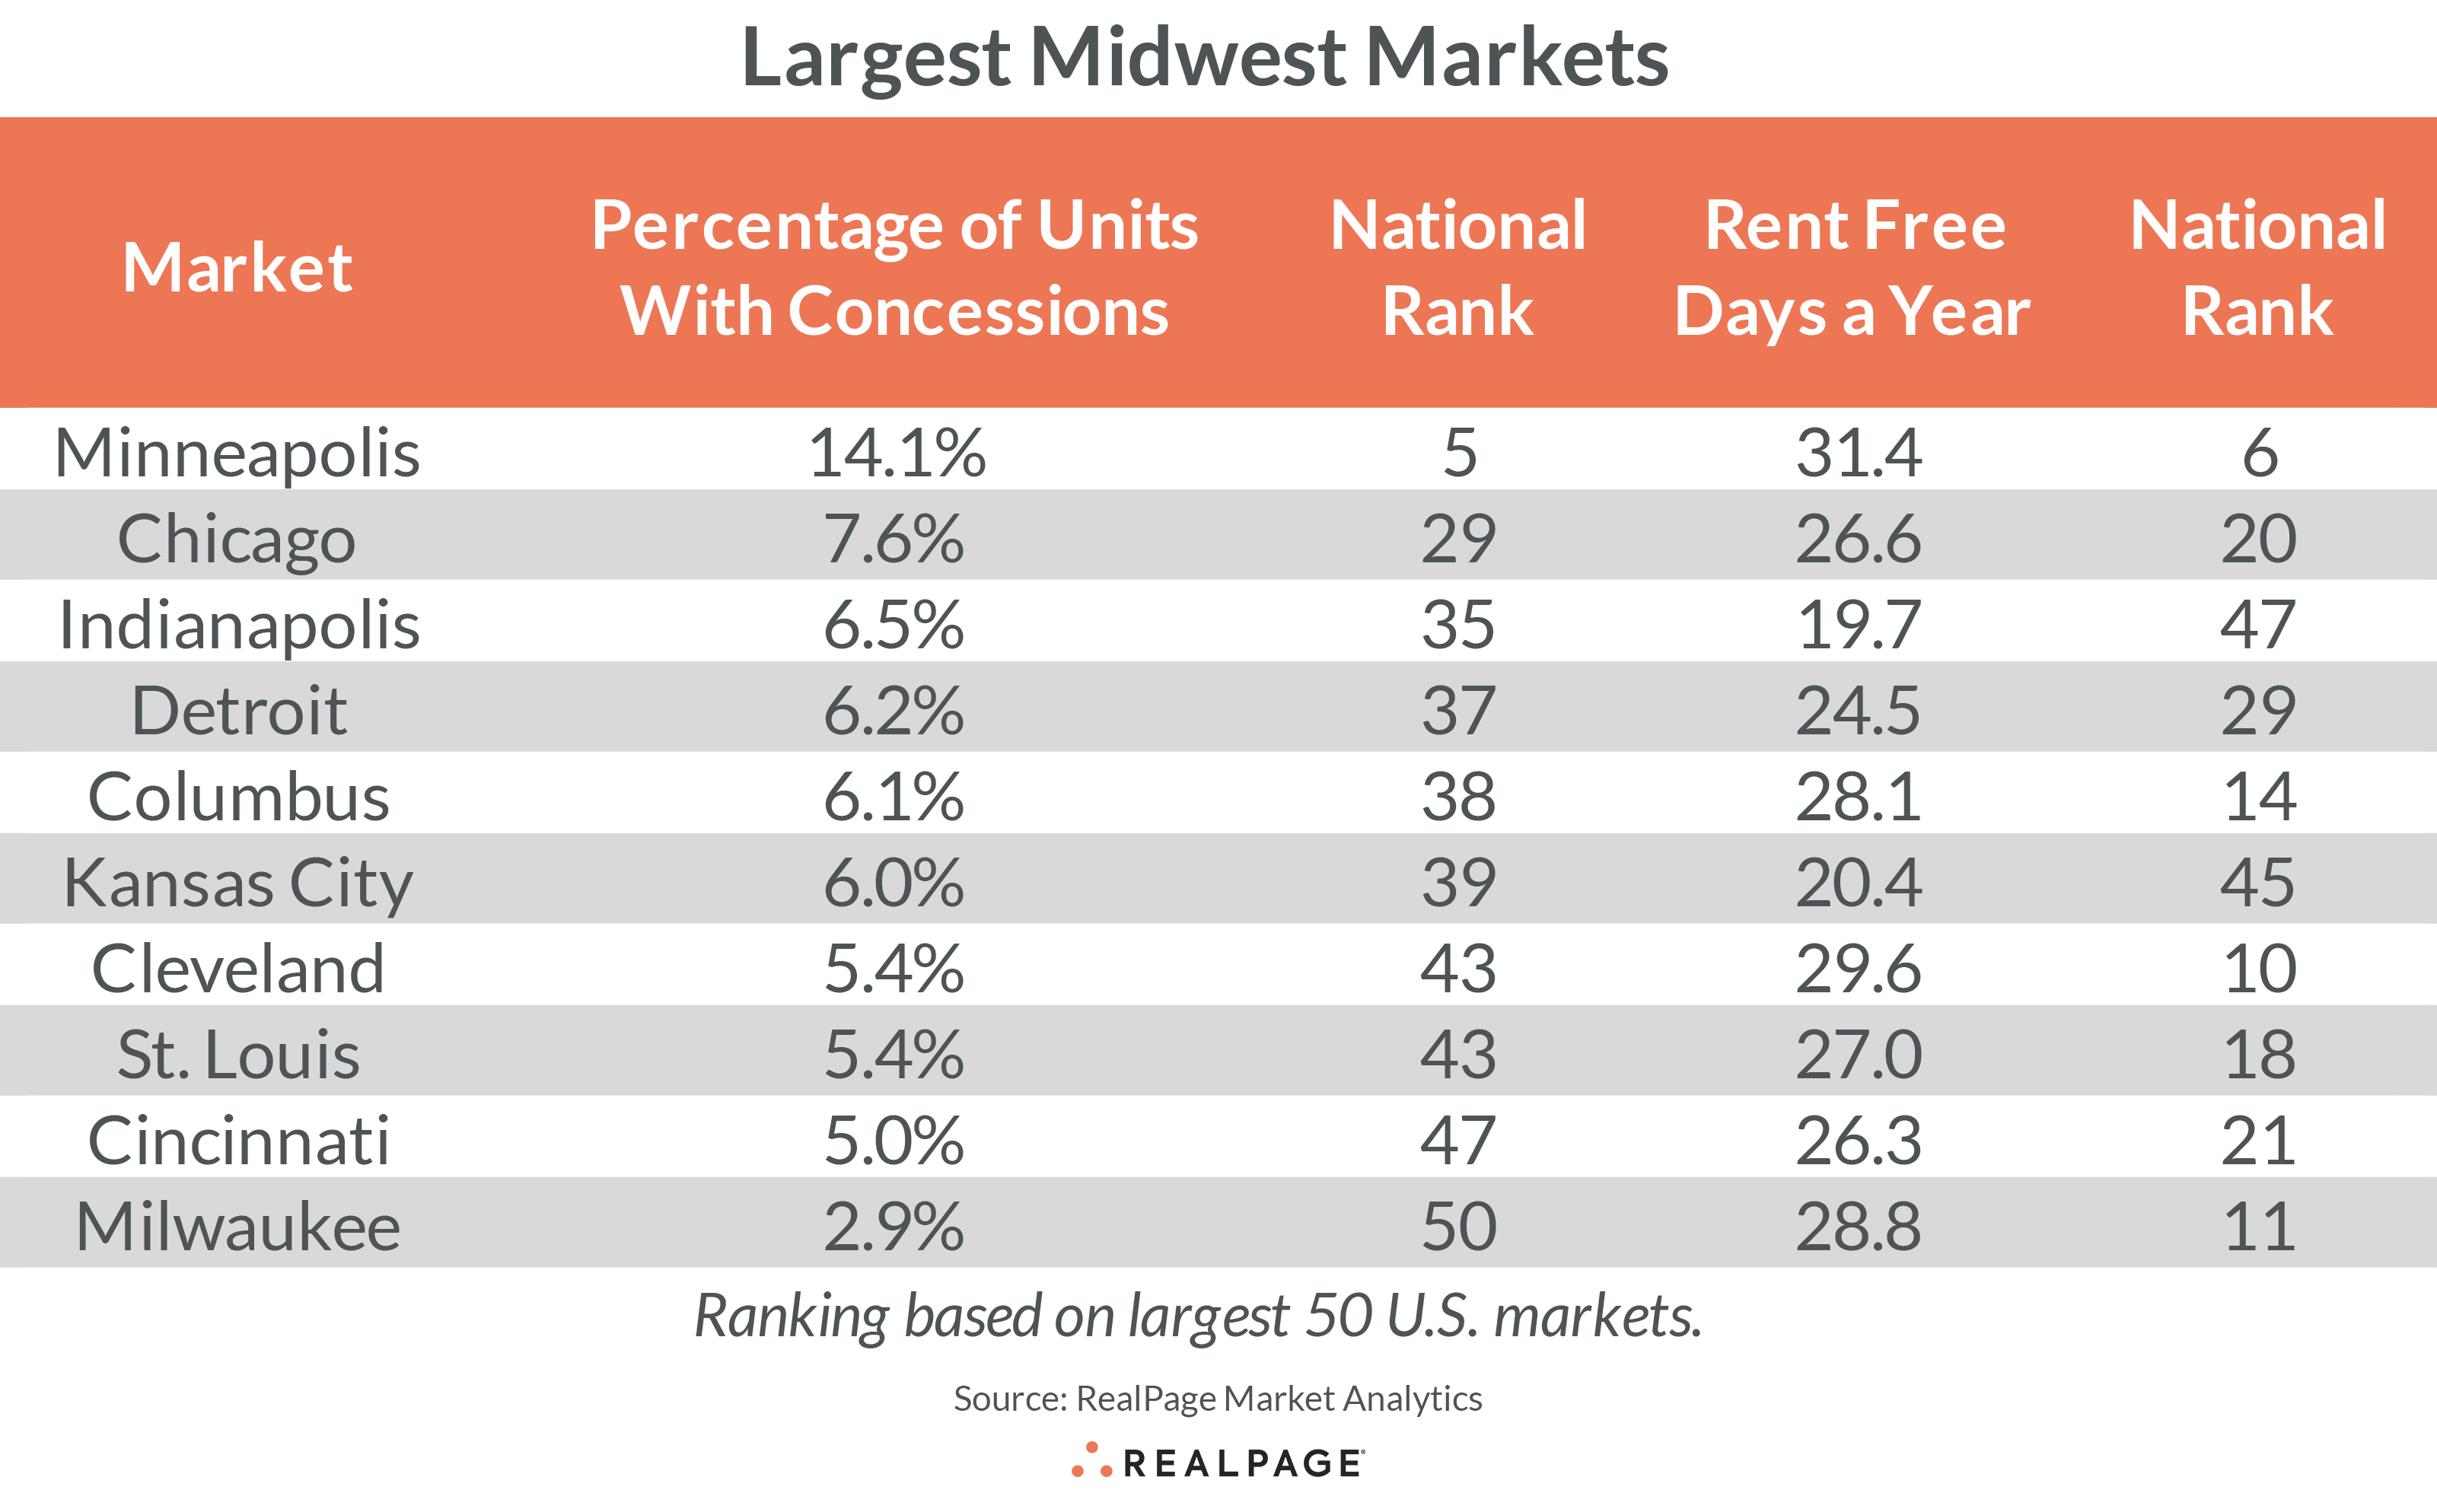
Prior to the pandemic, concession usage in Minneapolis registered well below the U.S. and Midwest norms. However, over the past three years, that trend has reversed course. As of August 2023, operators in Minneapolis were offering concessions on 14.1% of stabilized units in the market, according to RealPage Market Analytics. That rate was more than double the Midwest average of 6.5% and well above the national norm of 9%. In addition, Minneapolis’ recent concession usage was the largest among the top 10 Midwest markets and ranked fifth among the nation’s top 50 markets.
Minneapolis is the outlier among the 10 largest Midwest markets. The other nine large markets in the Midwest ranked in the bottom half of the top 50 markets nationally, with the number of units offering concessions in those Midwest markets ranging from 2.9% in Milwaukee to 7.6% in Chicago.
Of the units with concessions in Minneapolis, operators are offering an average discount of 8.6% off the effective asking rent, equating to 31.4 days of free rent per year. That’s well above the U.S. average (26.3 days) and Midwest region norm (25.3 days).
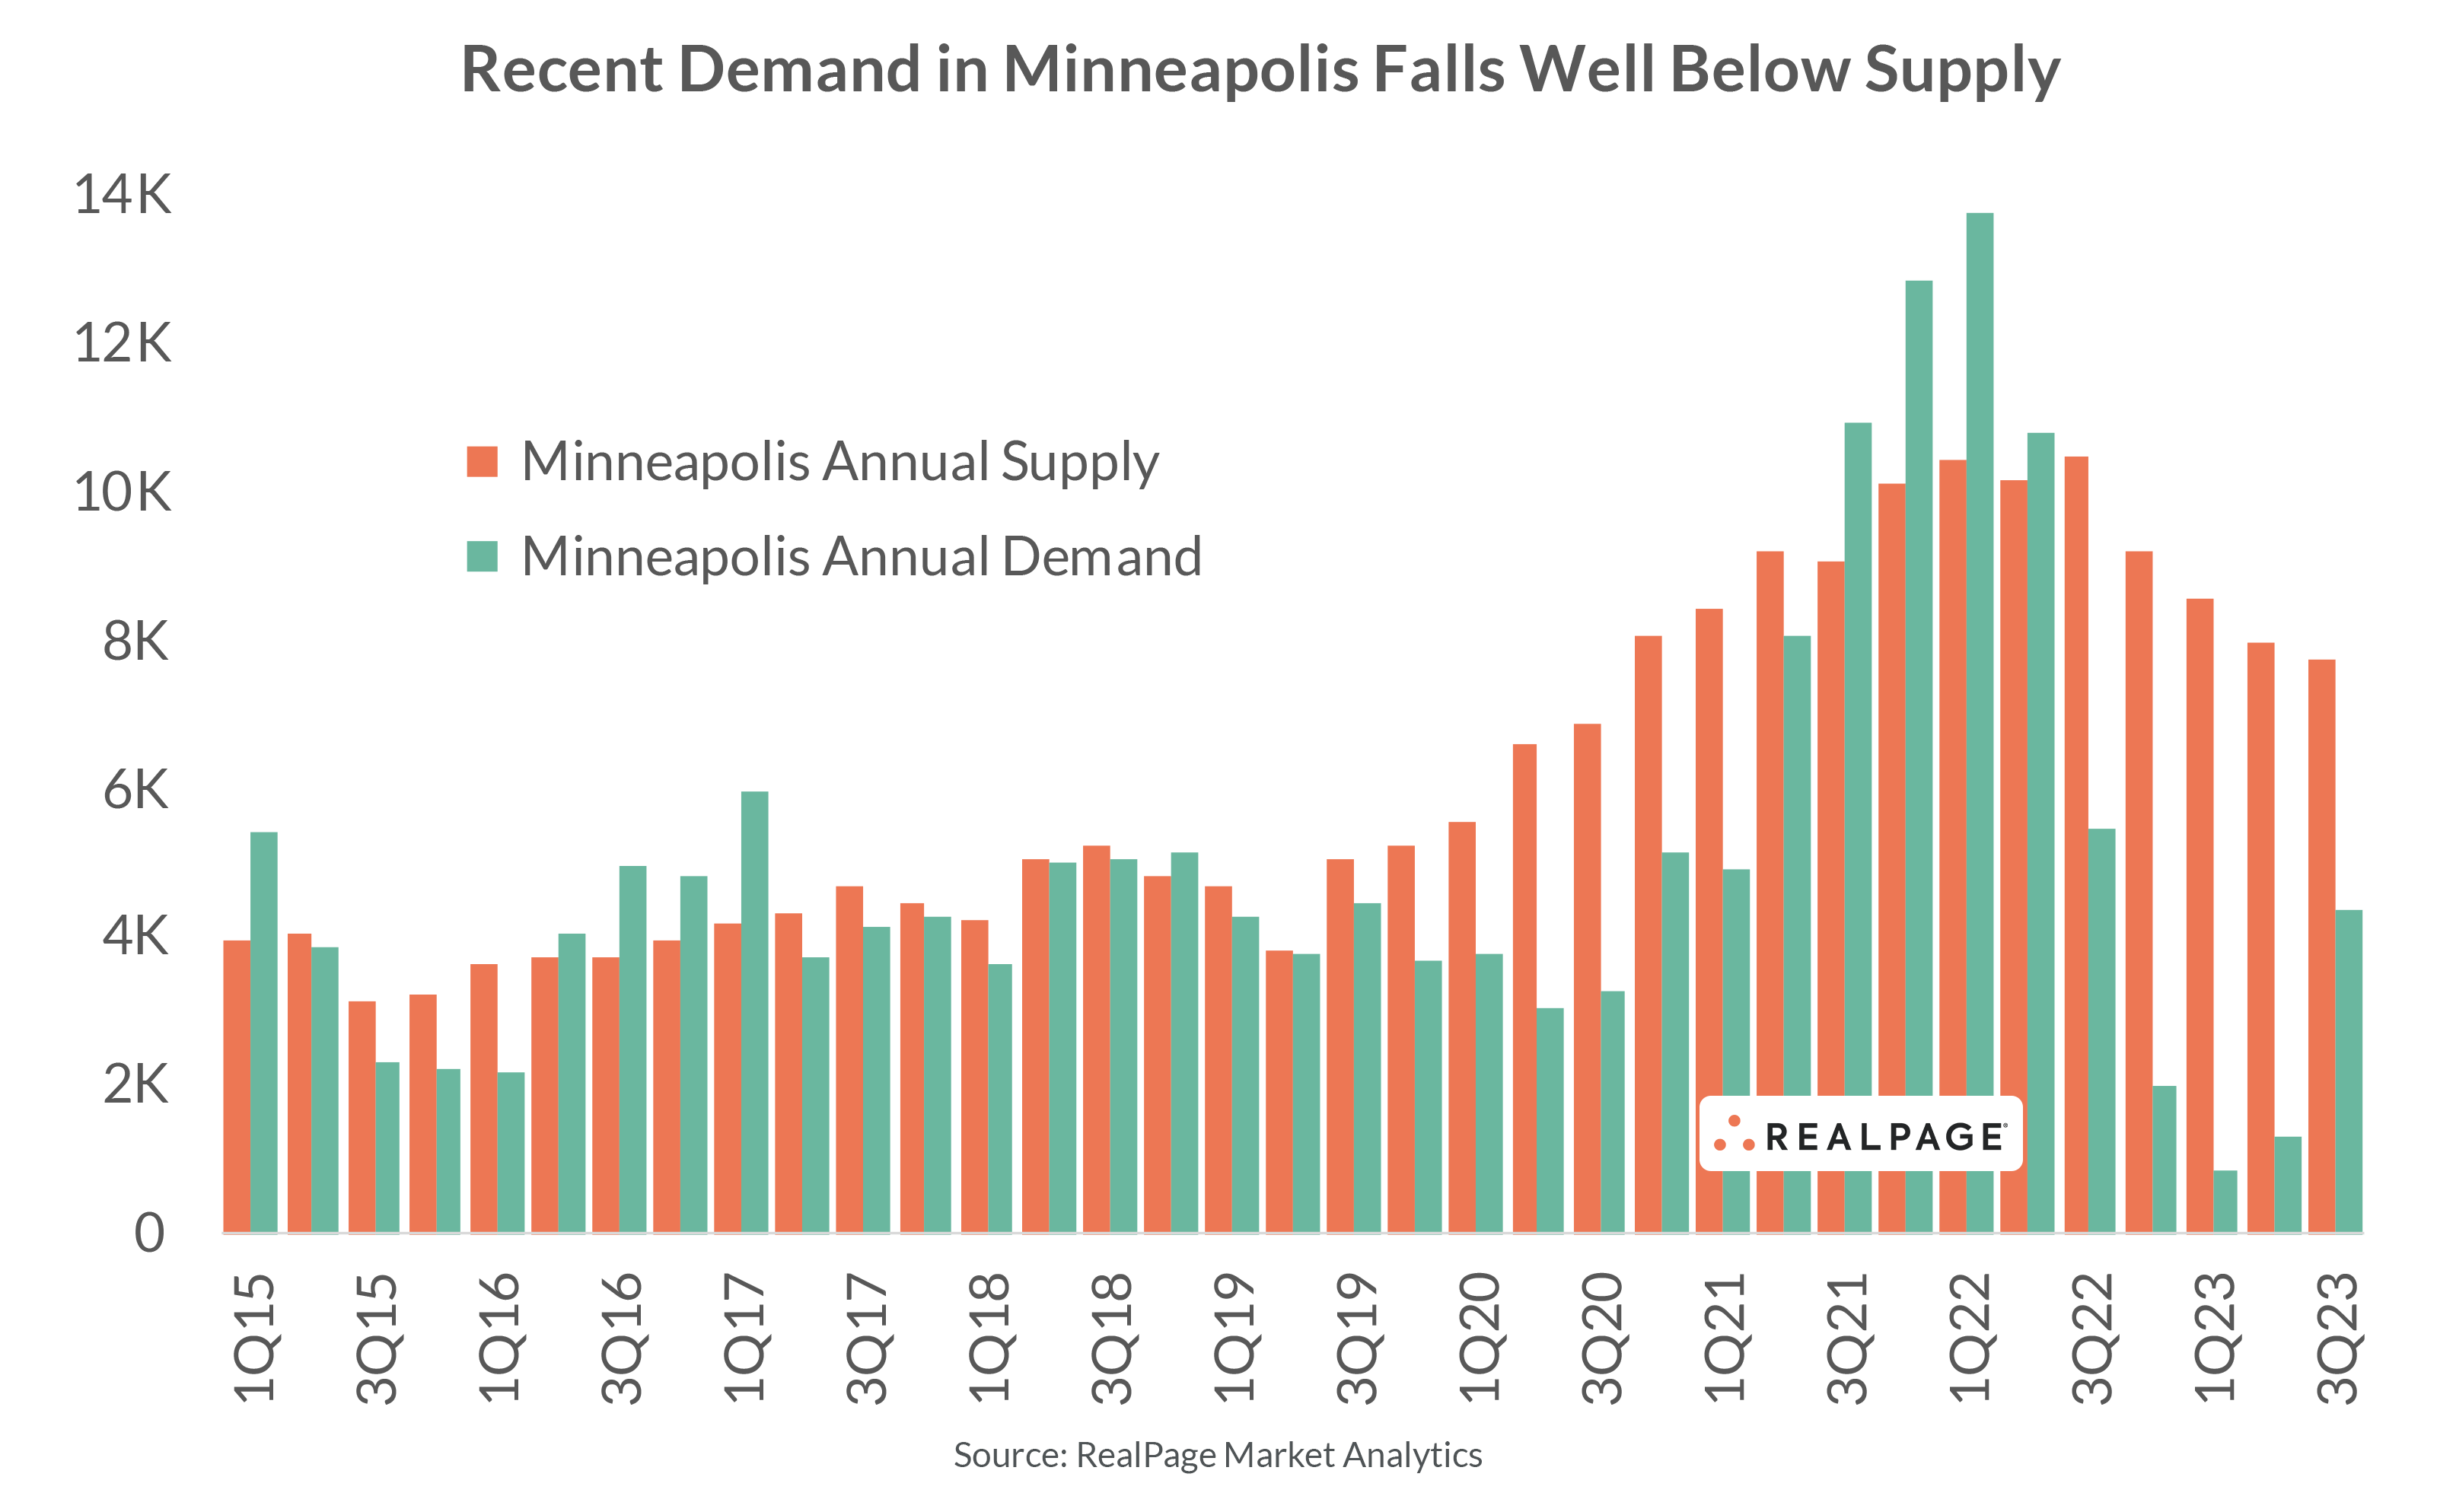
Driving the use of discounts in Minneapolis is weakened occupancy amid elevated supply levels. Over the past three years, an average of roughly 9,100 units delivered annually, while concurrent demand totaled 6,700 units. Prior to the pandemic, demand and supply in Minneapolis mostly balanced, with an average annual supply load of about 4,300 units and demand averaging around 4,200 units annually.
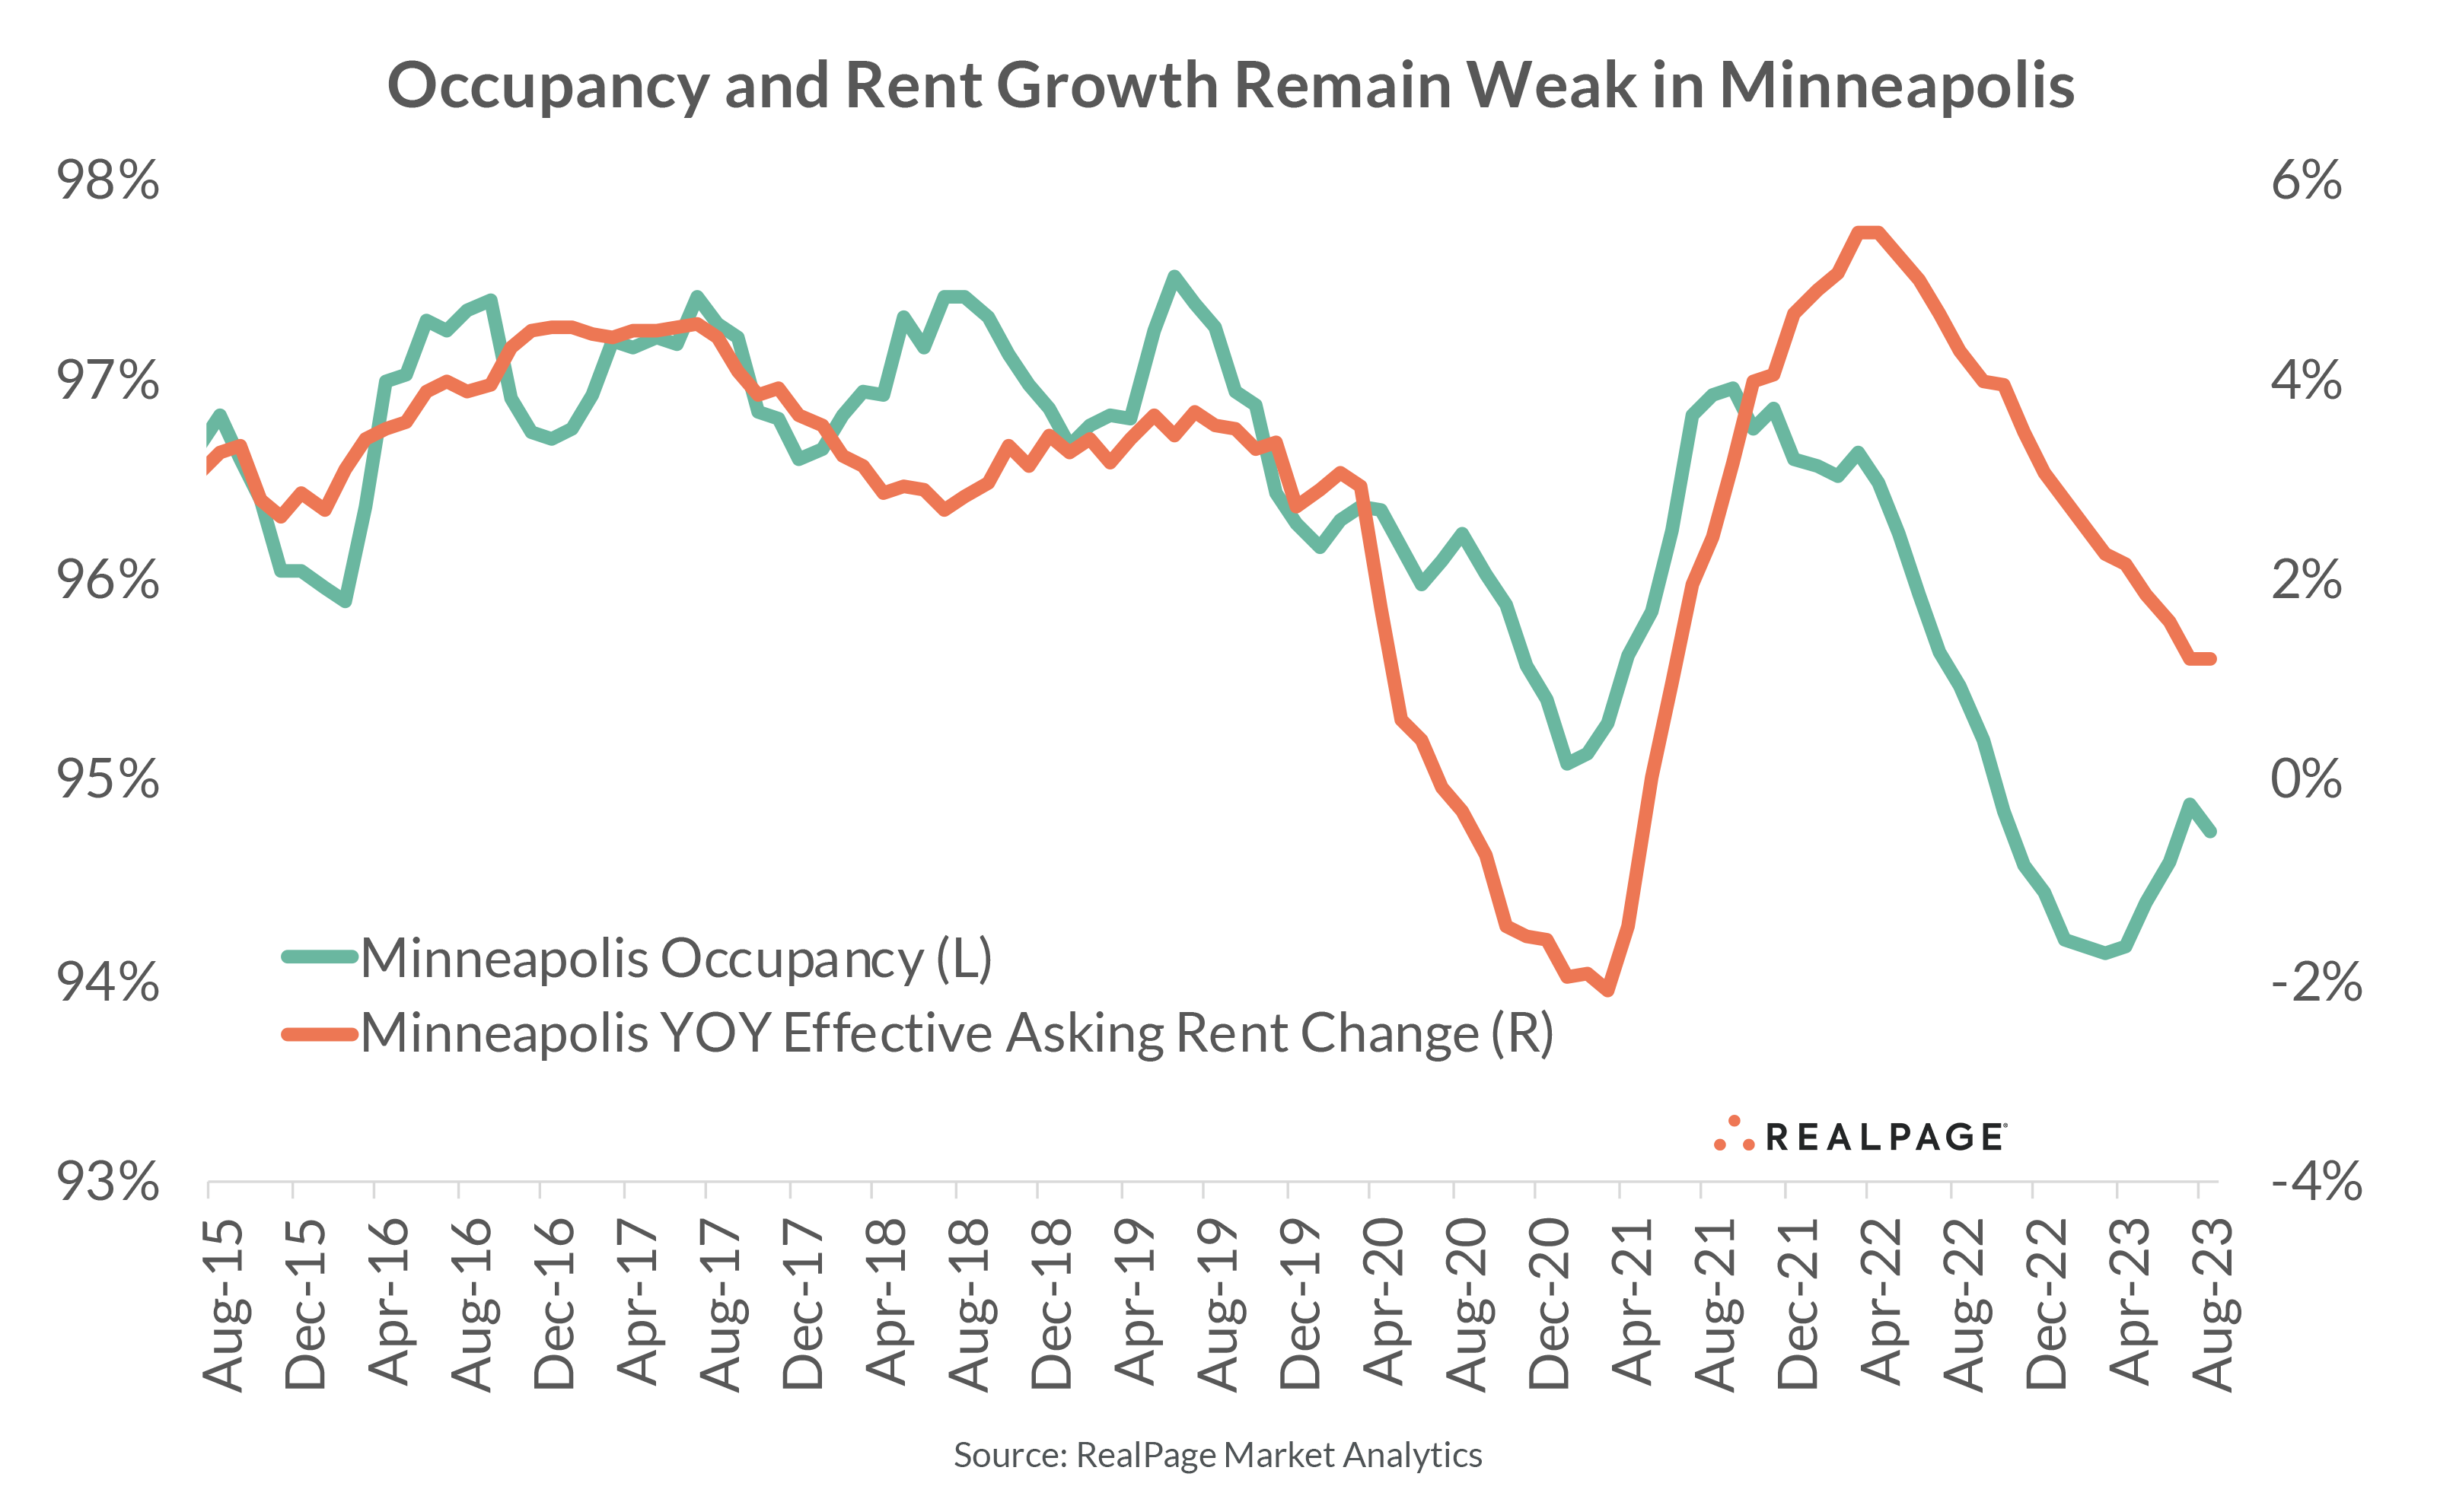
As of August 2023, occupancy in Minneapolis registered at 94.7%. Although that’s an improvement from the recent low of 94.1% just five months earlier, it’s well below the pre-pandemic average from 2015 to 2019 of 96.9%.
With occupancy at recent lows, annual rent growth has cooled. After reaching a decade high of 5.5% in March and April 2022, annual rent growth has been easing. In the year-ending August 2023, Minneapolis recorded a year-over-year rent increase of just 1.2%, well below the pre-pandemic average annual growth rate of 3.5%.
Note: Concessions include any offered rental concession (such as one-month free rent) and do not include marketing giveaways excluded from a rent roll, such as gift cards.


