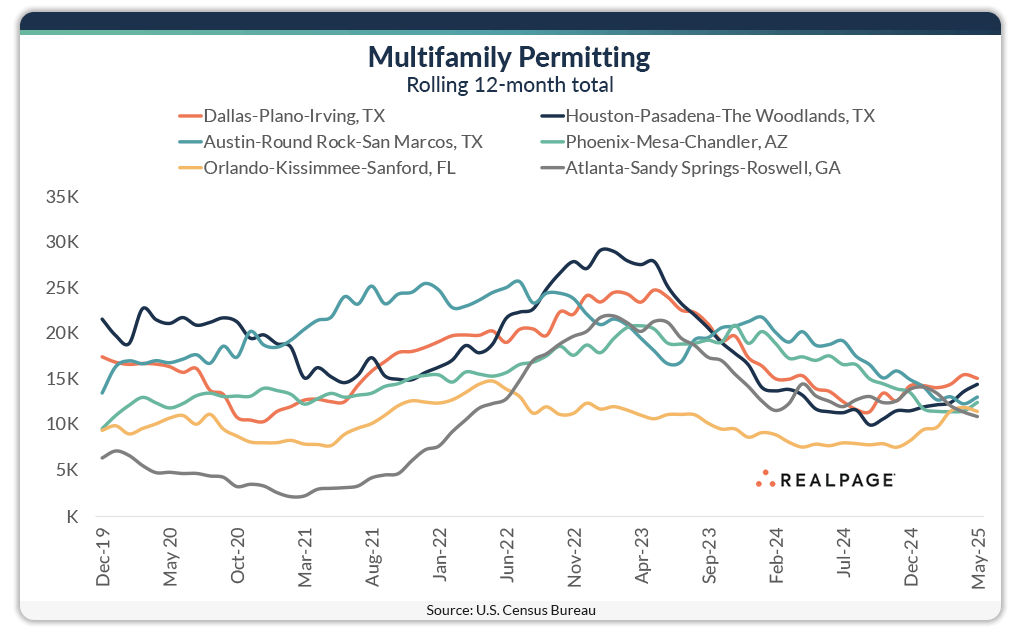
Real estate moves in cycles with periods of growing or slowing in between peaks and troughs. We have been in a period of slowing multifamily permitting for at least the past two years and nationally, we appear to have reached this cycle's trough.
Individual markets can and do have different cycle timing, but it also appears that many have troughed for multifamily permitting as well. Charting six of the top 10 markets for multifamily permitting shows a clear pattern of peaks and valleys, with most reaching their peaks in 1st quarter 2023. Austin and Orlando hit their peaks in 2022 but maintained relatively high levels of permitting for longer periods.
Two of the nation’s top apartment development markets – Dallas and Houston – have seen their annual multifamily permitting totals increase each month since September 2024. Orlando began increasing in November. Austin and Phoenix didn’t begin slowing until early 2024 and may not have reached bottom yet, but both had slight upticks in their annual permitting totals in May compared to April. Atlanta is another market where the annual permitting trend is difficult to call a trough.
Given the current development environment concerning costs, lending availability and market uncertainty, the length and depth of this cycle’s trough remains to be seen.
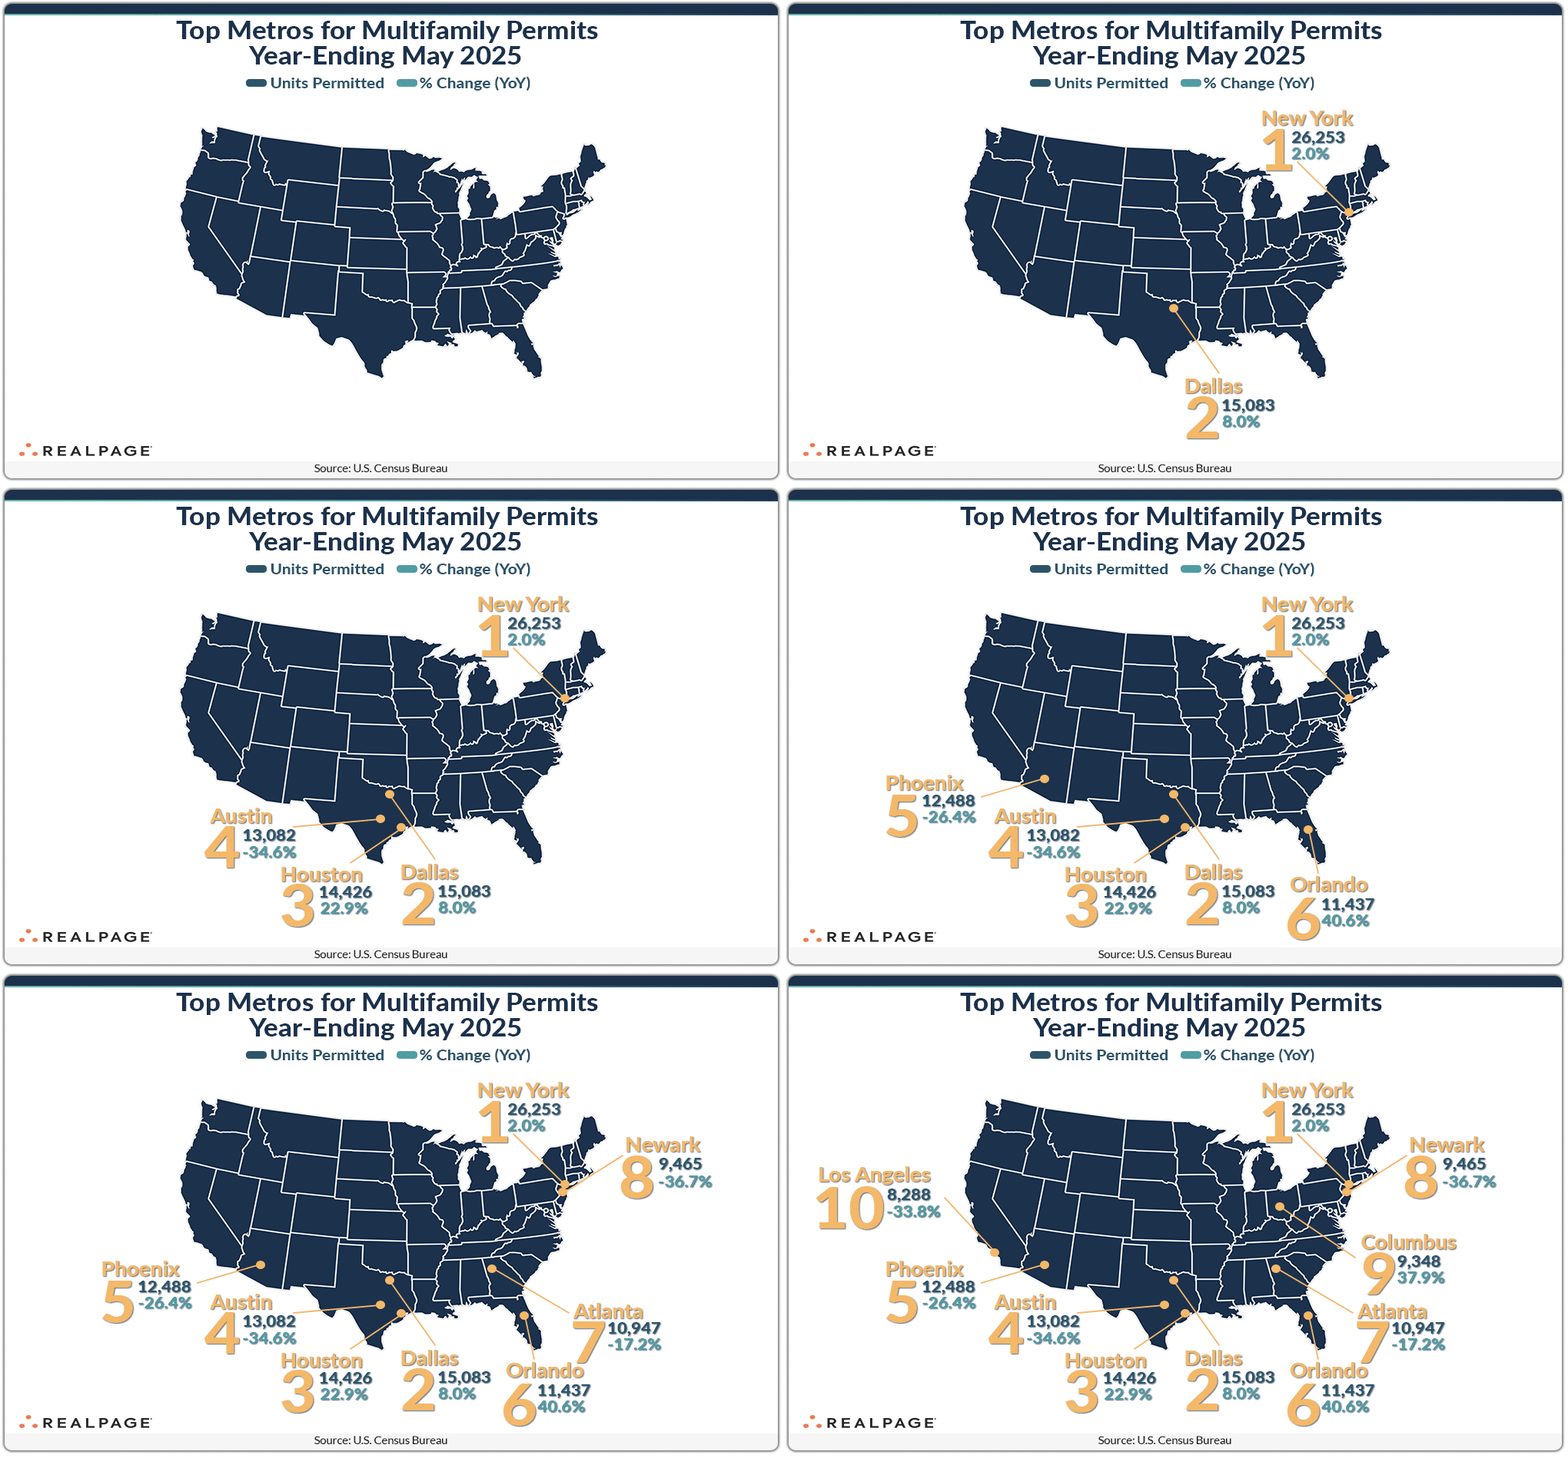
All but one of April’s top 10 markets for multifamily permitting returned in May, with Newark replacing Washington, DC on the list. Note that this month RealPage is using the most recent Core-Based Statistical Area (CBSA) names and geographic definitions based on the 2023 Office of Management and Budget delineations.
In some cases, new CBSAs created in the 2023 delineations (like Kiryas Joel-Poughkeepsie-Newburgh, NY) were re-combined with their former metros (New York-White Plains) for consistent historical comparisons. Based on the current CBSA geographic delineations, Newark would have placed among the top 10 in recent months anyway.
New York continued to lead the nation for multifamily permitting with more than 26,000 units permitted, followed by Dallas, Houston and Austin with about 13,000 to 15,000 units permitted each. Phoenix, Orlando and Atlanta again followed this month’s top four markets with around 11,000 to 12,000 units permitted.
Newark has maintained an annual permitting total of more than 9,000 units for the past five months while Columbus has increased their permitting total by almost 1,300 units in just the past month. Los Angeles rounded out May’s top 10 list with about 8,300 units permitted, a 34% decrease from last May.
Other markets with significant year-over-year decreases in annual multifamily permitting in the year-ending May were Washington, DC (-5,322 units), Tampa (-3,965 units), San Jose (-3,094 units), Miami (-2,938 units), Nashville (-2,687 units), San Diego (-2,288 units) and Salt Lake City (-2,082 units). Ten other markets had decreases in permitting of 1,000 units or more.
In addition to Orlando, Houston, Newark and Columbus, markets with significant year-over-year increases in multifamily permitting include Chicago (+2,112 units), Fayetteville-Springdale-Rogers, AR (+1,699 units), Anaheim (+1,448 units), Bridgeport-Stamford-Danbury, CT (+1,385 units), Savannah (+1,372 units), Richmond (+1,334 units), Des Moines (+1,285 units) and Augusta, GA (+1,237 units).
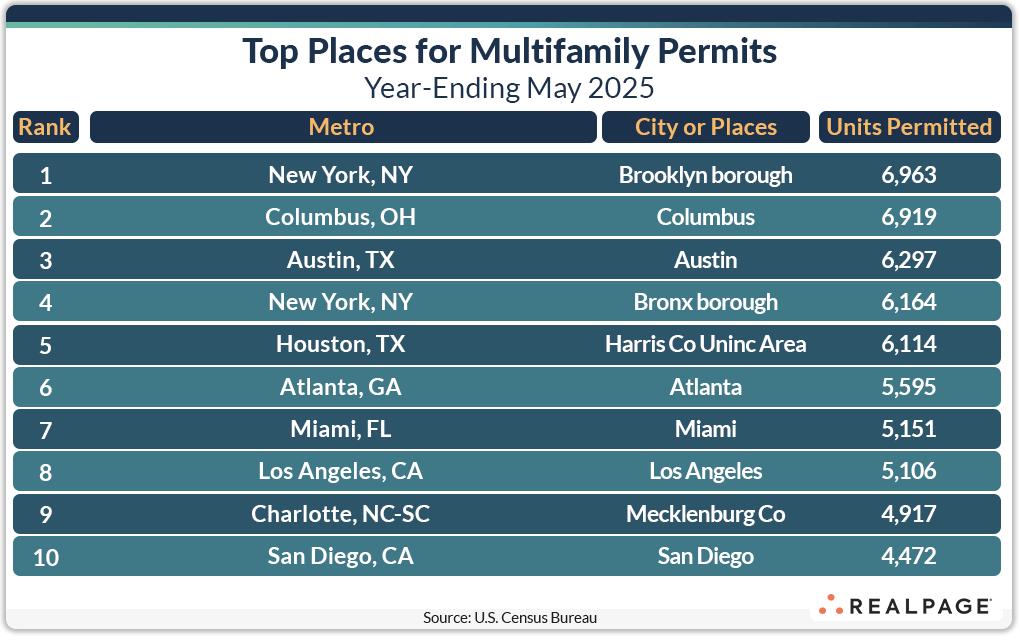
Below the metro level, all of last month’s top 10 permit-issuing places returned to this month’s list with four remaining in the same place. The list of top individual permitting places (cities, towns, boroughs and unincorporated counties) generally include the principal city of some of the most active metro areas.
Last month’s #1 – the borough of Brooklyn – returned at the top of May’s list but reduced their annual multifamily permitting by about 300 units. The cities of Columbus and Austin each moved up, increasing permitting totals by more than 1,000 units each over last month. The Bronx borough moved up three spots with an almost 1,000-unit increase and Unincorporated Harris County (Houston) remained in the #5 spot.
The cities of Atlanta, Miami and Los Angeles permitted around 5,000 units each for the year, placing them in the next three spots, followed close by Mecklenburg County (Charlotte). The city of San Diego returned in the #10 spot with almost 4,500 units permitted.
Although their central city or permitting entity placed among the top 10 permitting places, San Diego and Charlotte’s metro areas ranked only #18 and #19 among the top metros. Conversely, the core cities of Dallas and Houston ranked #16 and #17 on the permitting places list but are in the top three for metros.
This post is part of a series by RealPage Senior Real Estate Economist Chuck Ehmann analyzing residential permits and starts data from the U.S. Census Bureau. For more on this data, read previous posts in the Permits series.


