Class A Apartments Commanding 28% Premium Over Class B Prices

The growing gap – in addition to the sheer difference – between Class A rents and Class B rents has been one of the investment theses that has supported immense investment activity in middle market Class B product.
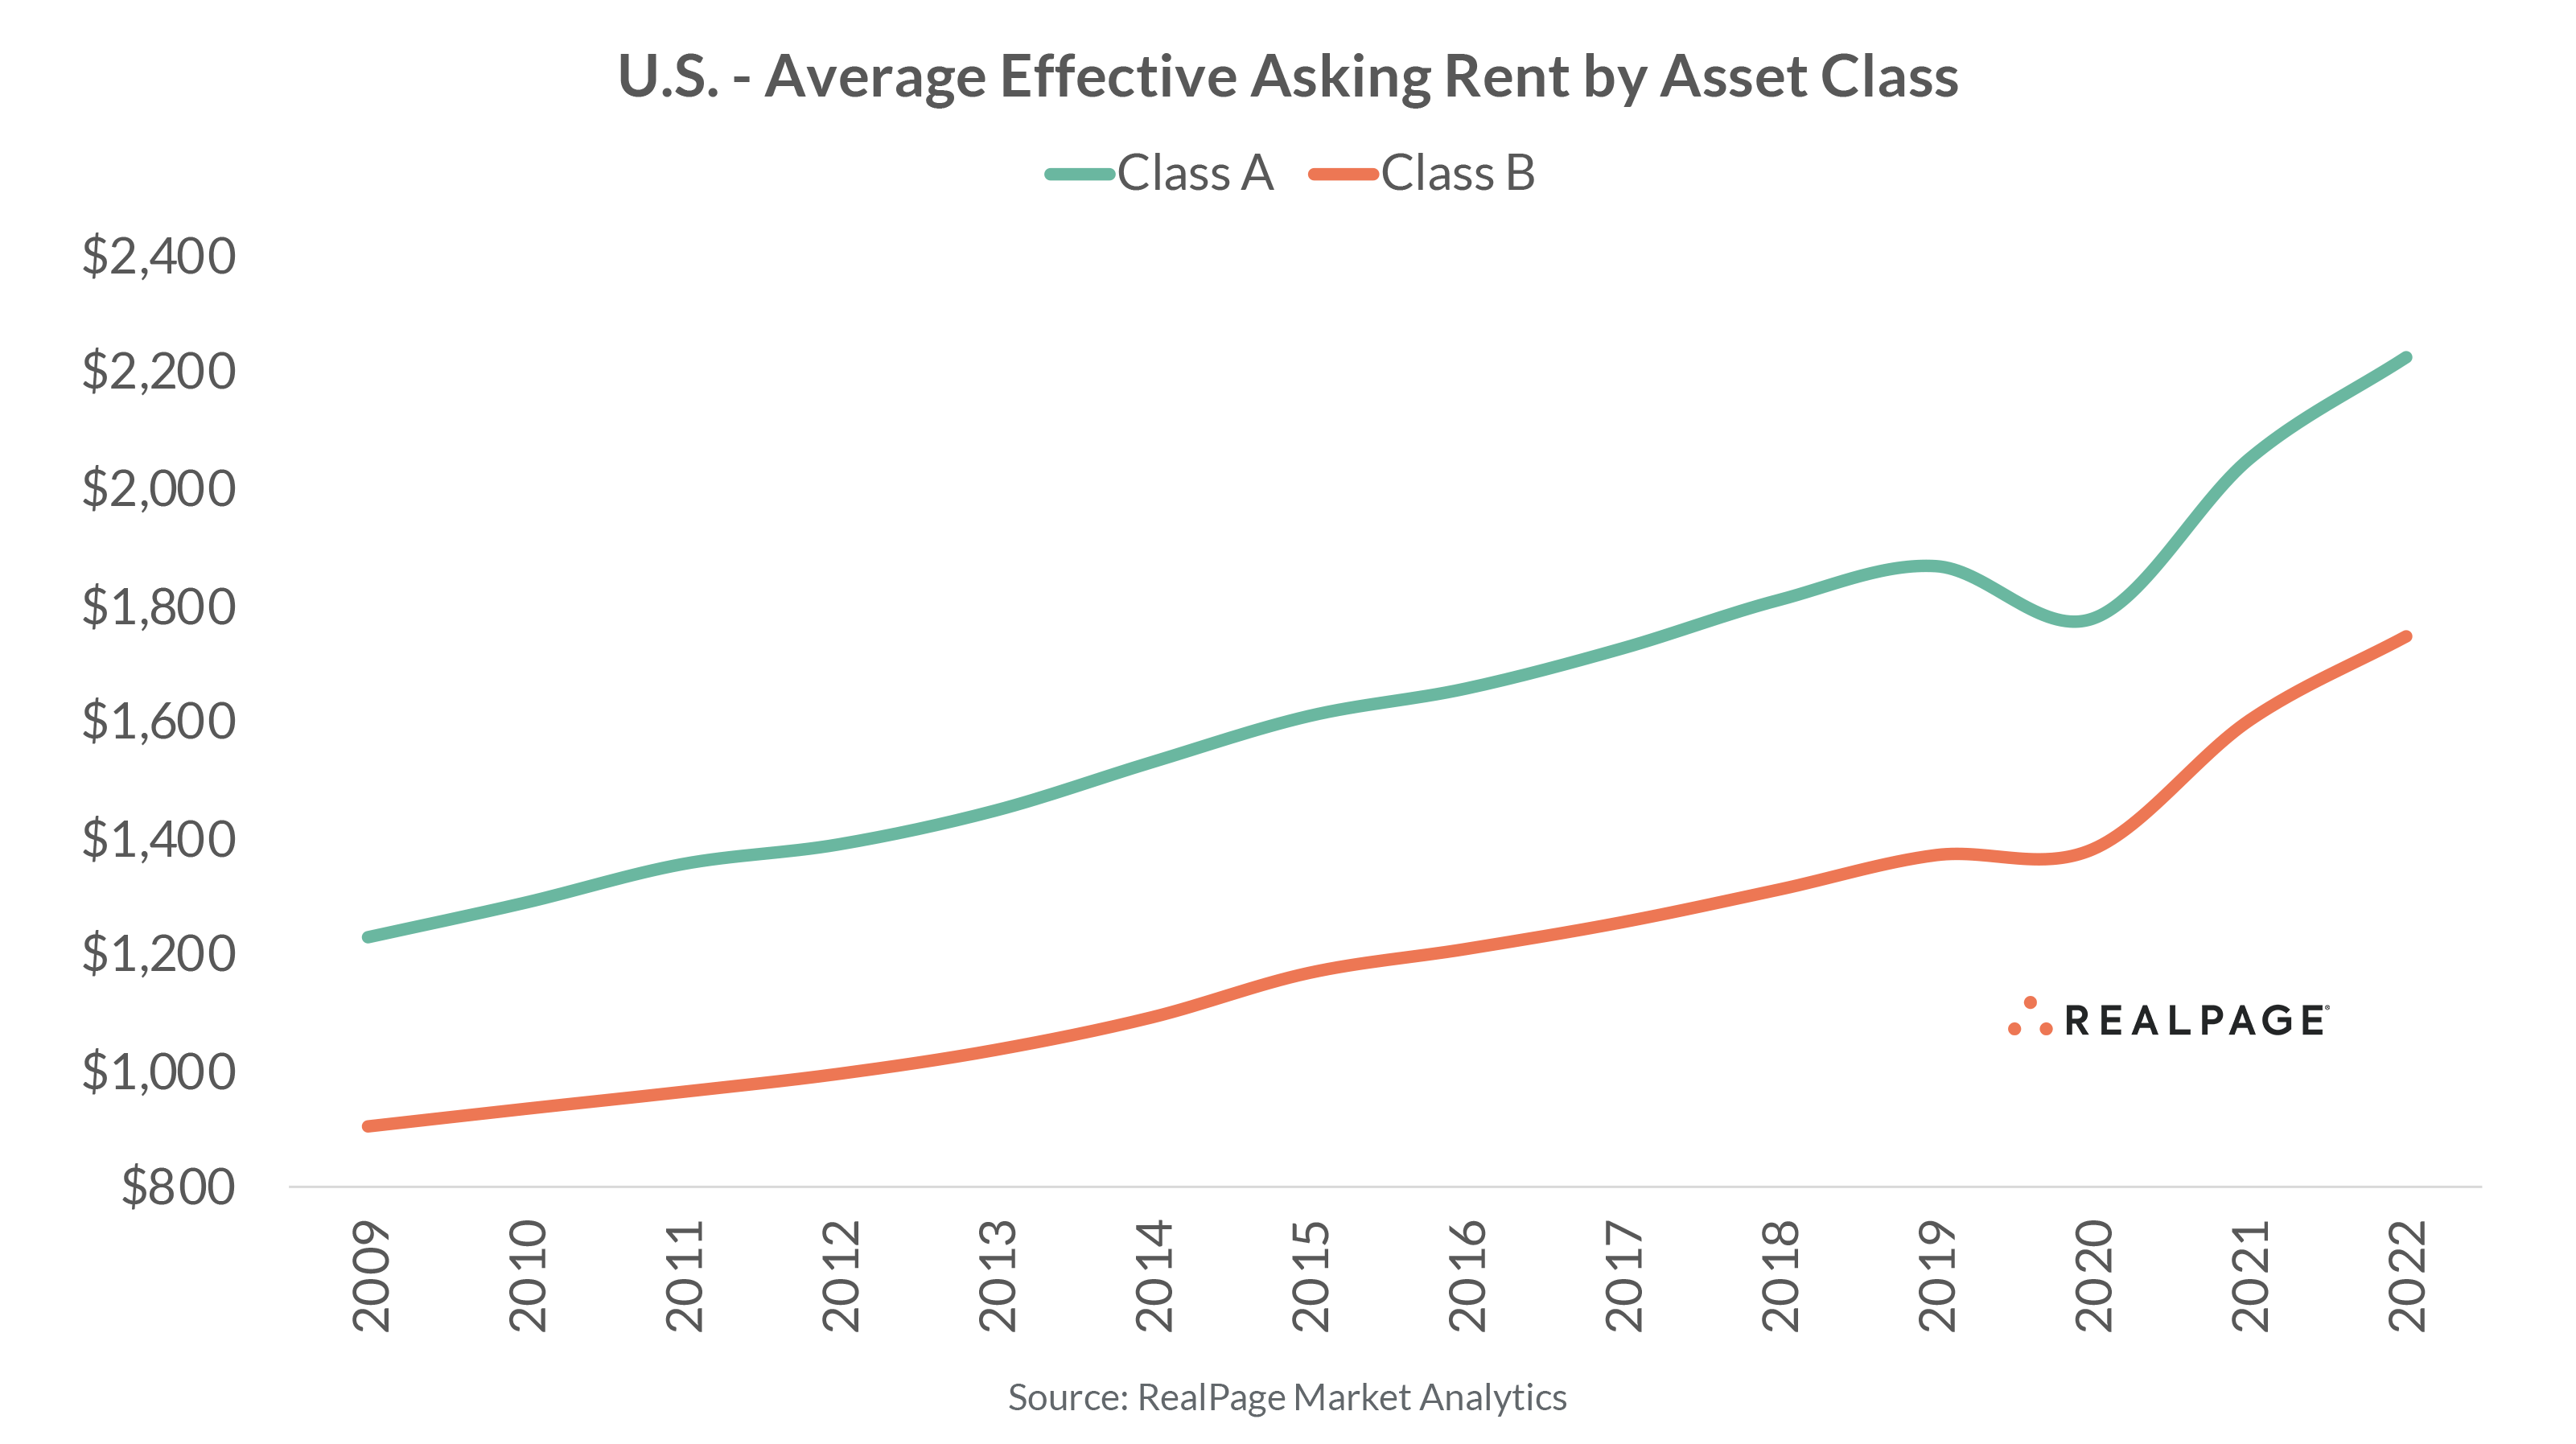
The investment thesis itself is fairly simple and straightforward. In theory, Class B apartments are insulated from the pressure of new supply delivering. For instance, the average stabilized Class A rent equaled $2,227 at the national level in 4th quarter 2022, according to data from RealPage Market Analytics. Class B rents, meanwhile, averaged $1,748.
That difference between the average Class A property and the average Class B property equates to a significant $479 difference per month. Not only is that nominally large, but the difference between Class A rents and Class B rents comes out to a 28% premium.
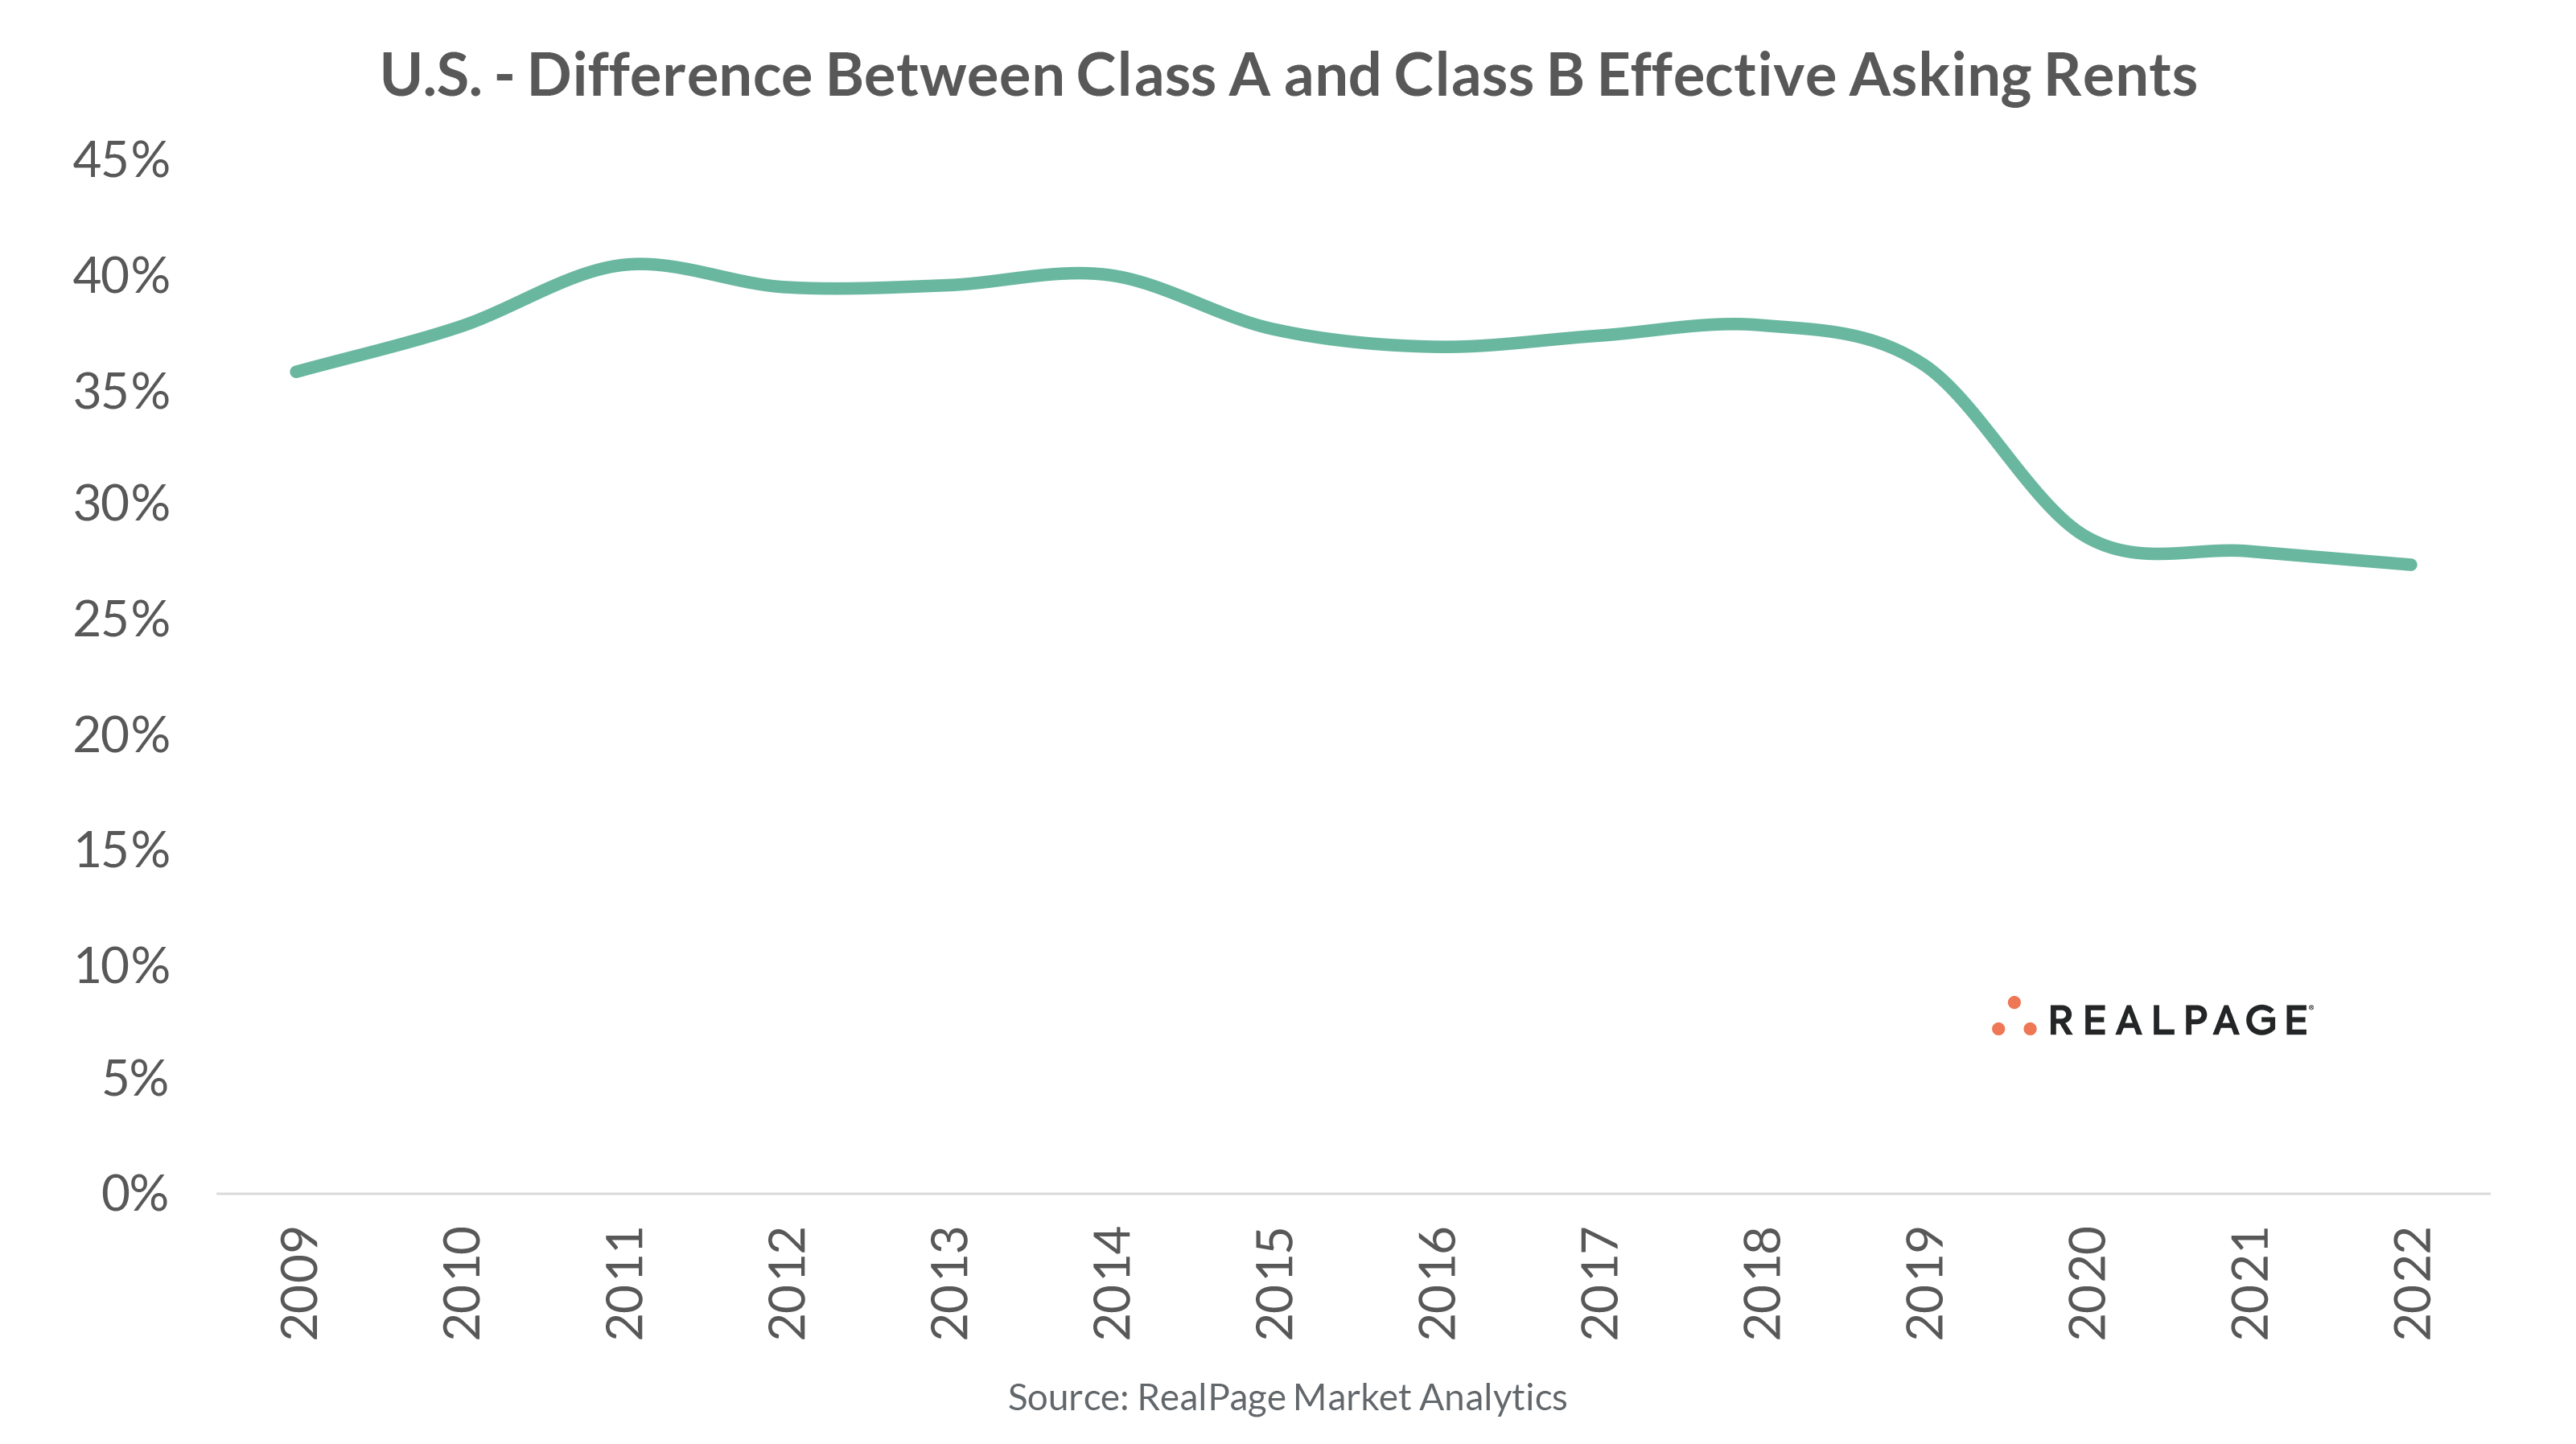
Interestingly, the spread between Class A and Class B rents (on a relative basis) has actually started to close in recent years, coming down from a peak of a 40% premium in the early 2010s cycle. Still, the end result is similar: that is, there is a hefty difference between average Class A rents and Class B rents.
From that perspective, the investment thesis that Class B housing is insulated from Class A product holds largely true. All else being equal, the average Class A property would have to offer a substantial concession to pull a Class B household into the Class A product tranche.
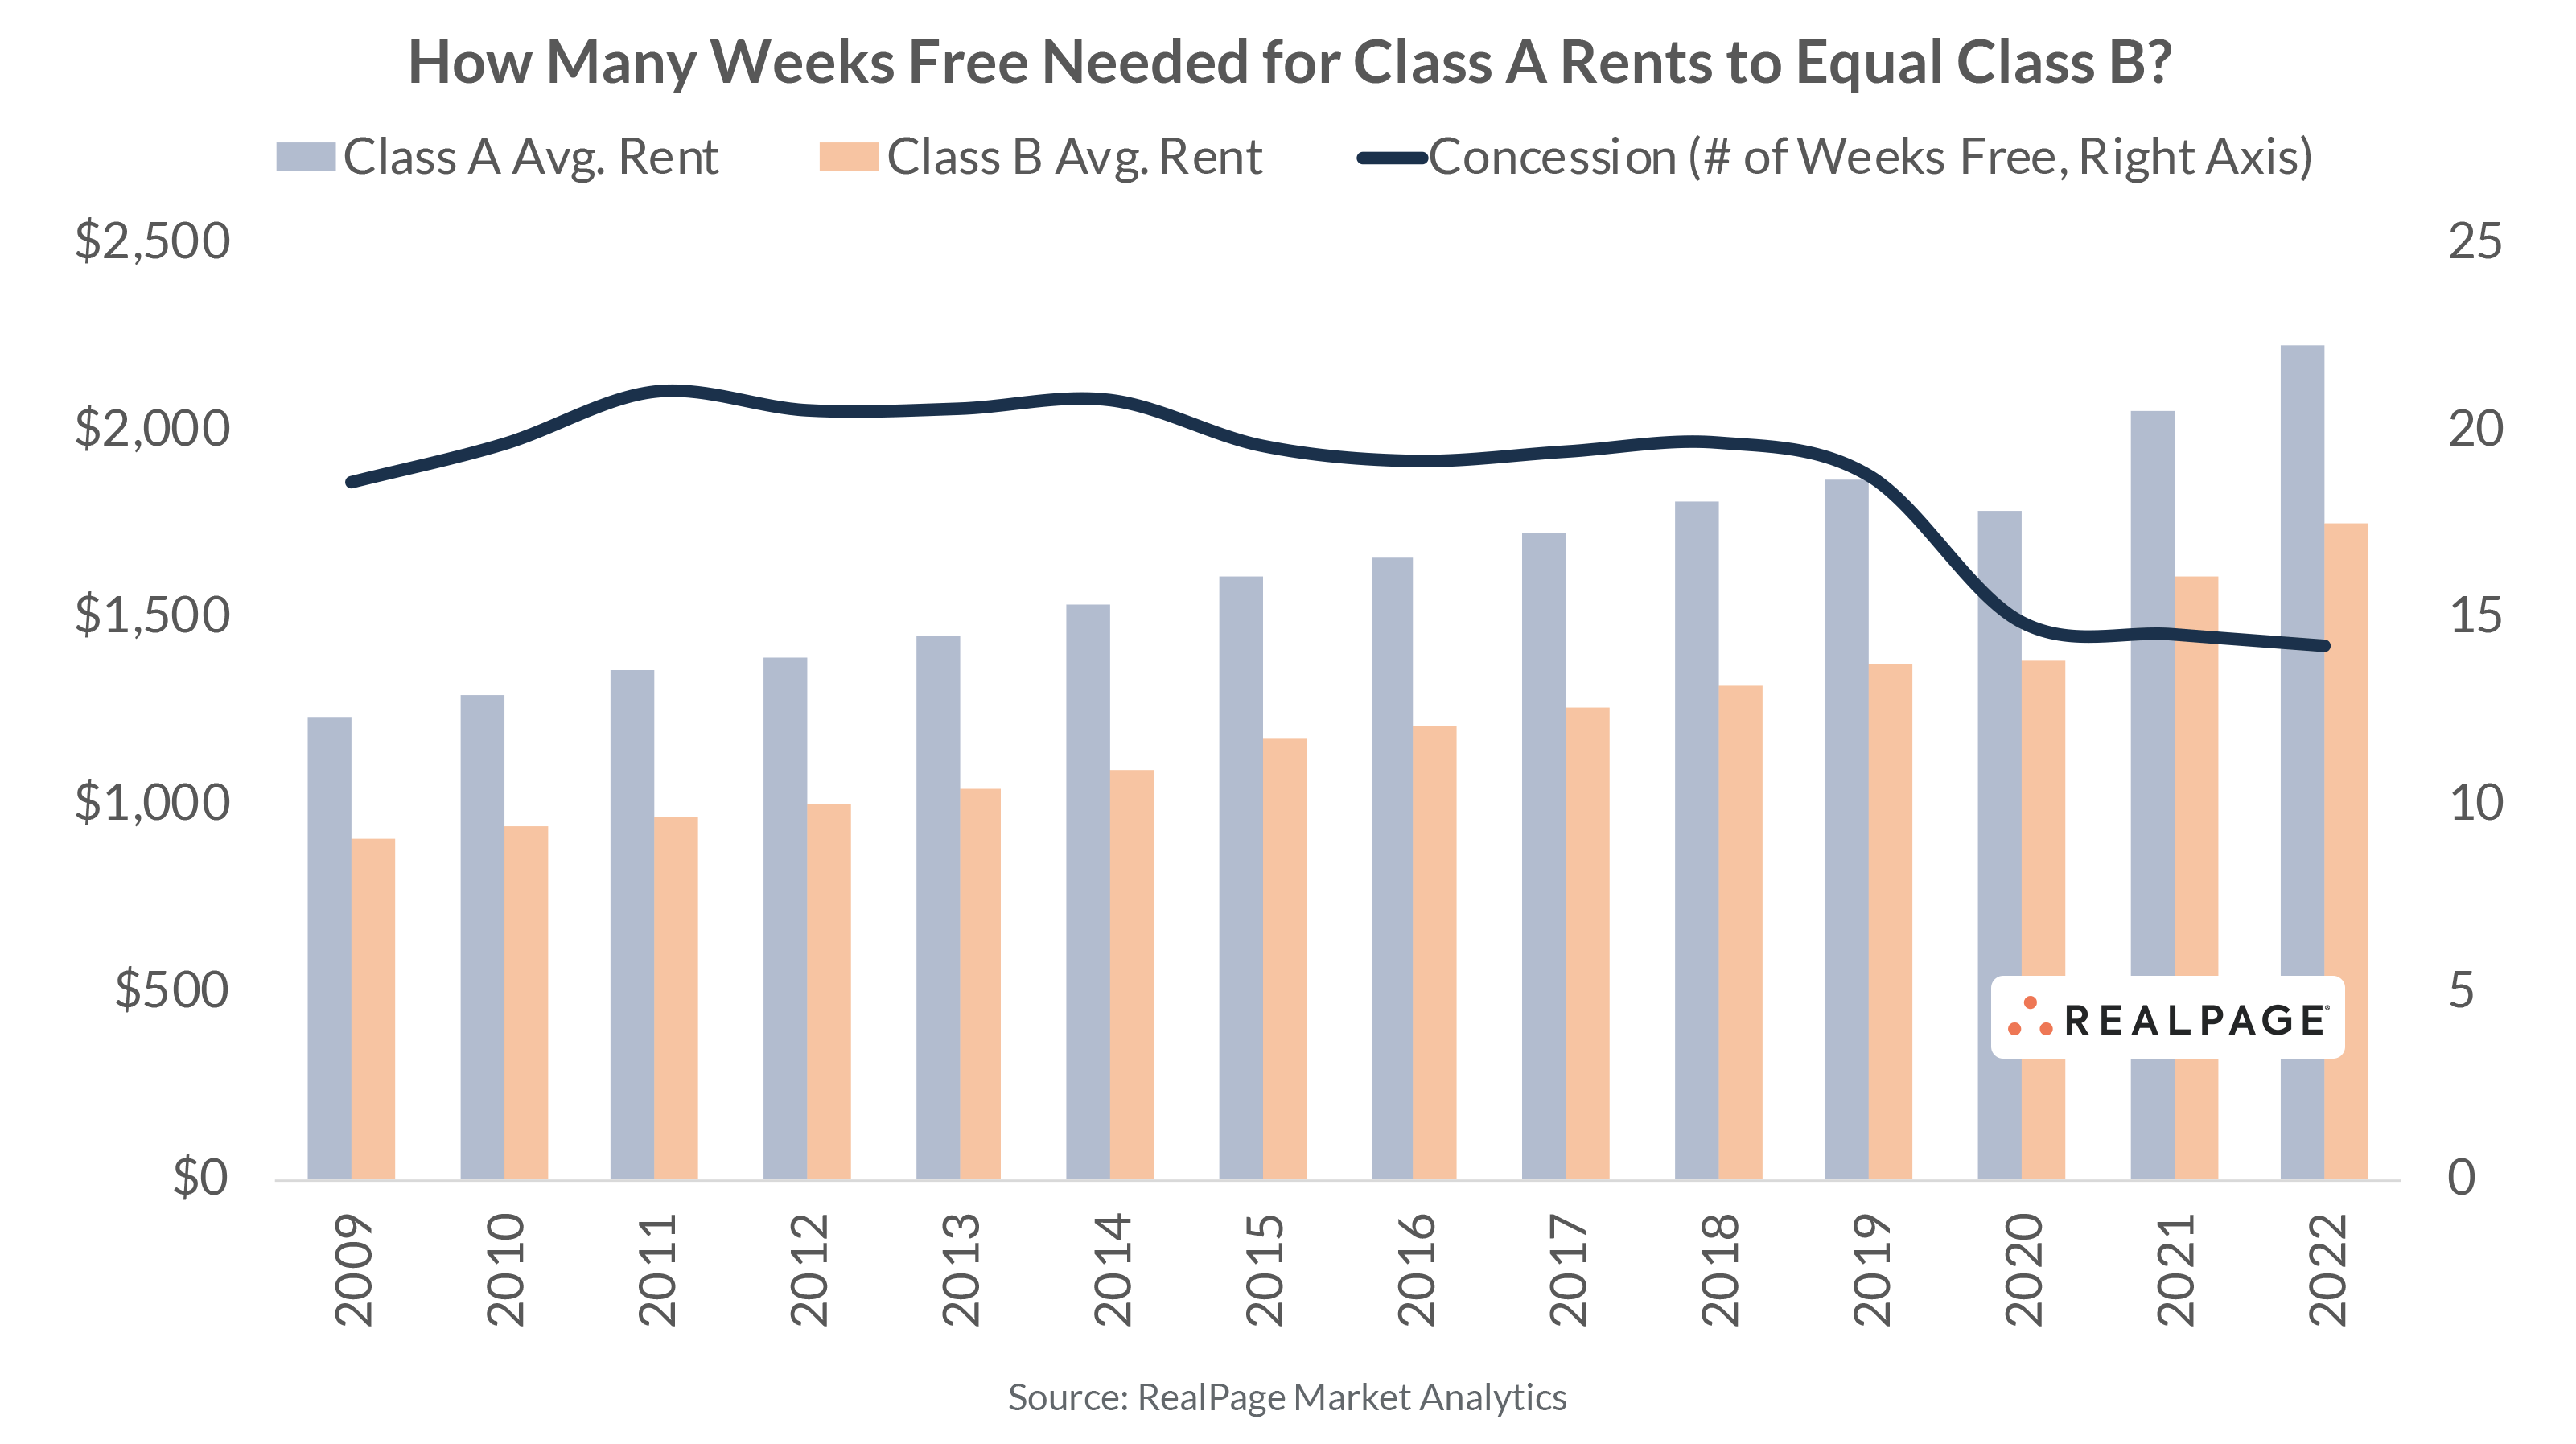
The depth of concession is quite drastic. For a Class A property to equal the average Class B rent across the U.S., about 14 to 15 weeks free would be required as a discount (or a little more than three months free).
Only in extenuating circumstances has such a deep concession been offered, and almost exclusively site-specific instances at that. Of the nearly 52,000 properties surveyed by RealPage as of 4Q22, just six properties were offering a concession this deep. And never more than 1.5% of the nation’s stabilized apartment stock has offered a concesssion this deep with the maximum of 229 properties offering at least 14 weeks free back in 2009 (1.5% of the total housing stock at that time).
With lease-up pressure mounting through 2023 and into 2024, the story for Class B apartments remains fairly strong. But as is typical, the national storyline doesn’t necessarily highlight localized differences. And that’s extremely important in this instance, as the difference between Class A rents and Class B rents can vary at the submarket level.
This could be a key indicator in the coming months, especially in submarkets where construction volumes are particularly aggressive. It’s not uncommon for lease-up properties to offer one month free in an effort to build their renter base as quickly as possible. From that perspective then, there are select neighborhoods across the country where stabilized Class B properties could actually be at risk of losing renters to Class A assets in the event that concessions begin to increase.
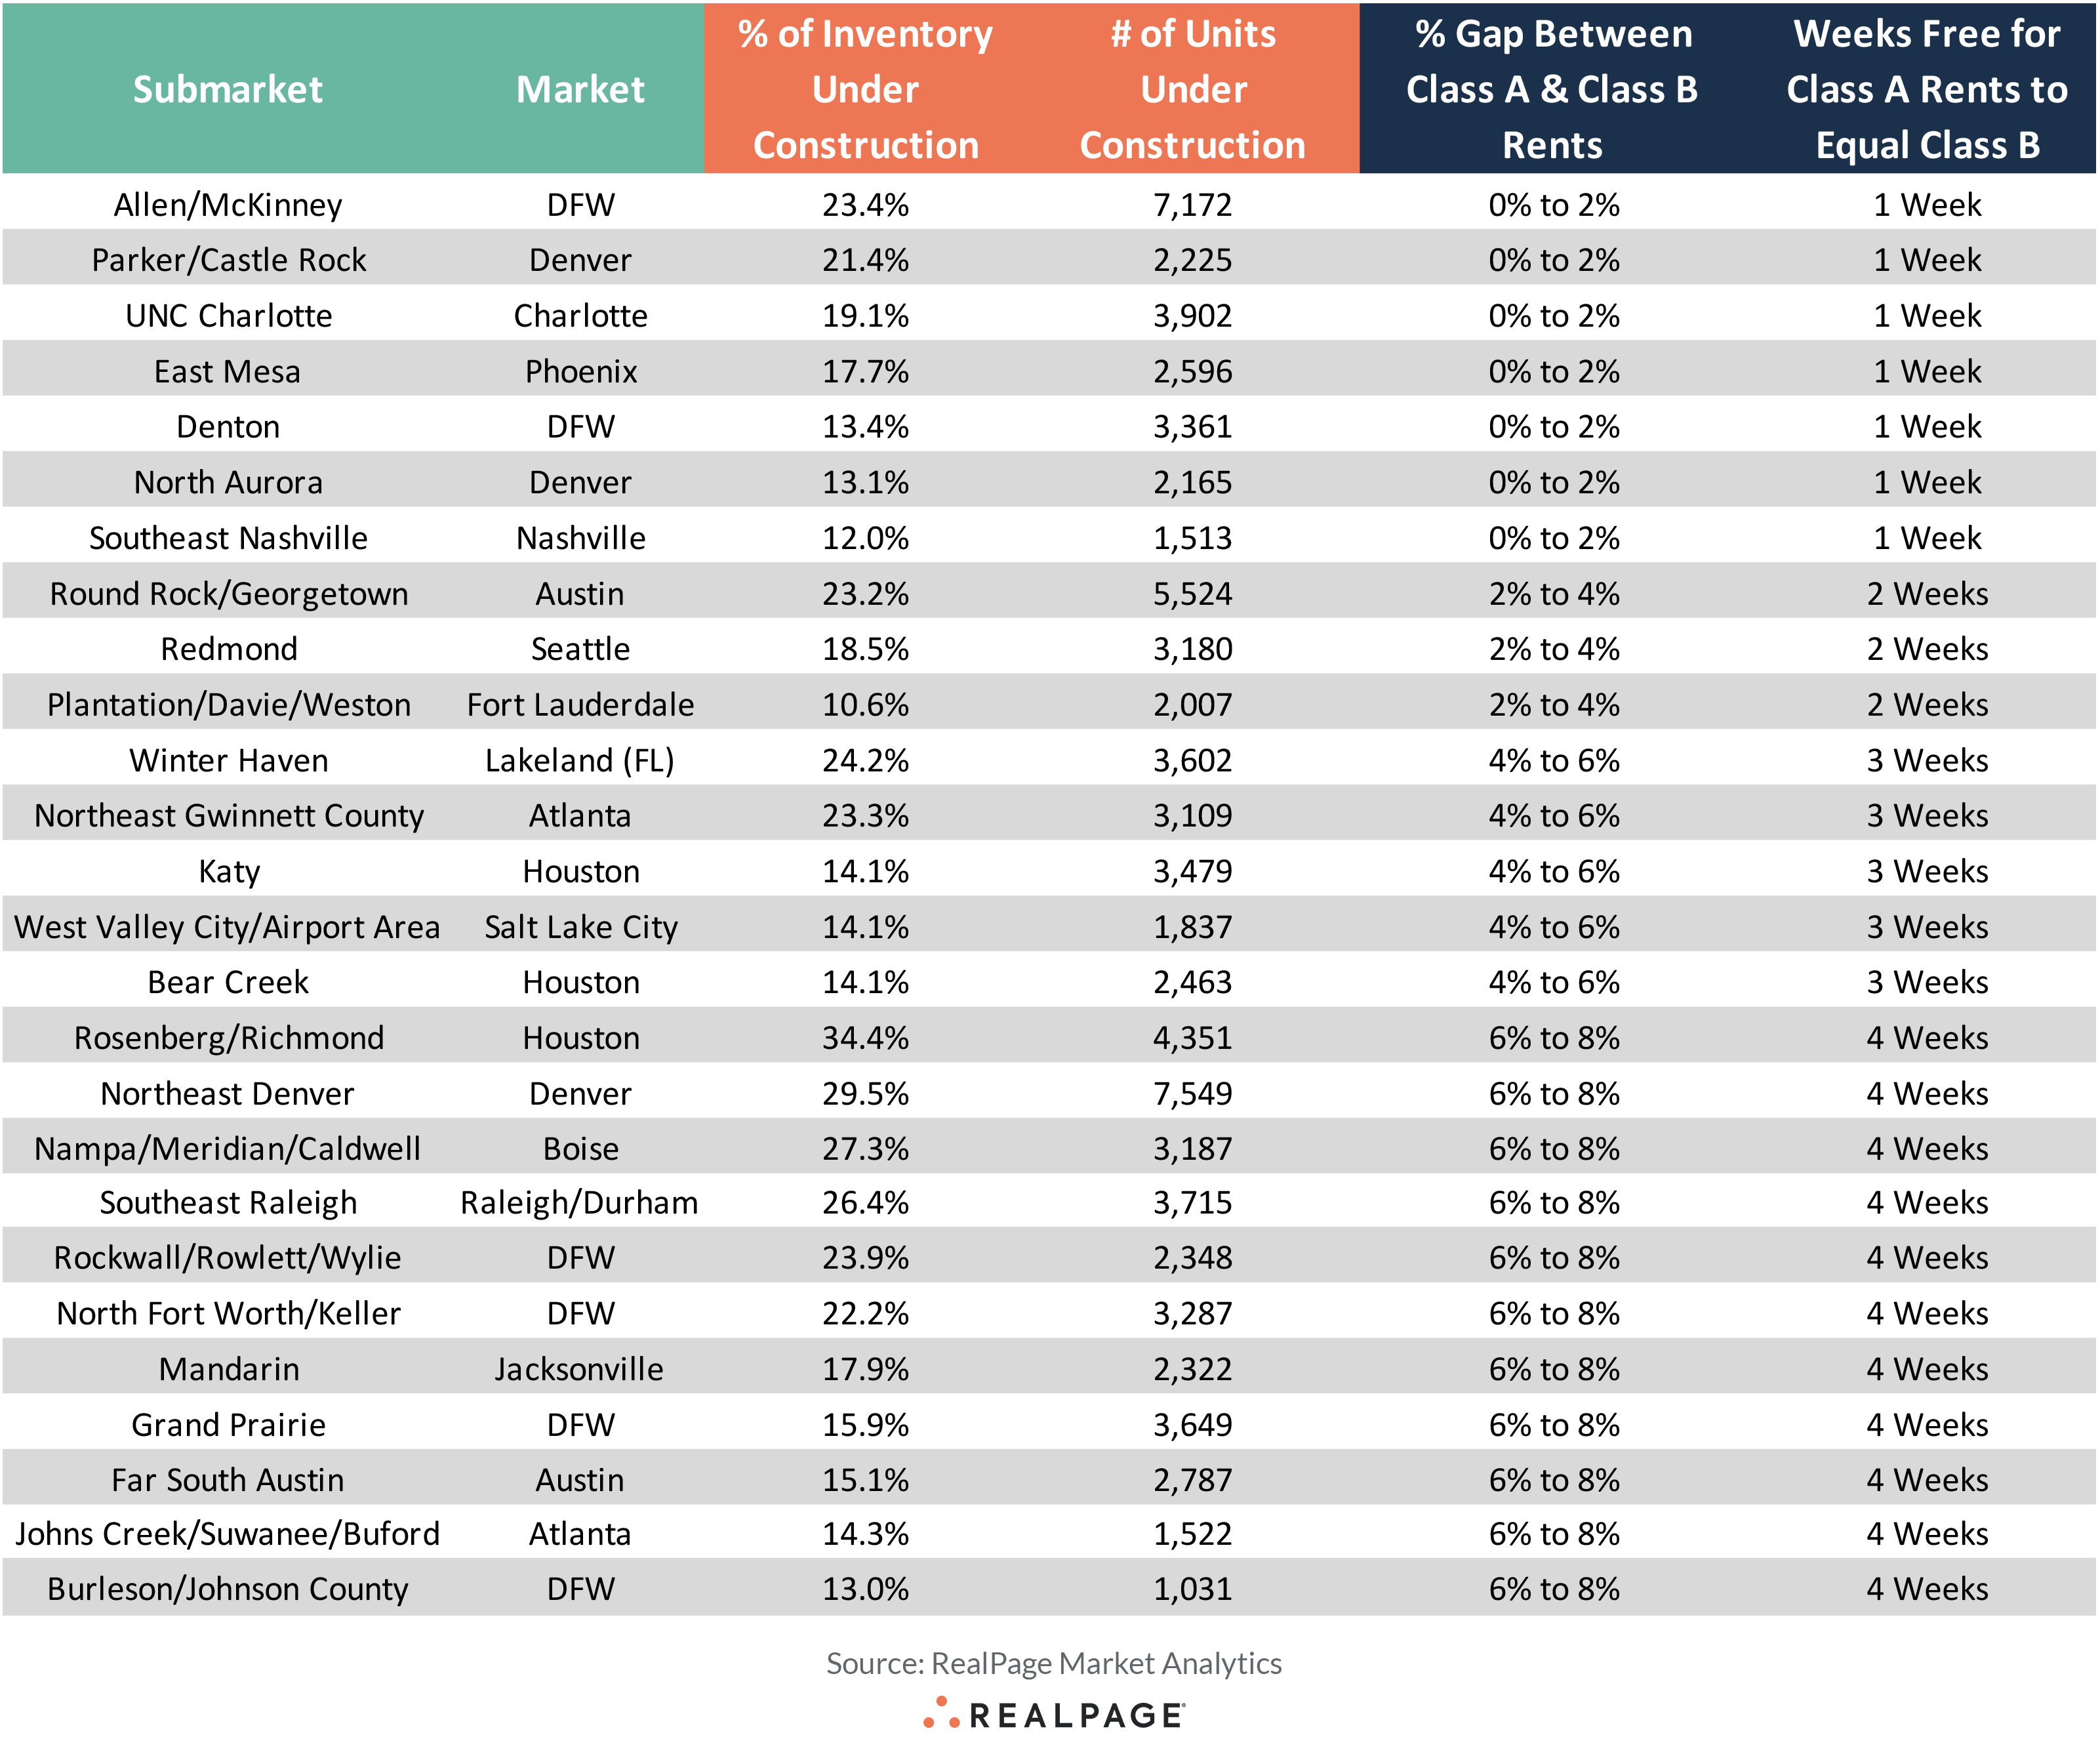
RealPage Market Analytics classifies 1,030 submarkets across the nation’s Top 150 markets. Of those, we have identified 26 submarkets could be at near-term risk of Class B attrition to the Class A housing pool.
The following table higlights submarkets in which the difference bewteen Class A rents and Class B rents is less than 8% (8% being the thresehold of what a one month free concession equals to in terms of a discount). Additionally, the table highlights submarkets that also have more than 1,000 units under construction (or at least 10% of all existing stock in those neighborhoods).
Generally speaking, the highest risk areas are those fast-growing Sun Belt suburban submarkets where inventory growth has exploded in recent years. Allen/McKinney in DFW, for example, has seen almost 50% of all its existing stock deliver in just the past five years alone.
Stated differently, this is an example of an area where recent concentration of construction has resulted in a fairly homogenous stock of housing product. And due to the rapid growth of the location, there isn’t a large block of established, traditional Class B housing product (or product generally 15+ years old, built in the pre-2010s cycle in particular).
That submarket isn’t alone, however. The UNC Charlotte submarket has seen 41% of all existing stock deliver during that same period. Redmond – located northeast of downtown Seattle and home to large corporate HQs such as Microsoft - has delivered an incredible 45% of all existing stock in the past five years alone.
In these instances, just one to two months free among stabilized Class A assets would normalize rents with existing Class B stock. And with up to 25% to 30% of all existing stock underway in many of these neighborhoods, it’s certainly within the realm of possibility that those lease-up assets delivering could in fact result in deep concession among the local stabilized product.
Keep an eye on the pace at which lease-ups are absorbed in the coming 6 to 12 months. Lease-up properties falling behind their absorption schedule will be a key indicator of local strength of demand.


