Slow Inventory Expansion Keeps Apartment Market Fundamentals Afloat in Chicago

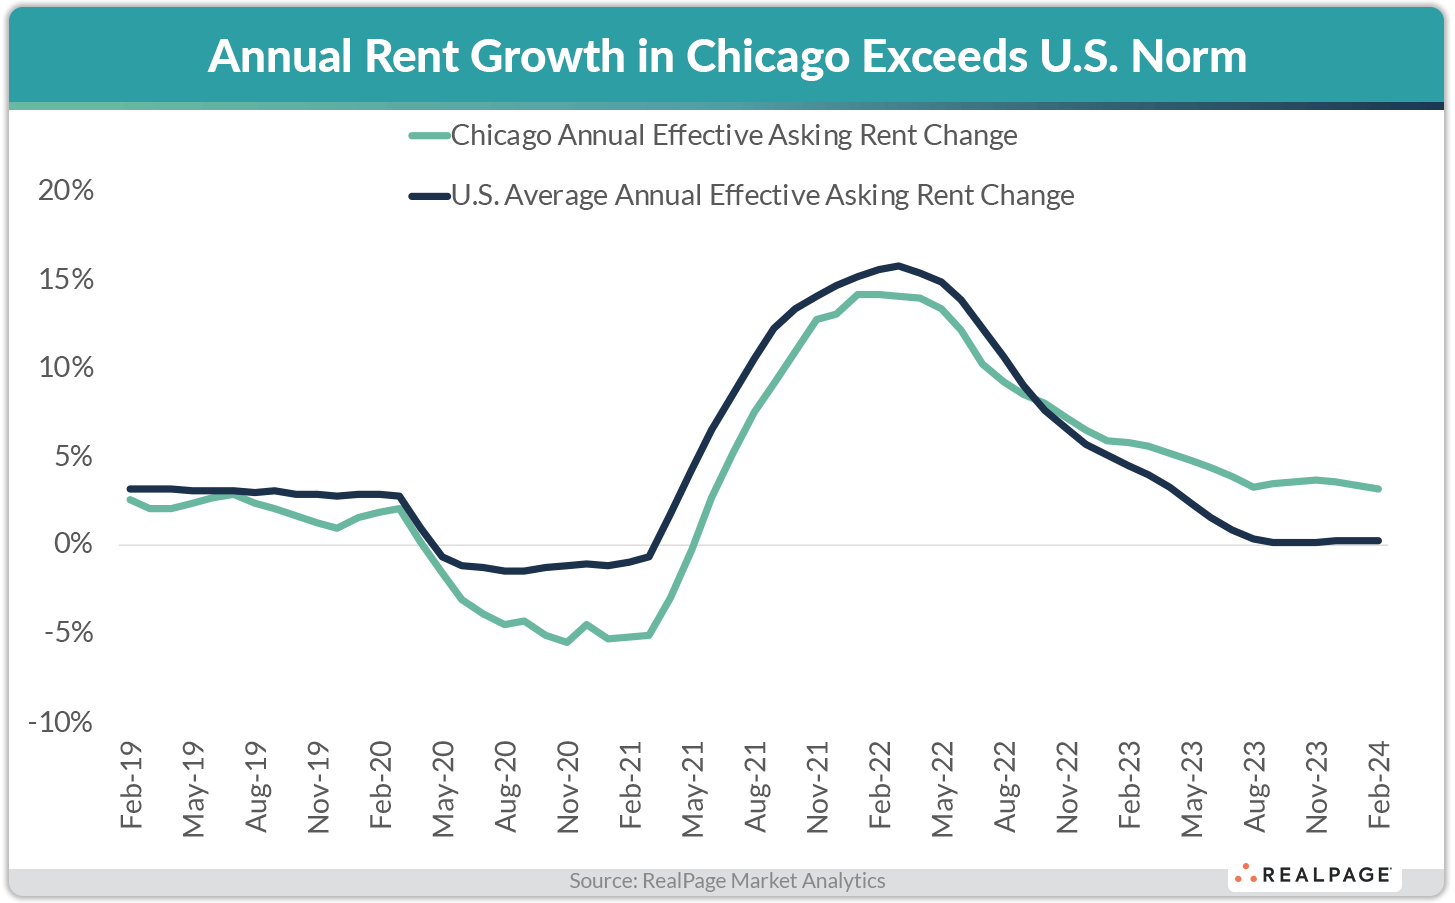
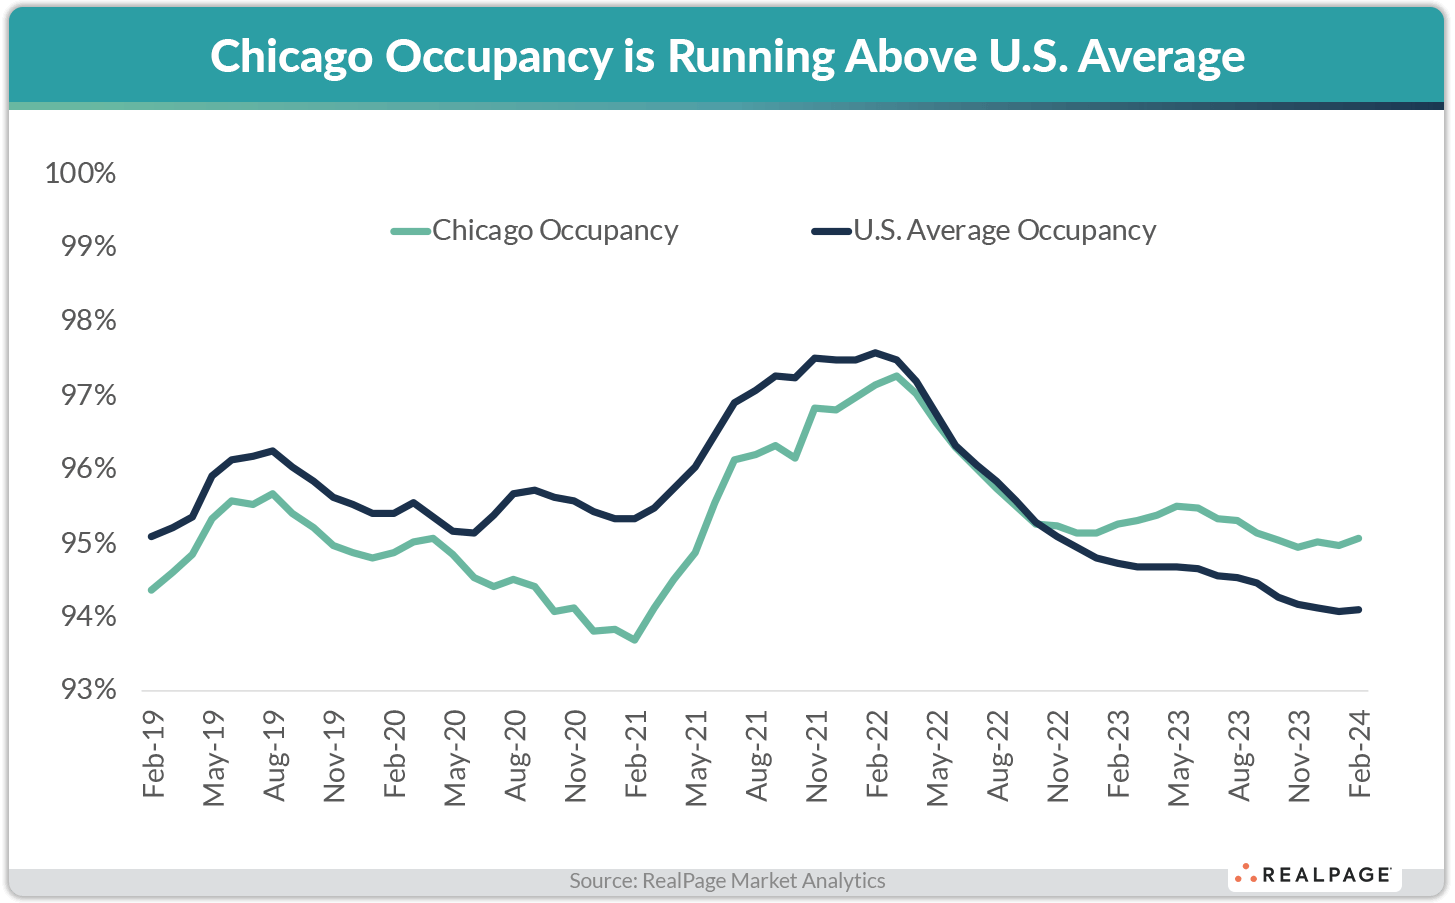
Chicago’s apartment market fundamentals have typically fallen below national norms. But over the past year or so, Chicago has witnessed a reversal of that trend, with occupancy and annual rent growth exceeding U.S. averages.
Located on the shore of Lake Michigan in the northeast corner of Illinois, Chicago-Naperville-Elgin has a population of roughly 9.3 million residents, the third largest metropolitan area in the U.S. and home to the nation’s third most populous city. However, the population here has fallen recently. From 2020 to 2023, Chicago’s population declined nearly 2%, according to the latest data from the U.S. Census Bureau. Still, Chicago-Naperville-Elgin has an above average concentration of young adults – demographics critical to apartment owners – with 20.6% of the population between 20- and 34-years-old, slightly above the nationwide average of 20.4%.
The Windy City has a diverse economy and is a major financial center and a transportation and distribution hub. The metro’s largest employment sector is Trade/Transportation/Utilities which accounts for nearly 21% of all jobs, ahead of the national average share of 18%. Chicago also has one of the nation’s largest concentrations of science and engineering jobs. Manufacturing, printing, publishing and food processing also play major roles in the economy. In addition, Chicago has the nation’s second-largest concentration of Fortune 500 company headquarters with a total of 31 companies, the largest (in terms of revenue) being Walgreens Boots Alliance, Archer Daniels Midland, AbbVie, Allstate, United Airlines Holdings and Abbot Laboratories.
Like other major markets across the country, Chicago was hit hard by COVID-19 pandemic-era job cuts. While Chicago was able to recoup all the jobs lost during the pandemic by mid-2022, the market has more recently found itself in a hole. According to estimates from the Bureau of Labor Statistics, the Chicago apartment market lost 5,600 jobs during the year-ending January 2024, though the proportional decline was just 0.1%. Still, that was one of the worst performances nationally and it took Chicago’s employment count below the pre-pandemic level from February 2020. Job loss over the past year was steepest in the Professional/Business Services sector followed by Trade/Transportation/Utilities. The biggest employment gainers were Education/Health Services and Government.
Chicago-Naperville-Elgin, the nation’s fourth-largest apartment market with roughly 758,500 units, took a big hit compared to many other U.S. markets during the pandemic. While the pace of recovery in other major markets has been hindered by the big volumes of construction underway, Chicago is a different story. Chicago added roughly 40,000 new apartment units in the last five years, according to data from RealPage Market Analytics. Given Chicago’s high existing unit count, all those new units only increased inventory 5.5%, about half the national average growth pace of 10%. One-fourth of Chicago’s completions during that period came online in The Loop (10,136 units), growing the submarket’s existing inventory nearly 33%. This was by far Chicago’s fastest growing submarket.
Looking at annual additions, Chicago added 7,410 units in 2023, expanding just 1%, well below the U.S. average of 2.3%. Not surprisingly, supply in Chicago was greatest in The Loop submarket (2,019 units) in the past year. At the end of 2023, there were 11,185 units under construction in Chicago, with 8,084 of those units scheduled to complete in 2024. Those completions will grow Chicago’s existing unit count just 1.1%, the slowest expansion rate among the nation’s 50 largest apartment markets. Scheduled deliveries in Chicago during the coming year are expected to remain concentrated in The Loop (2,341 units), with that submarket capturing nearly one-third of Chicago’ new supply.
Supply in Chicago is currently outpacing demand, as the market recorded absorption of 5,900 units in 2023. However, over the past five years, demand has slightly outpaced new supply (40,589 units of demand to 40,047 units of supply). In fact, among the nation’s 50 largest apartment markets, only Chicago and New York have seen five-year demand exceed five-year supply, though New York far outperformed Chicago by a wide margin. Among Chicago submarkets, the strongest absorption over the past five years was in The Loop (9,375 units) and Streeterville/River North (5,045 units). Those areas accounted for 35% of the market’s total demand over the past five years. In the past year, specifically, demand was greatest in the Bronzeville/Hyde Park/South Shore (1,765 units) and The Loop (1,443 units) submarkets.
With supply outpacing demand over the past year or so, occupancy in Chicago has been generally trending down. After reaching a decade high of 97.3% in March 2022, occupancy has contracted 220 basis points (bps) to register at 95.1% as of February 2024. Still, that recent reading was 100 bps above the national average (94.1%). Despite the backtracking, Chicago was one of only 12 of the nation’s 50 largest markets to record occupancy above 95% in February. Chicago occupancy registering above the national average is a relatively new phenomenon. From mid-2015 through 2021, occupancy in Chicago came in below the national norm.
Of Chicago’s 20 submarkets, 14 posted occupancy at or above the effectively full mark of 95% during February, with four submarkets above the 96% threshold. The tightest reading was seen in the relatively small Gary/Hammond submarket at 97%. The weakest submarket-level occupancy rate was in the fast growing The Loop submarket at 93.4%. Among product classes in Chicago, February occupancy was tightest at 96% in Class C product, followed by Class B at 95.1%. Class A stock recorded February occupancy at 93.9%, trailing the other two product classes over the past year.
Similar to occupancy, rent growth has been trending down over the past year or so but has remained above U.S. norms. In February, effective asking rents in Chicago rose 3.1% annually, well above the national average of 0.2% and ranking #5 among the 50 largest markets. Although Chicago’s recent price increase was well below the market’s all-time high of 14.2% from January 2022, it registered above the pre-pandemic annual average of 2.1% from 2015 to 2019. And like occupancy, rent performance in the market has generally trailed national norms.

Every submarket in Chicago achieved some rent growth over the past year. The strongest performances among submarkets during the year-ending February 2024 were in Arlington Heights/Palatine/Wheeling, Central DuPage County and Gary/Hammond, all slightly above 6%. The weakest performance was in Streeterville/River North at just 1%. Among product classes, Chicago’s Class B units led for rent performance in February with a 4.3% year-over-year increase, followed by Class B product at 3.2%. Similar to occupancy, rent growth in Class A projects trailed with an annual increase of 1.9%
Chicago claims the highest rents in the Midwest region and the 16th highest among the nation’s 50 largest markets, averaging $1,985 per month as of February 2024. Chicago’s submarkets present a wide range of prices, with four submarkets exceeding the $2,000 per month threshold. The priciest submarkets were Streeterville/River North ($2,819 per month), The Loop ($2,547 per month), Lincoln Park/Lakeview ($2,395 per month) and Evanston/Rogers Park/Uptown ($2,171 per month), while the most affordable submarkets were Gary/Hammond ($1,212 per month), South Cook County ($1,322 per month) and Merrillville/Portage/Valparaiso ($1,324 per month).


