Apartment Market Comparison: New York vs. Newark

Newark has long been touted as the cheaper living alternative to New York, though both cities are two of the most prolific apartment markets in the nation in terms of both price and inventory. Over the next several weeks, RealPage Market Analytics will be comparing and contrasting neighboring apartment markets.
There are perhaps no other neighboring apartment markets more connected than New York and Newark.
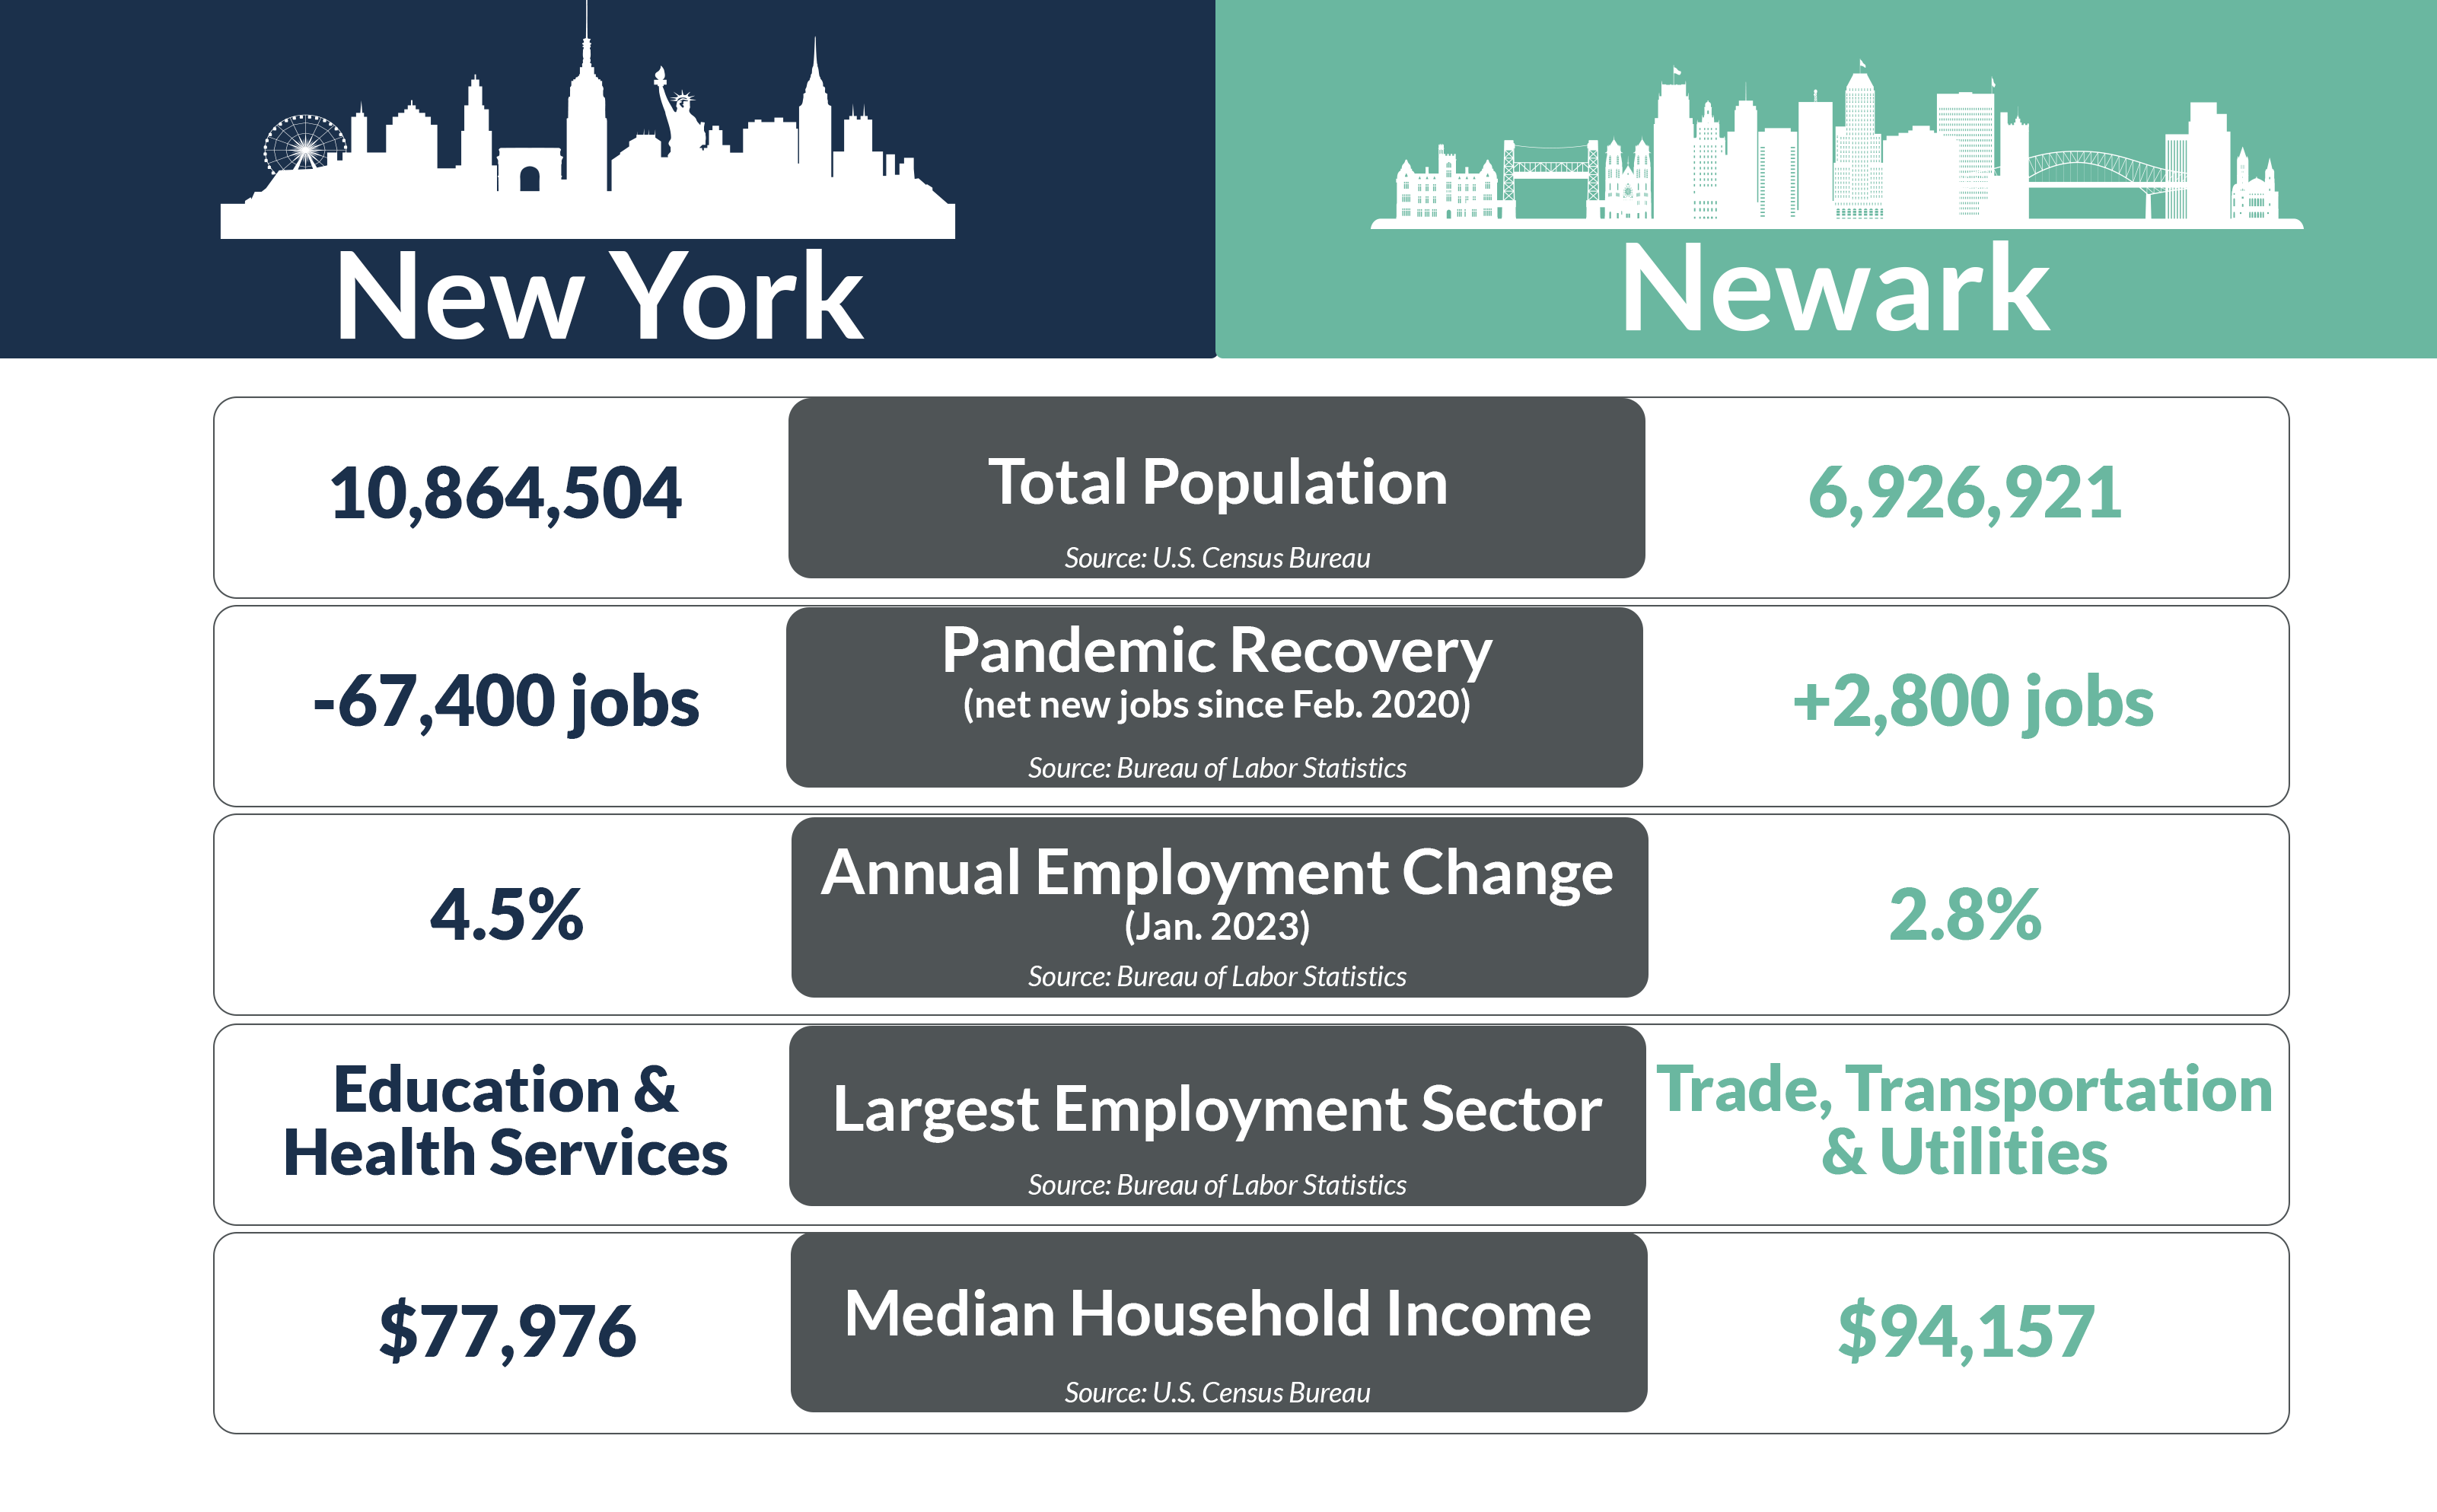
With a combined population of nearly 17.8 million residents, about 5.4% of the nation’s total population resides in New York-White Plains and Newark-Jersey City. New York, of course, claims the larger population at just under 11 million residents, compared to Newark’s nearly 7 million.
Annual population growth in both markets hovered around 4% in 2021, according to the latest data from the U.S. Census Bureau. Both markets have a high concentration of young adults – demographics critical to apartment owners. In Newark, about 40% of the population is aged between 25 to 54. In New York, that rate is about 43%. Nationwide, about 33% of the population is aged 25 to 54.
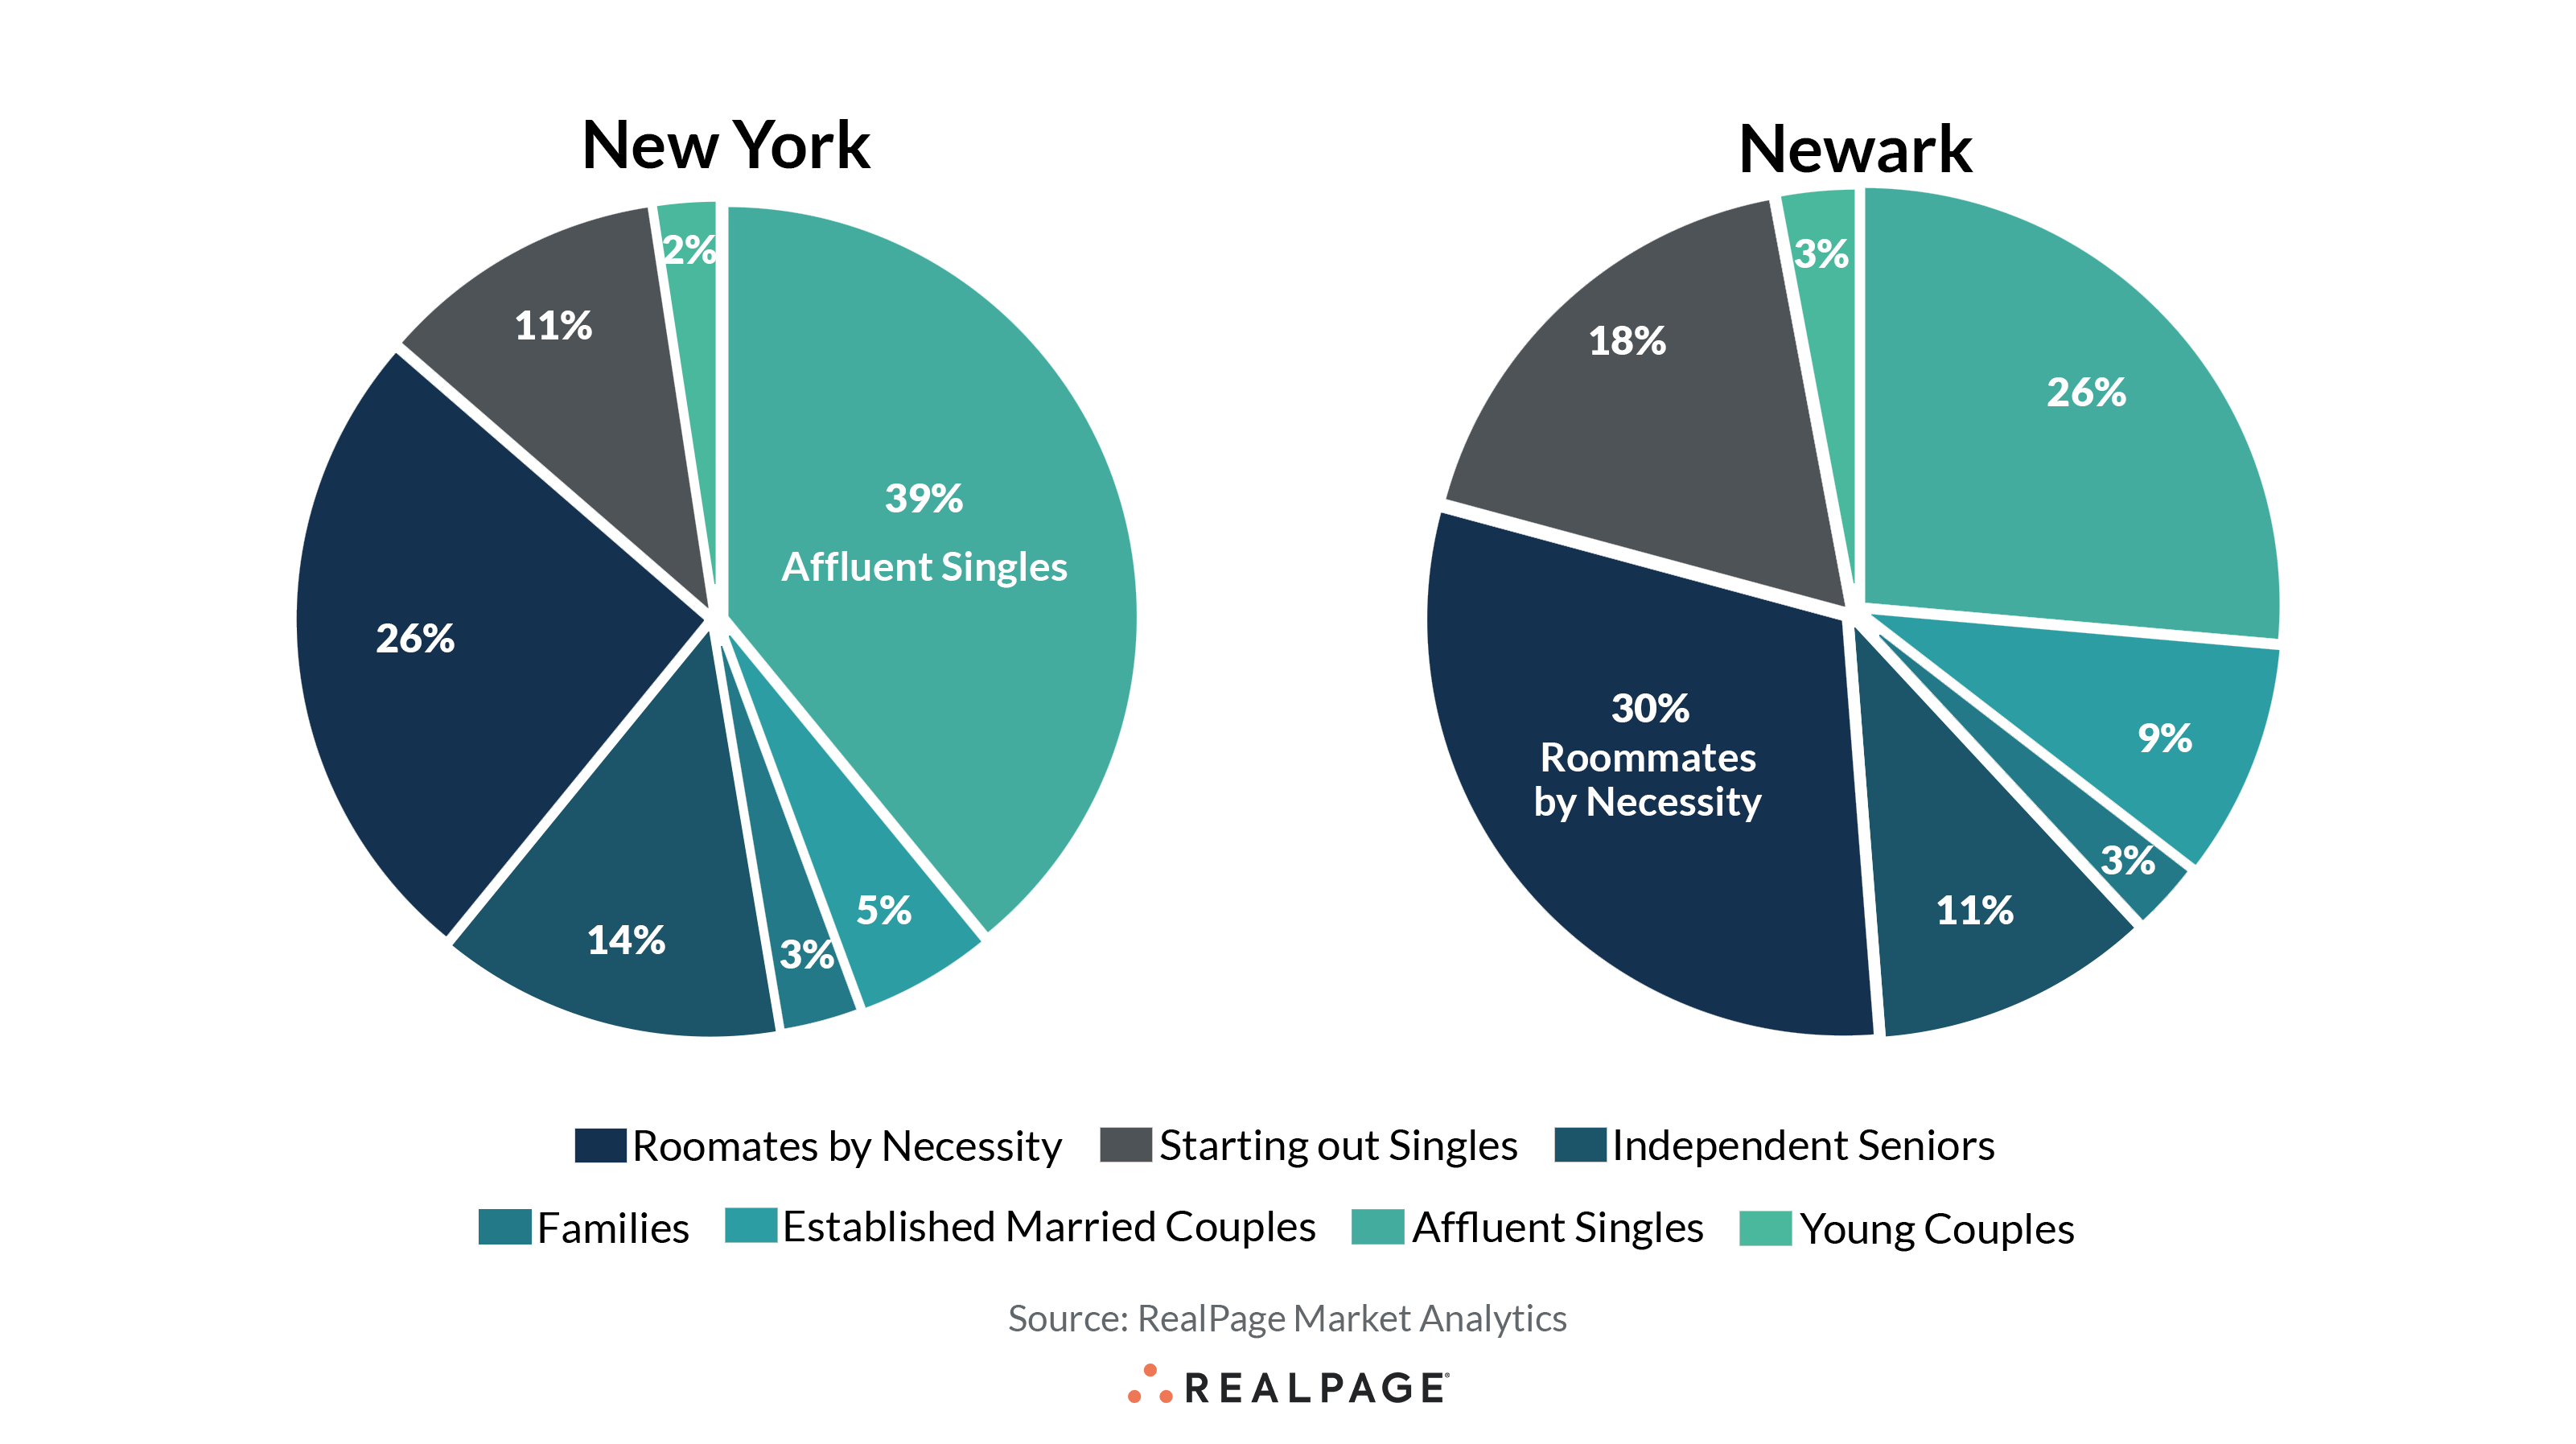
New York’s largest renter cohort is Affluent Singles, with those residents making up about 39% of the renter population. Roommates by Necessity comprises the largest renter cohort in Newark, by contrast, with about 30% of the renter pool. Newark has more Established Married Couples and Starting Out Singles while New York has more Independent Seniors. Both markets have similar rates of Families and Young Couples.
New York was hit hard not only by COVID-19 pandemic-era job cuts, but also by residents fleeing the city for less expensive rental options when employees started working from home. Some just went across the Hudson River, while others moved all across the nation as the work-from-anywhere trend took hold.
It took until October 2022 for New York to recover all jobs lost during the pandemic – only to dip back below its pre-pandemic employment rate again in January 2023. As of January, New York’s total employment sits about 67,400 jobs below its February 2020 rate. Newark rebounded past its pre-pandemic job base in April 2022 – one of the earlier markets to achieve that accolade – and today sits just 2,800 jobs above its February 2020 rate.
Both markets have a median household income above the national norm of about $69,000, but Newark’s median of over $94,000 is about 20% higher than New York’s median of about $78,000.
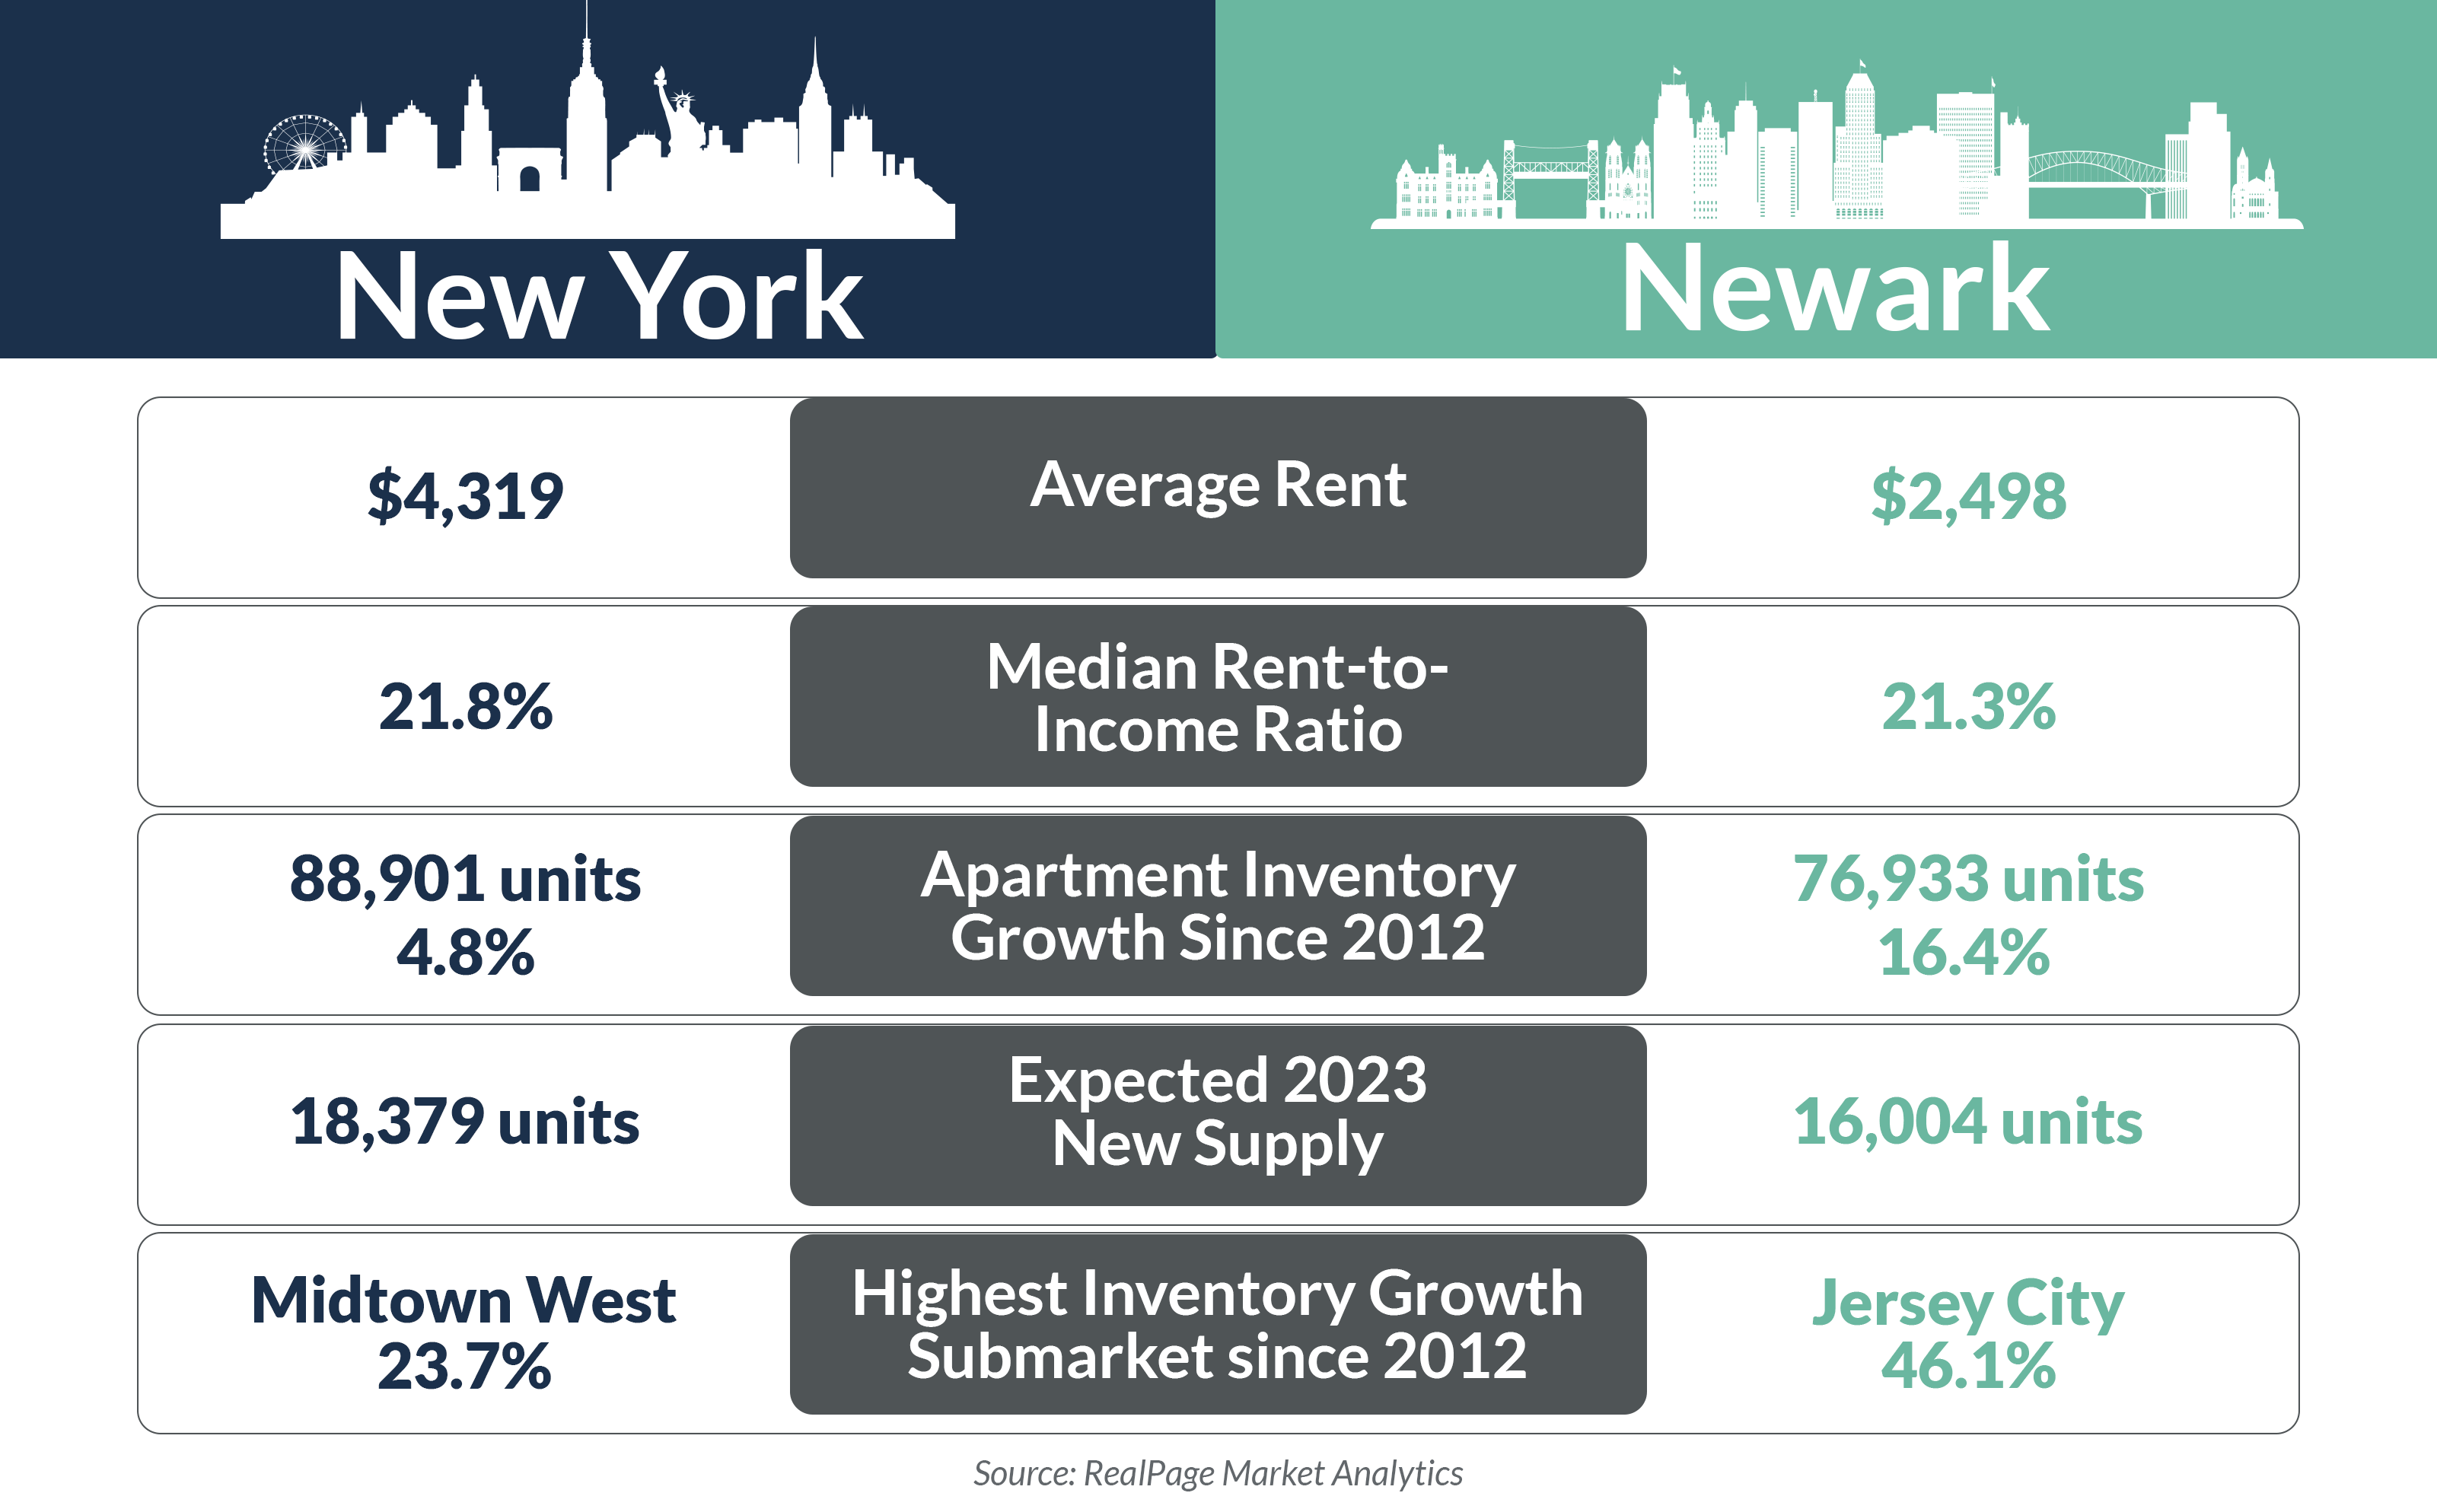
Unsurprisingly, New York average apartment rents are quite a bit higher than in Newark. New York claims the highest rents in the nation, averaging $4,319 per month as of 4th quarter 2022, while prices are just under $2,500 in Newark. Still, submarkets present a wide range of prices across both markets. Newark’s priciest submarkets (Jersey City and Hoboken/North Hudson County) easily claim higher rents than New York’s least expensive submarkets (Harlem, the Bronx, South Westchester County and the New York Northern Suburbs). But where Newark only has two submarkets with rents exceeding $3,000 per month, New York only has four submarkets below that threshold.
New York added nearly 89,000 new apartment units in the last decade. Given New York’s high existing unit count, all those units have only increased inventory by 4.8%. Midtown West’s nearly 13,000 new units in the last decade have grown that submarket by nearly a quarter, easily claiming the title as the highest inventory growth submarket during that time. The second-highest inventory growth submarket is South Westchester County where over 9,000 new units since 2012 have grown that market 12.5%.
Meanwhile in Newark, about 77,000 new units since 2012 have growth that apartment market over 16%. About a third of the market’s entire new supply over the last decade came online in Jersey City. The nearly 24,000 new units there have grown that submarket by over 46% since 2012. Hoboken/North Hudson County, Somerset/Hunterdon Counties, Bergen County and Union County have all grown inventory between 17% and 26% during that time.
In terms of renter demographics for market-rate apartments, New York and Newark differ in some big ways. New York’s largest renter demographic is easily Affluent Singles, making up about 39% of the market-rate renter pool. In Newark, the largest demographic is Roommates by Necessity, making up about 30% of the renter pool. Both markets have similar rates of Young Couples and Families. Newark has nearly twice the rate of Established Married Couples, as well as more Starting Out Singles. New York, meanwhile, has more Independent Seniors.
Next up, compare the neighboring Southern California markets of Los Angeles and Anaheim.


