While the variation in apartment performance across product classes widened during much of the unpredictable years of 2020 through 2022, that gap has now narrowed to more historic norms.
On a national level, annual rent growth reached 5% in January. That’s well below the double-digit growth seen from mid-2021 to mid-2022. While recent annual rent growth is in line with the five-year average, it is well above the average annual increase of 3.5% from 2013 to 2019.
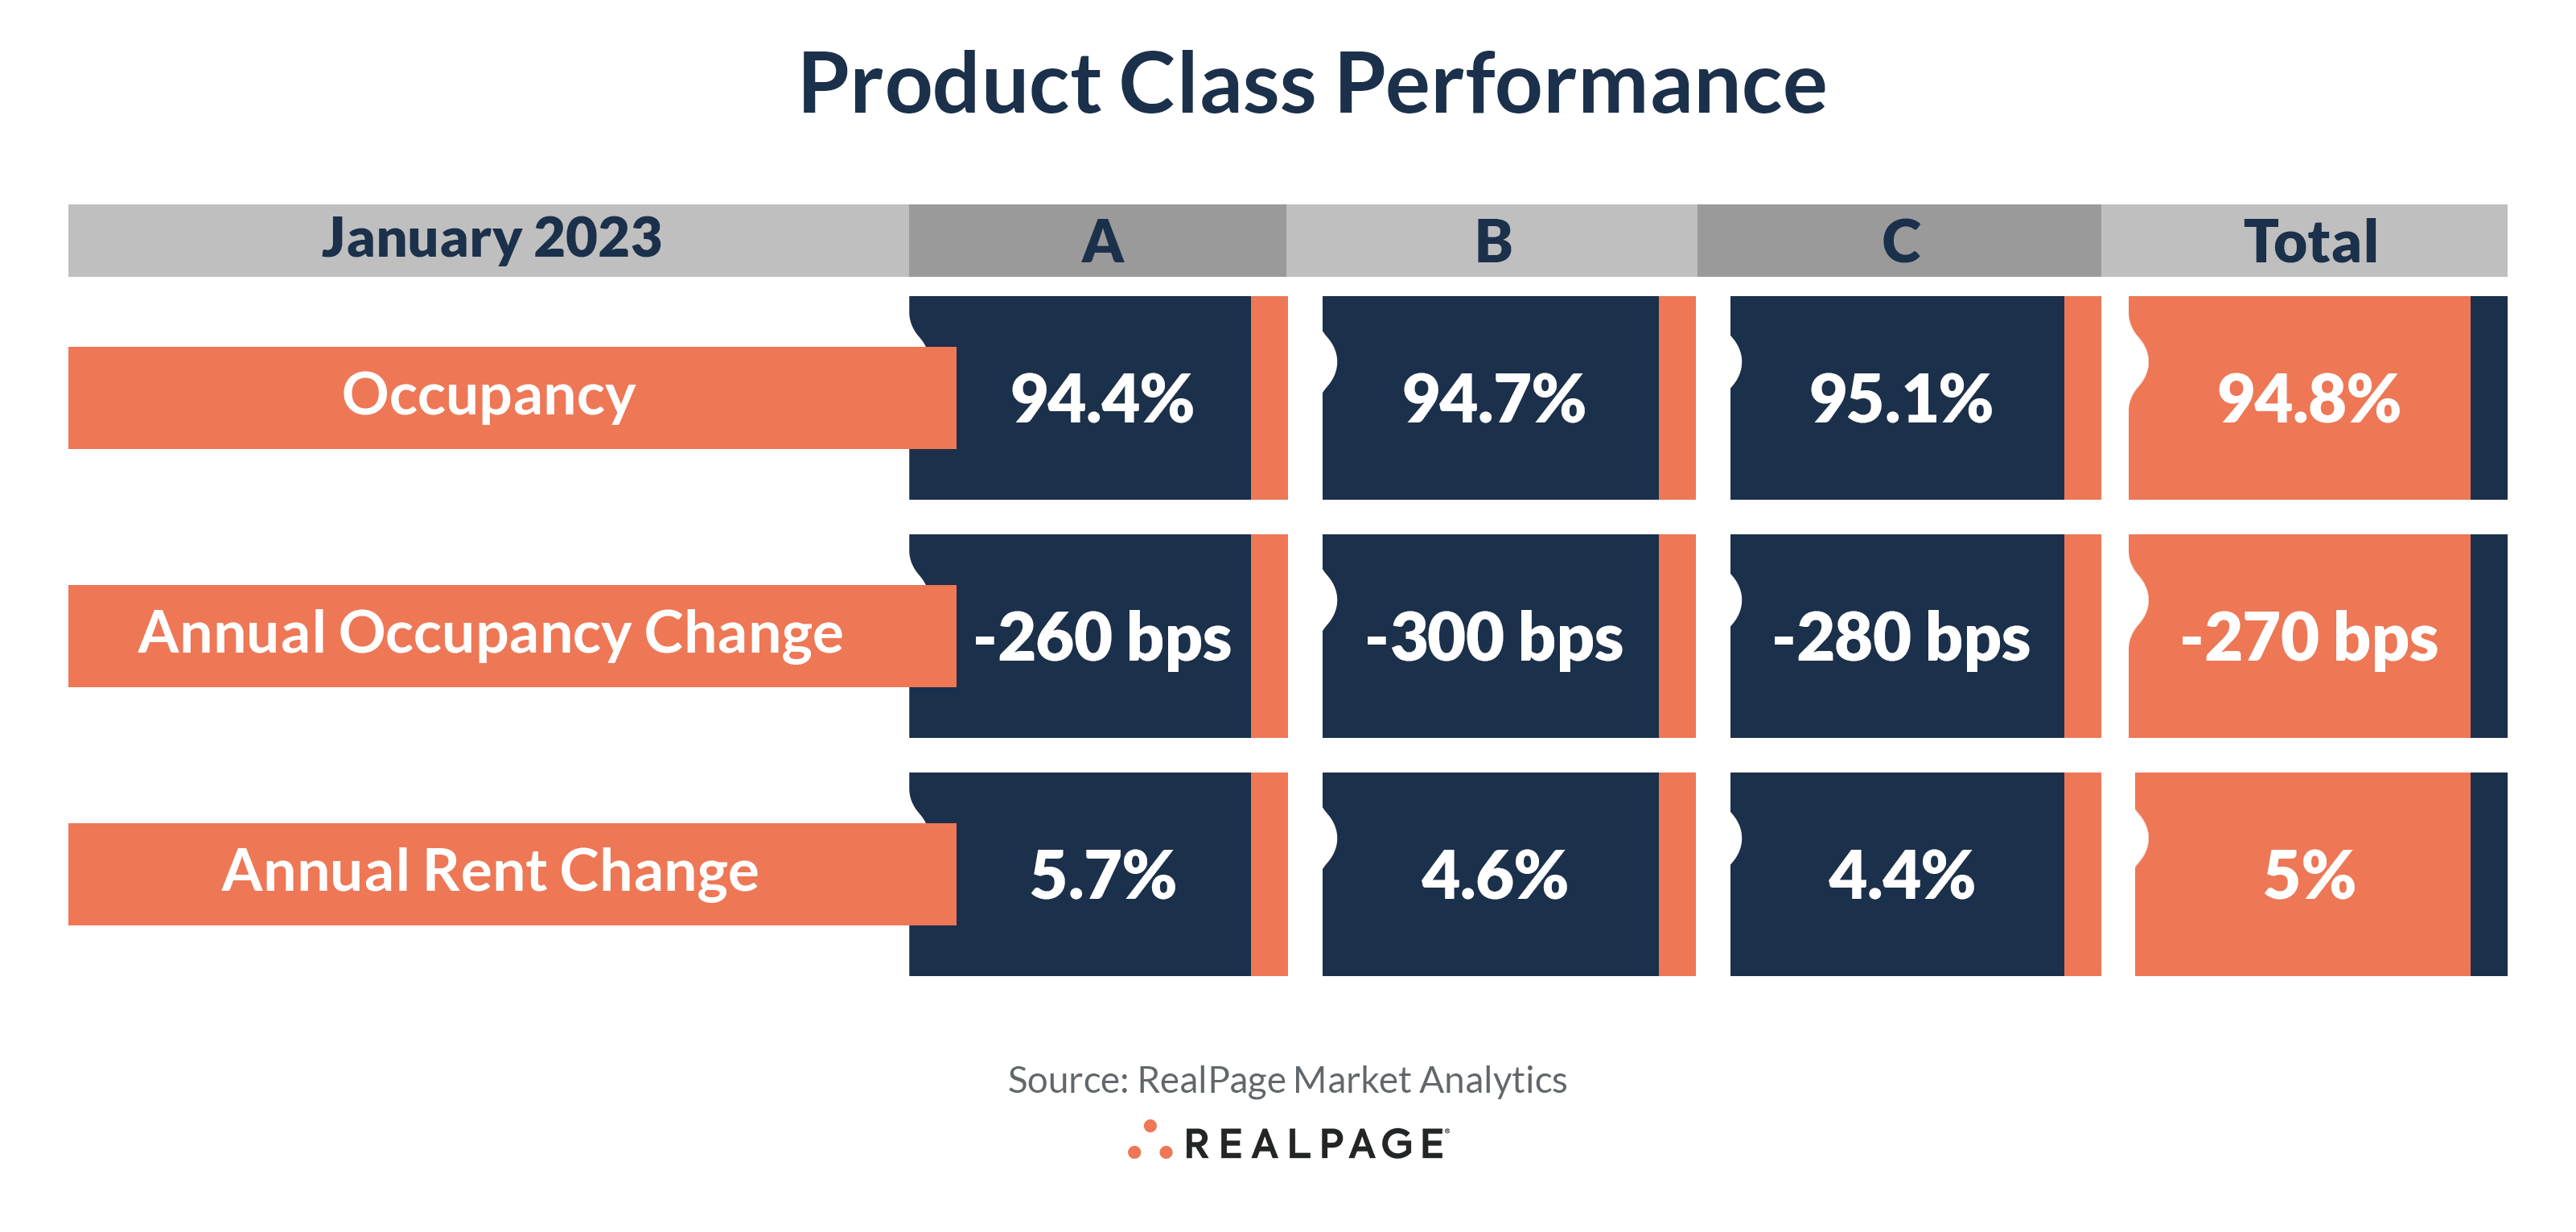
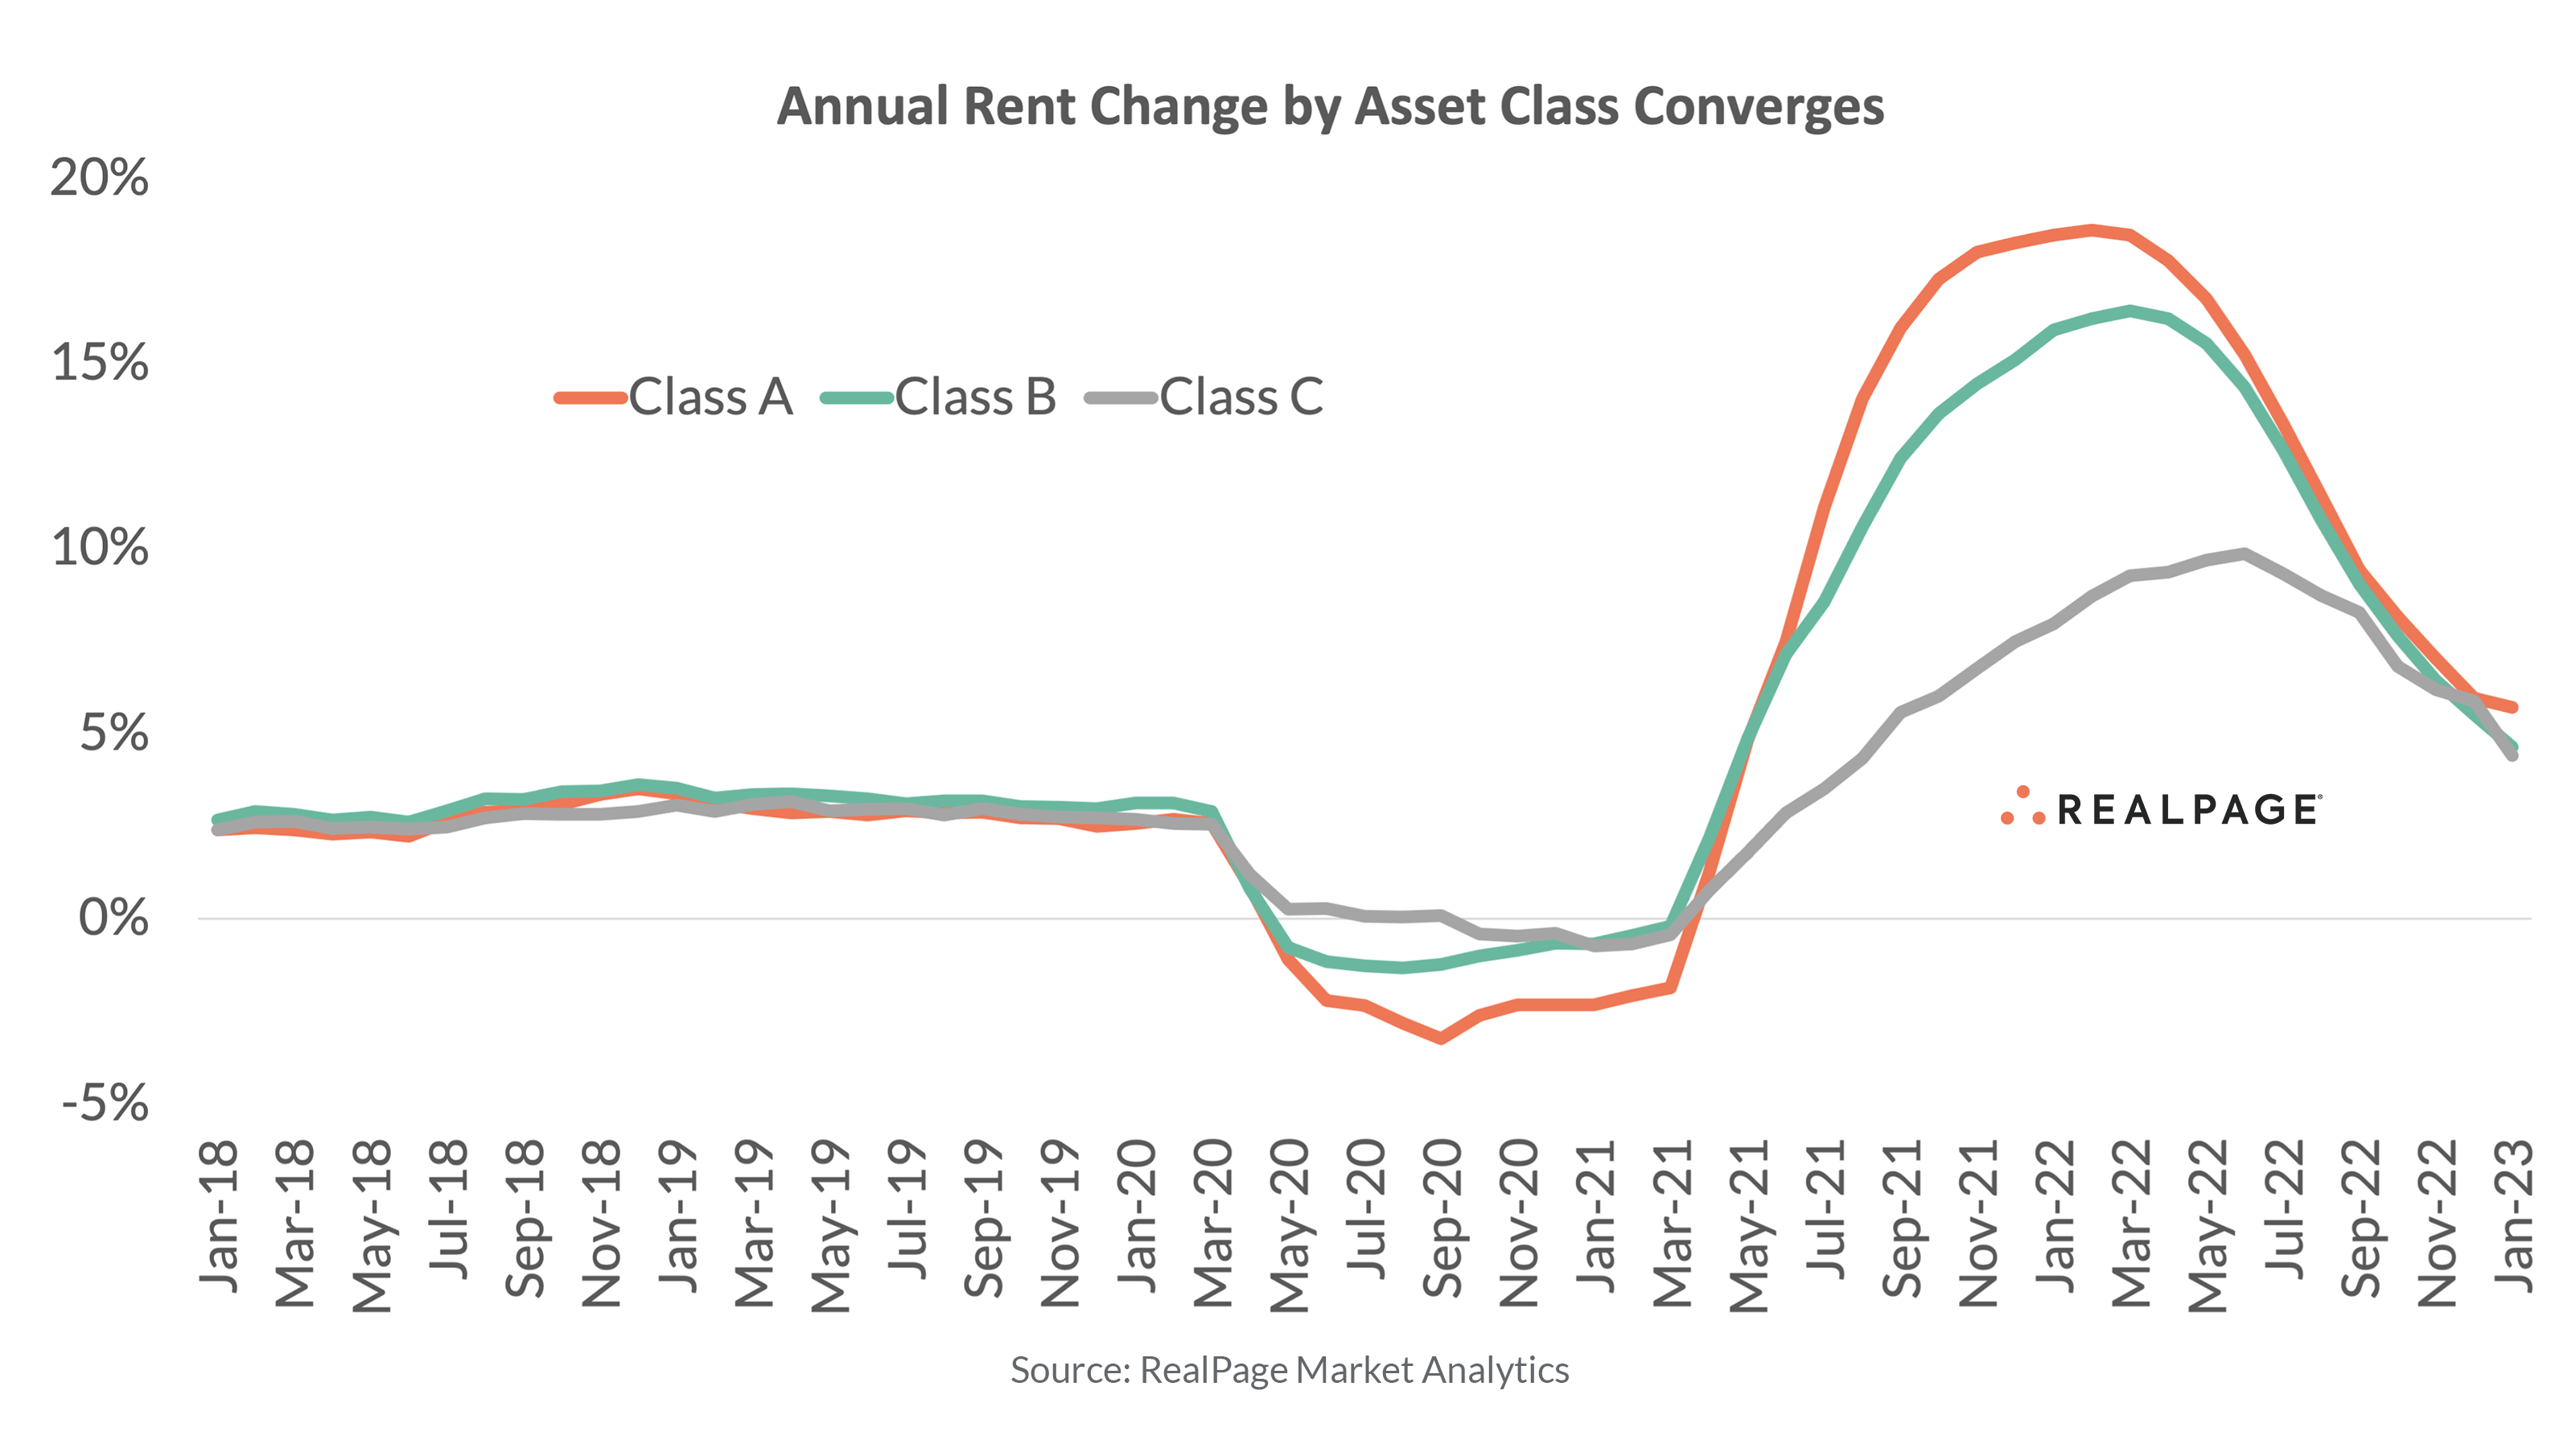
Rents in Class A apartments grew 5.7% year-over-year in January 2023, outperforming the national average and rent growth in Class B (4.6%) and C (4.4%) product, according to RealPage Market Analytics. That is in line with historical norms as Class A rents typically grow the fastest, while Class C prices increase the slowest. From 2013 to early 2020, the trend changed as middle-market Class B rent growth was generally the top performer, but not by a large margin. Once the pandemic struck, all that changed again. Following the onset of the pandemic, Class C product outperformed other asset classes for annual rent change, while Class A product underperformed by as much as 330 basis points (bps). That trend again reversed course in the second half of 2021 and into mid-2022, with Class A leading and Class C generally lagging, with the performance gap widening to more than 1,100 bps. Since late 2022, the difference between rent change levels among asset classes has narrowed, and as of January, the performance gap stood at 130 bps.
Among the 50 largest markets across the country, only Miami (10.7%) continued to record double-digit rent growth in the year-ending January. On the other hand, Phoenix (-1.5%) and Las Vegas (-0.8%) were the only large markets to cut rents over the past year.
Miami led for annual rent growth in the Class A space, with rents climbing 14% year-over-year. Newark also continued to post sizable annual rent growth, with Class A rents growing 10.8%. Those were the only two major markets that continued to record double-digit rent growth in Class A product. On the other hand, Phoenix was the only major market to see rent cuts in Class A units, though the decline was mild at 0.2%.
Class B units in Cincinnati (9.8%), Pittsburgh (9.4%) and Miami (9.2%) saw the biggest year-over-year rent bumps in January. In contrast, the only major markets to post Class B rent cuts over the past year were Las Vegas (-2.8%), Phoenix (-1.6%) and Sacramento (-1.3%).
Miami also outperformed for Class C rent growth in the year-ending January, with rents in that asset class rising 11.1%. Cincinnati was the only other major market to post a double-digit rent hike in Class C product, with rents up 10.9% year-over-year. At the other end of the performance spectrum, Class C rents were cut in only four major markets over the past year. The deepest cut was in Phoenix (-4.4%), followed by Las Vegas (-0.9%), Pittsburgh (-0.9%) and Oakland (-0.2%).
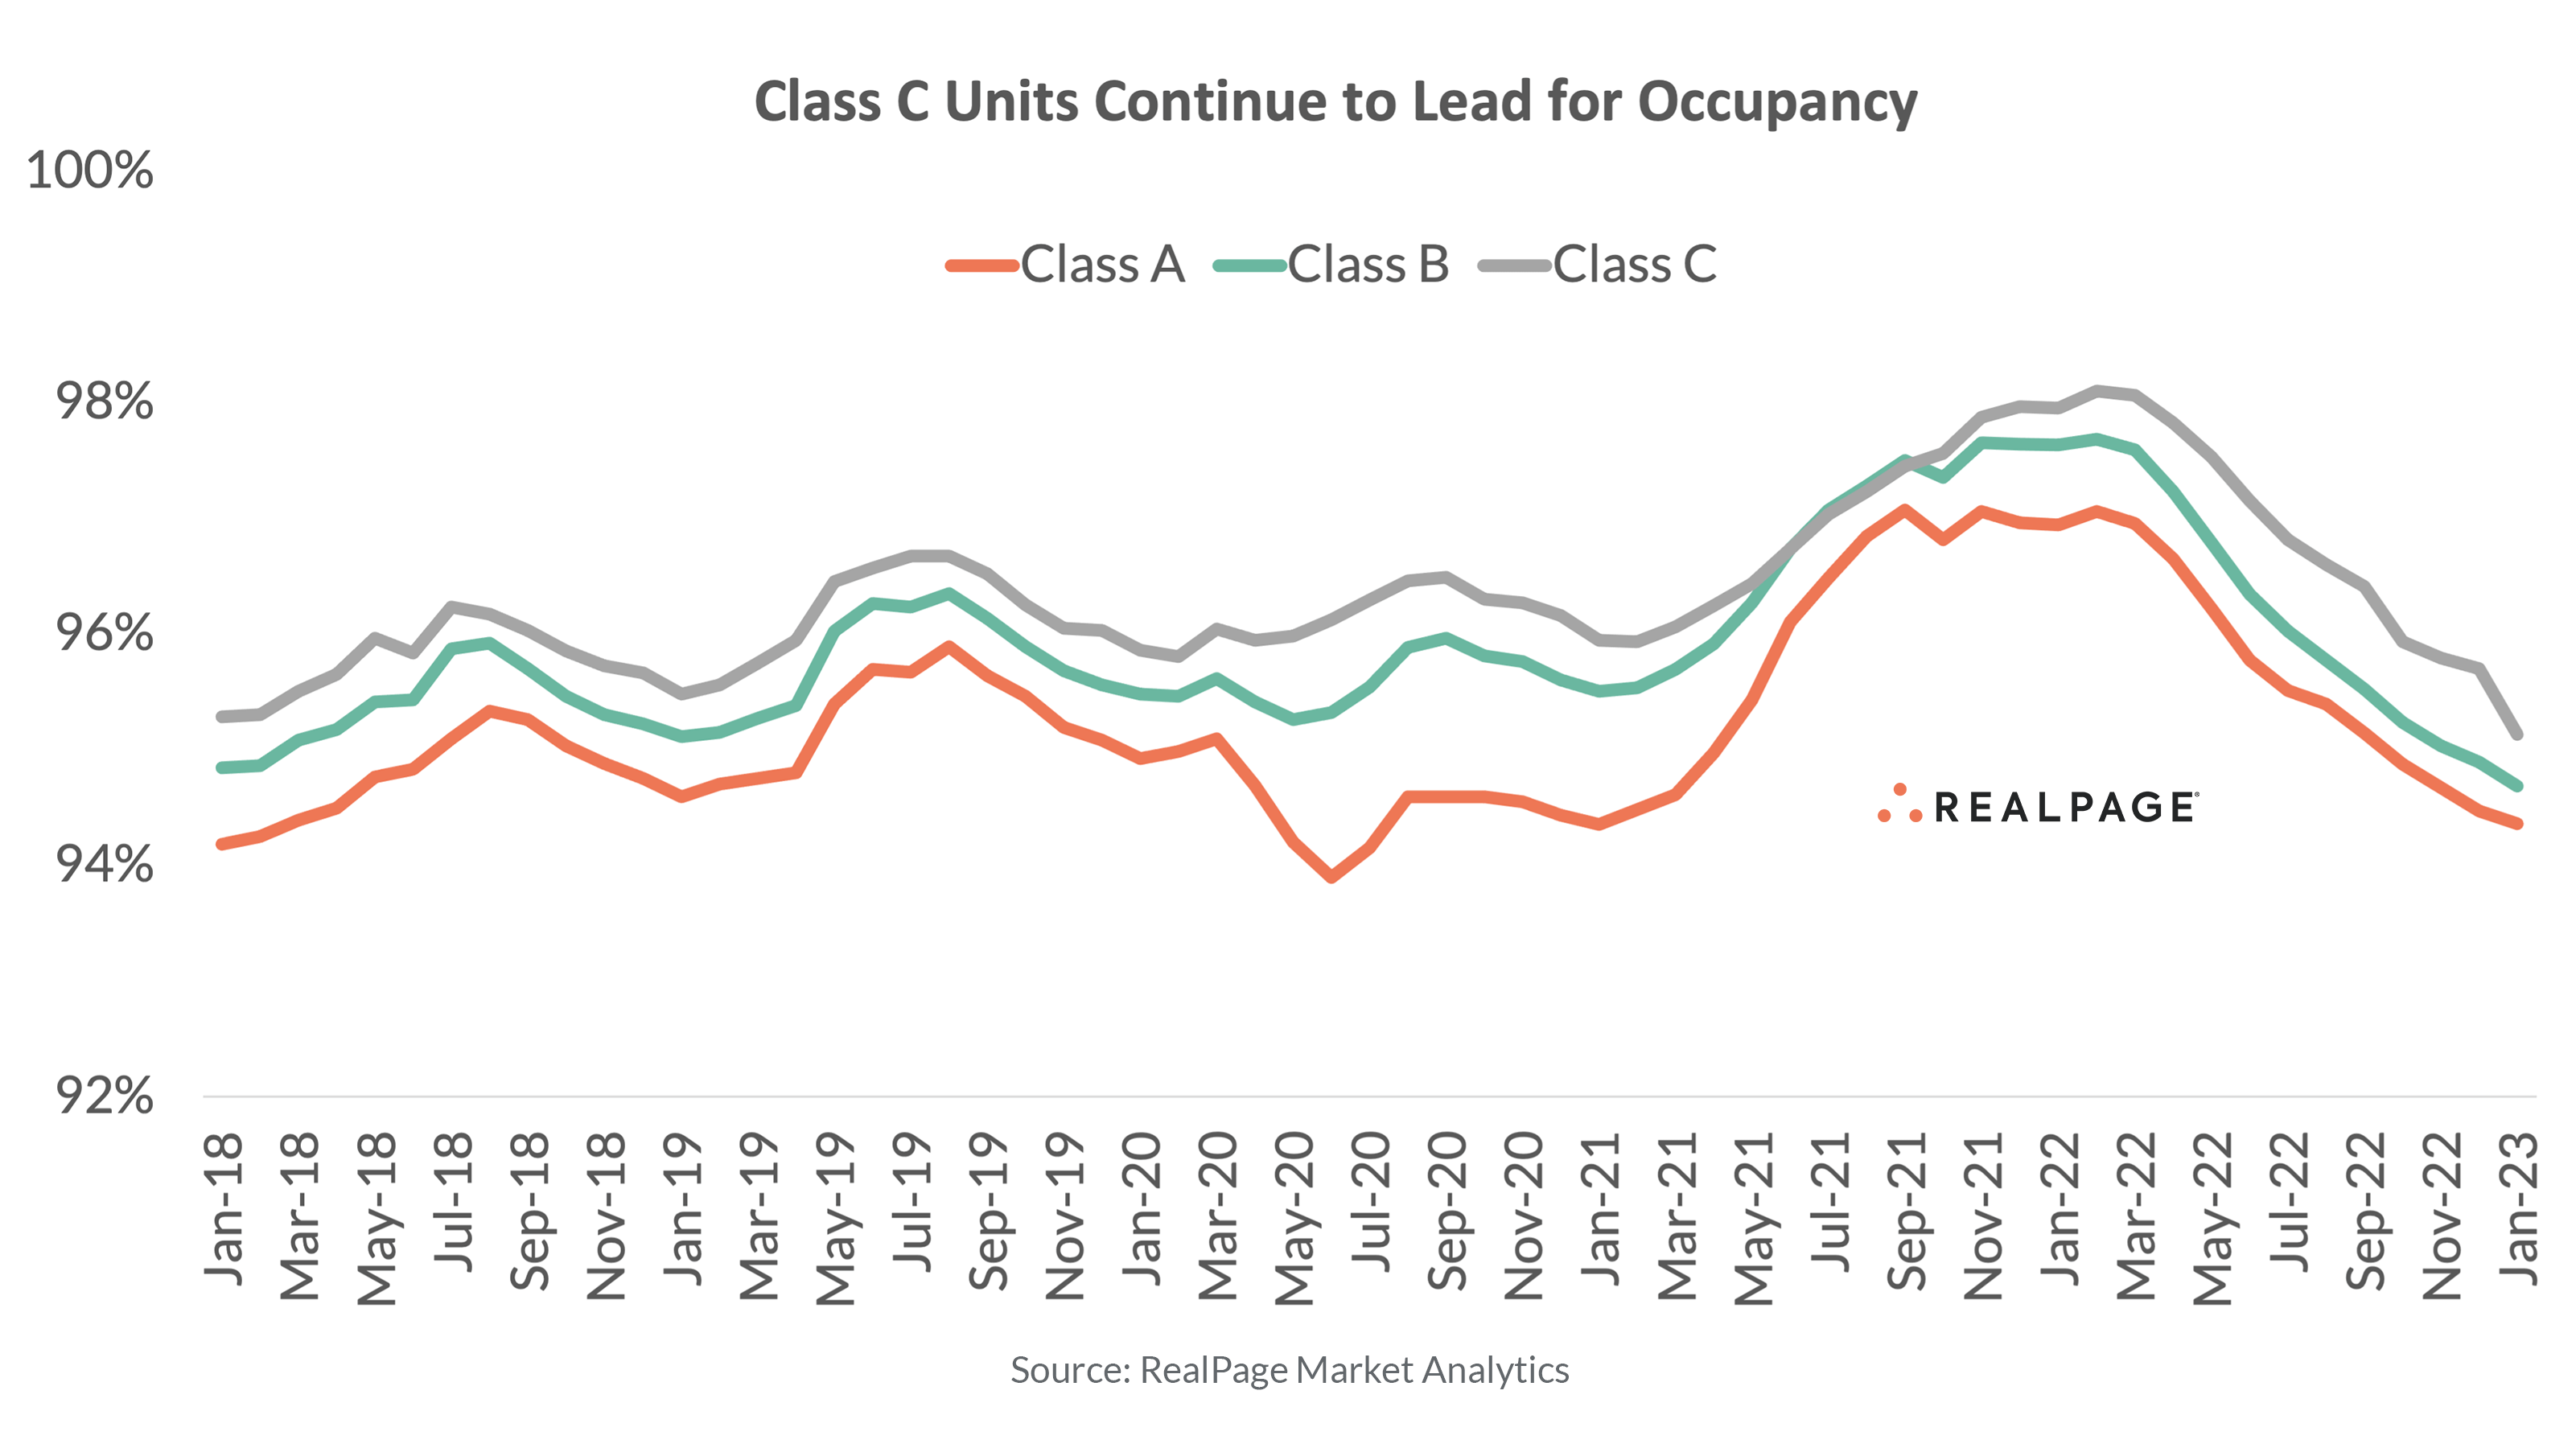
While Class C properties have underperformed the other asset classes for annual rent change performances recently, that niche historically outperforms on occupancy. That trend continued in January 2023, but the performance gap has narrowed recently. Less than 80 bps currently separates Class A and C occupancy, the lowest differential since October 2021.
In the nation overall, apartment occupancy has dropped considerably since reaching a peak of 97.5% in early 2022. As of January 2023, average U.S. occupancy registered at 94.8%, the first time in nearly five years that occupancy has fallen below 95%. Similar to annual rent change, cooling occupancy was felt across all asset classes, but Class A product has been impacted the most due to elevated levels of new supply, as occupancy in that niche dropped to 94.4% in January.
New York led for overall occupancy among major markets in January, with a rate of 97.4%. Also recording occupancy above 96.5% were Newark (97%), Anaheim (96.6%) and Milwaukee (96.6%). The weakest readings were in San Antonio (92.5%), Houston (92.7%) and Memphis (92.8%).
Among Class A space in major markets, Newark recorded the nation’s tightest occupancy in January at 97%, followed by New York (96.7%) and Anaheim (96.3%). Only seven other top 50 markets recorded Class A occupancy at or above the essentially full level of 95%, including West Palm Beach, San Diego, Boston, Miami, Los Angeles, Sacramento and Virginia Beach. The weakest Class A occupancy rates were logged in Pittsburgh (92.4%), Houston (92.7%) and Minneapolis (92.8%).
Class B product was tightest in New York (98.3%), followed by Milwaukee (96.6%) and Anaheim (96.5%). Sixteen other markets reported Class B occupancy at or above 95%. On the other hand, San Antonio (92.0%), Fort Worth (92.9%) and Greensboro/Winston-Salem (92.9%) posted the weakest Class B rates.
Among the more affordable Class C units, occupancy was strongest in Miami (98.5%) and Milwaukee (98.1%). Twenty-two other major markets recorded Class C occupancy at or above 95%. Meanwhile, Class C occupancy landed below 93% in Memphis (91.7%), Fort Worth (92.5%), Jacksonville (92.5%), Houston (92.6%) and San Antonio (92.7%).


