Multifamily Completions Far Outpace Starts in October
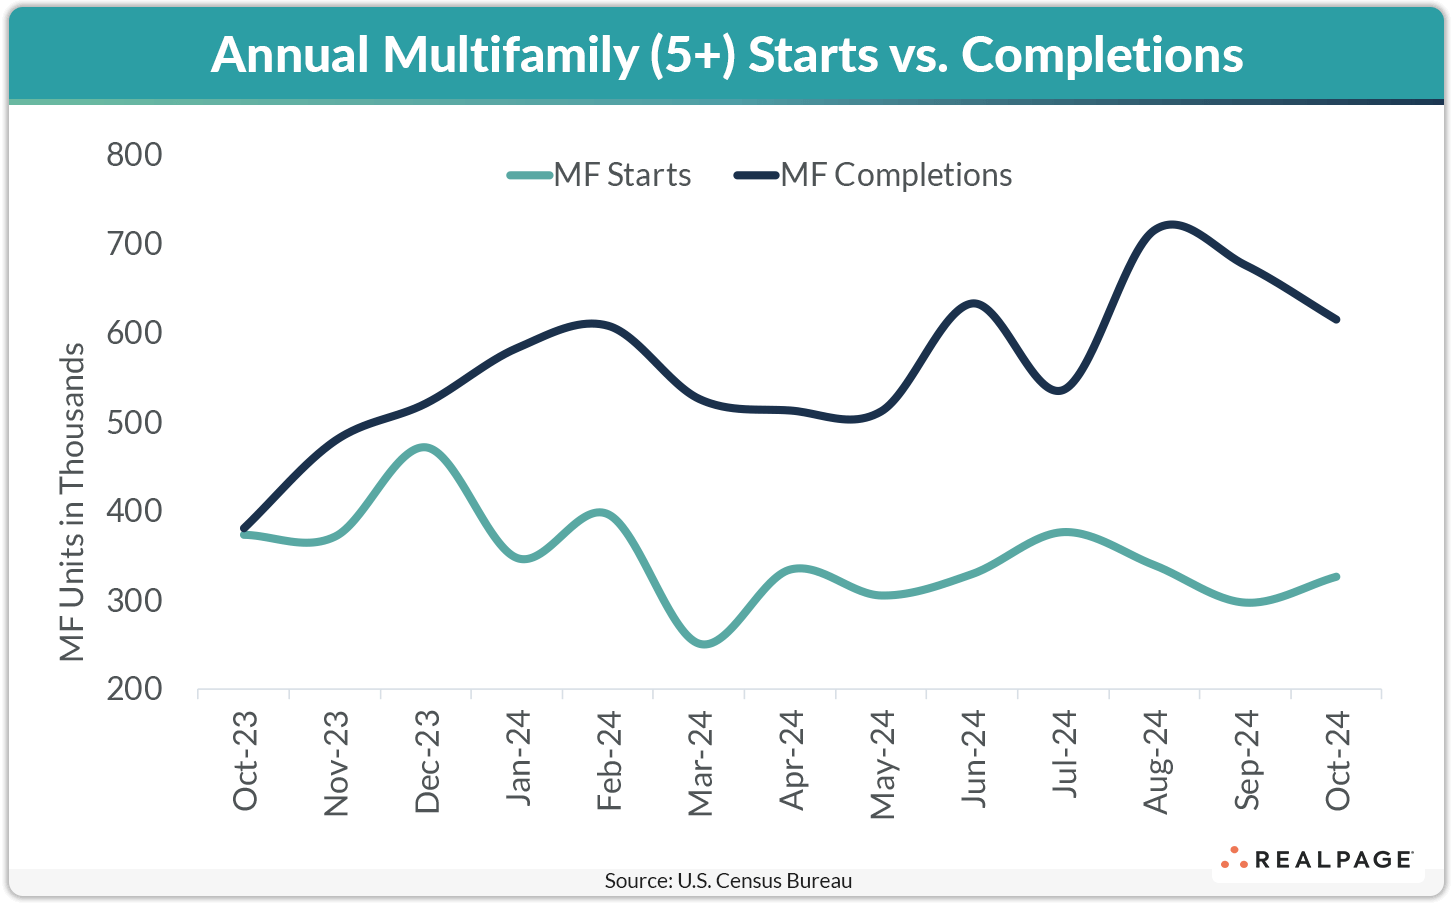
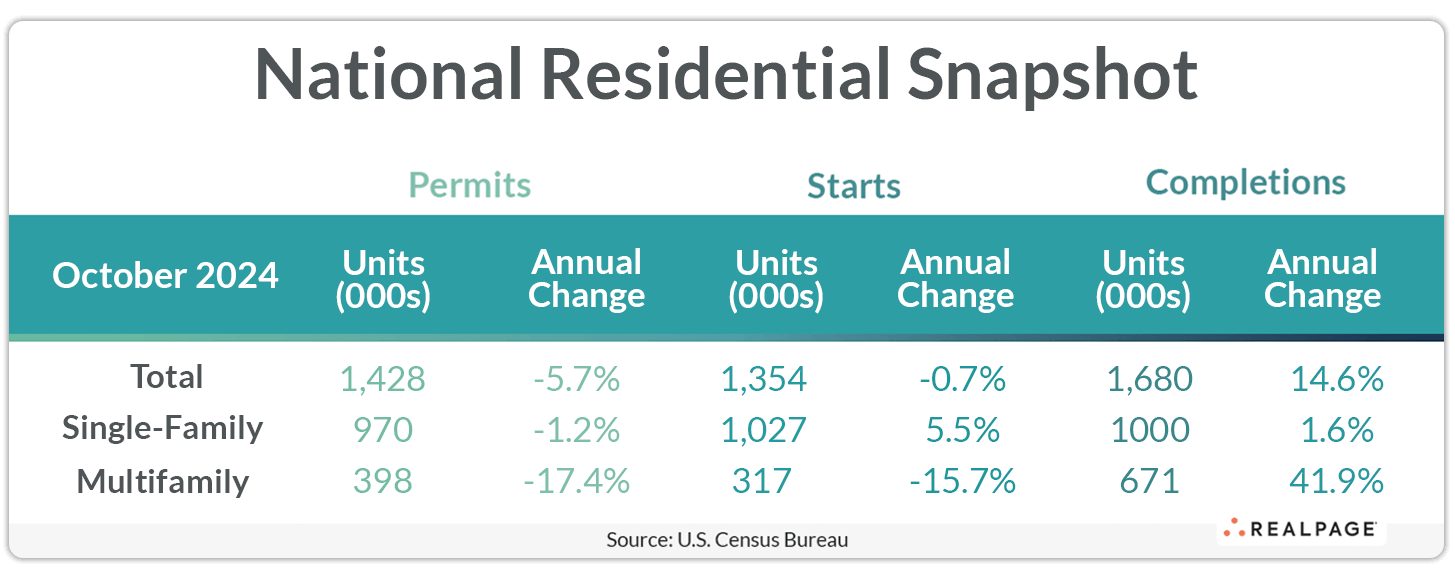
It is no secret that annualized multifamily starts have been declining rapidly as the current cresting wave of new supply subsides. But, in fact, the seasonally adjusted annual rate (SAAR) for multifamily completions in October (615,000 units) was nearly twice that of the annual rate for multifamily starts (326,000 units).
According to the latest report from the U.S. Census Bureau and the Department of Housing and Urban Development, annualized multifamily starts peaked for this cycle in late 2022, and with a roughly two-year construction timeline for most projects, completions should be hitting their peak period at around this time. Multifamily starts actually increased 9.8% from September’s annual rate but were down 12.6% from last October.
Feeding this decline is starts is a shrinking number of multifamily units permitted for construction. October’s SAAR for units in structures with five units or more (393,000 units) dipped 3% from last month and was 20.9% less than the annual rate from one year ago.
Meanwhile, single-family starts declined 6.9% from September and 0.5% from last October to 970,000 units. Together with the small two-to-four-unit category, total starts declined 3.1% from September to 1.311 million units and were down 4% year-over-year.
Single-family permitting was virtually unchanged from last month (+0.5% to 968,000 units) and down 1.8% from last year. Total residential permitting slipped 0.6% from September to 1.416 million units, down 7.7% from last October.
Multifamily completions dipped 9% from September to 615,000 units but are up more than 61% from last year. Single-family completions were down 1.4% for the month but unchanged for the year at 986,000 units. The SAAR for multifamily units under construction fell 3.5% for the month and 19.2% for the year to 804,000 units. The number of single-family units under construction was unchanged from September at 644,000 units but was down 3.6% from one year ago.
Compared to one year ago, the annual rate for multifamily permitting decreased in three of the four Census regions. The deepest decline in annualized multifamily permitting occurred in the South region (-28.2% to 178,000 units), while the Northeast region declined 22.2% to 63,000 units and the West region was down 19.3% to 100,000 units. The Midwest region was up 18.5% from one year ago with 51,000 units permitted. Compared to the previous month, permitting was down in the Midwest and South and up in the Northeast and West regions.
Annualized multifamily starts increased sharply in the small Northeast region (up 185.5% to 39,000 units from a subpar 14,000 units one year ago) and were up almost 10% in the West to 105,000 units. Meanwhile, starts were down in the South (-26.6% to 125,000 units) and in the Midwest (-39.4% to 56,000 units). Compared to September’s SAAR, starts were down in the Northeast and South, and up in the Midwest and West.
Metro-Level Multifamily Permitting
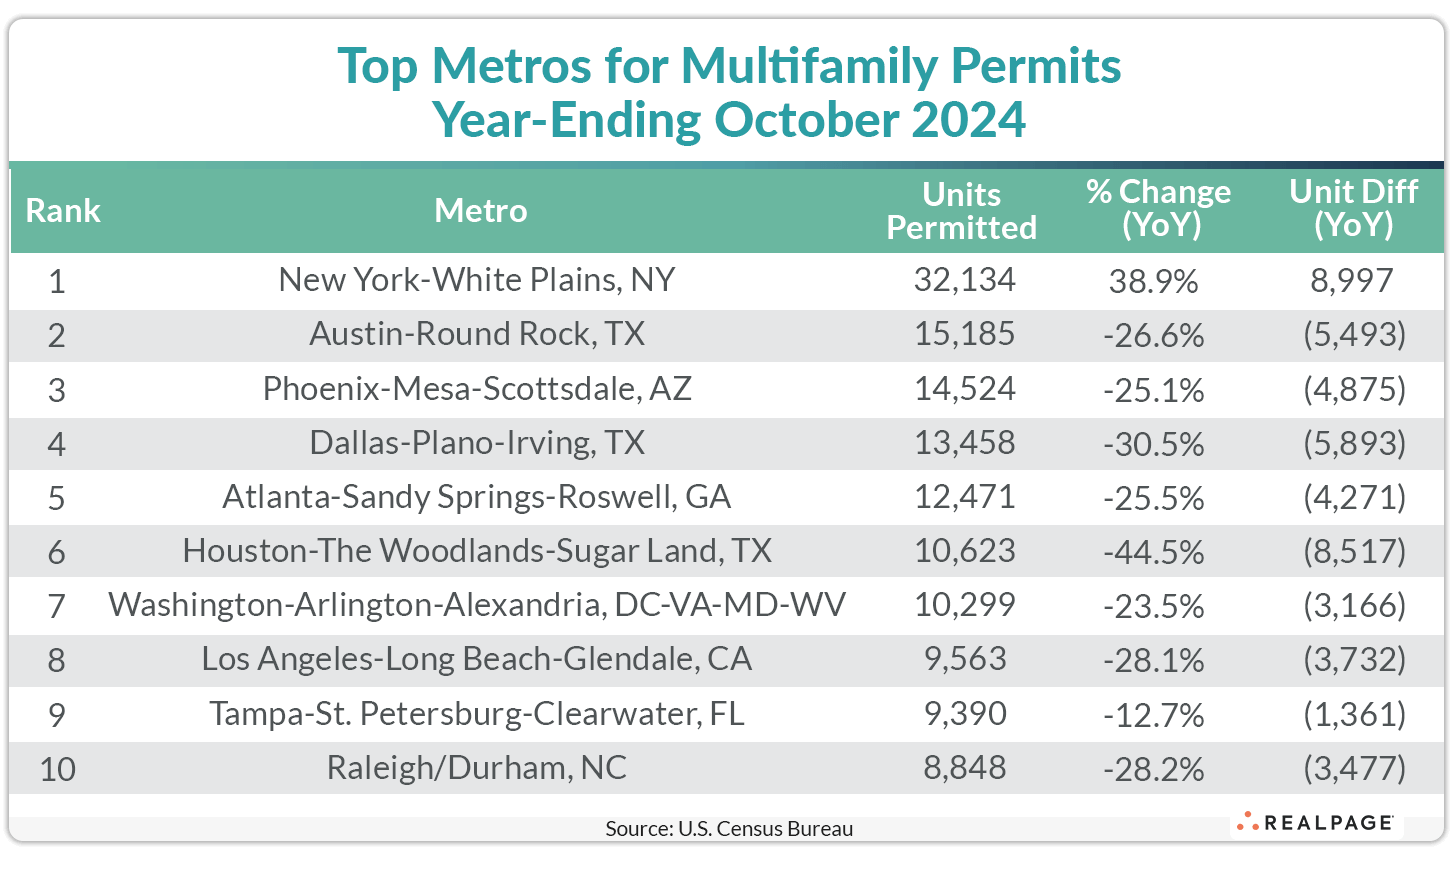
All the top 10 markets from September’s list returned in October with the first three remaining in order.
New York continued to lead the nation for multifamily permitting in the 12-months-ending in October with 32,134 units permitted. New York was also the only top 10 market to increase their annual permitting from the year before. Austin and Phoenix again followed New York with close to 15,000 units permitted but each were down more than 25% from last October, reflecting the national trend of declining multifamily permitting.
Dallas increased its annual permitting from last month to 13,458 units, moving it ahead of Atlanta with about 1,000 fewer units permitted than Dallas. The Houston metro also increased its multifamily permitting total compared to September, moving it to the #6 spot with 10,623 units permitted.
Washington, DC permitted about 10,300 units for the year, down 23.5% from last October, while Los Angeles was just behind with 9,563 units permitted, 3,732 units less than last year. Tampa and Raleigh/Durham also declined in permitting for the year but remained among the top 10 markets with 9,390 units and 8,848 units permitted, respectively.
Annual declines among the top 10 markets varied from 8,517 units in Houston to 1,361 units in Tampa with the remainder in the 3,000-to-6,000-unit range. Other markets with significant declines in multifamily permitting include San Antonio (-5,935 units), Minneapolis/St. Paul (-5,169 units), Riverside (-4,717 units), Jacksonville (-4,568 units) and Nashville (-4,197 units).
In addition to New York, other markets with significant year-over-year increases in annual multifamily permitting in the year-ending October were Kansas City (+2,545 units), Omaha (+2,154 units), Ashville, NC (+2,044 units) and Fort Worth (+2,024 units).
The annual total of multifamily permits issued in the top 10 metros – 136,495 – was about 19% less than the 137,167 issued in the previous 12 months and down 0.5% from last month. The total number of permits issued in the top 10 metros was almost equal to the number of permits issued for the #11 through #34 ranked metros.
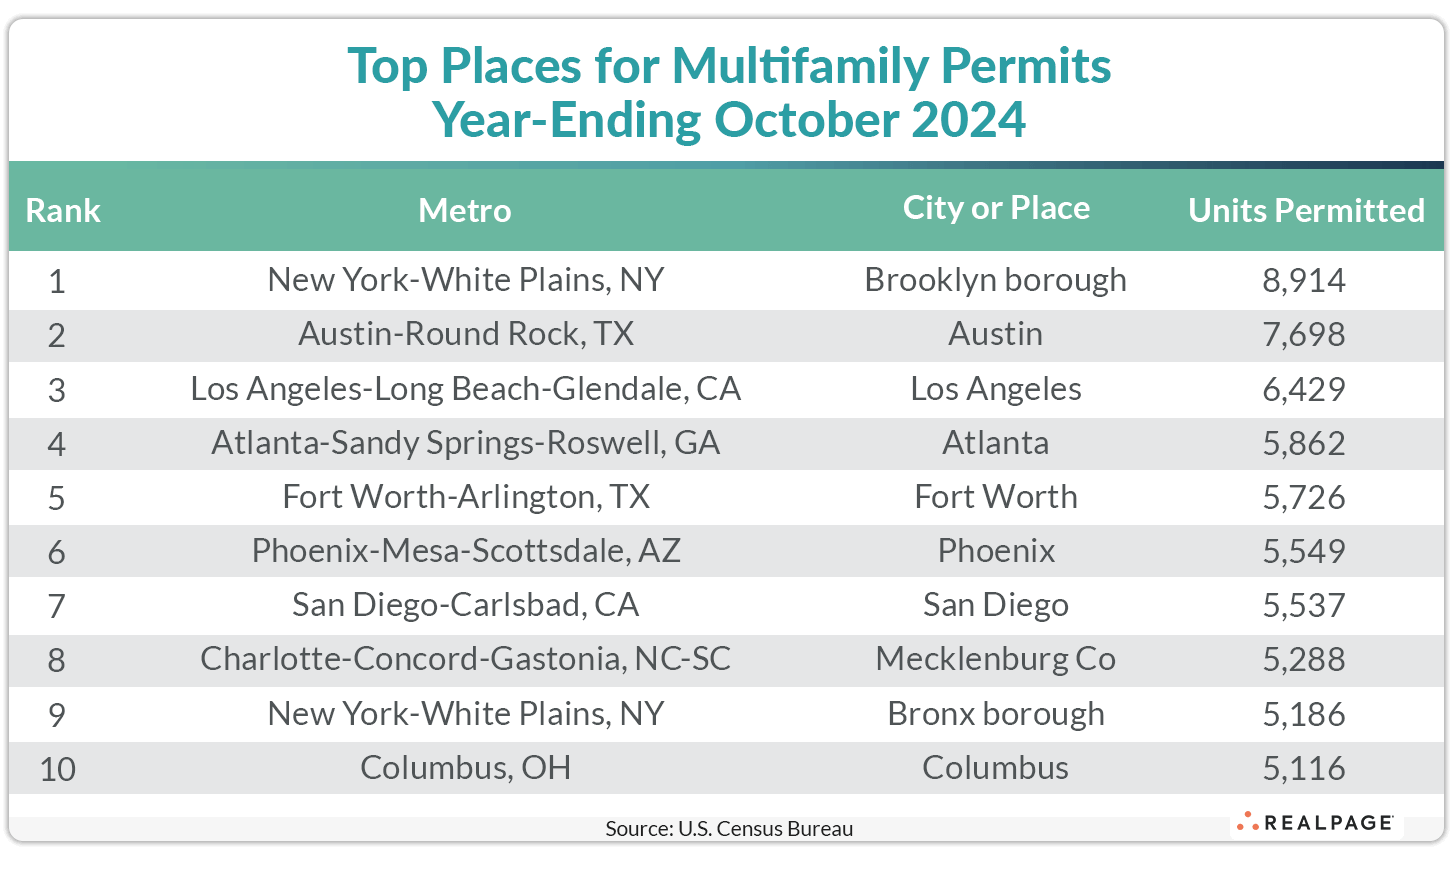
Below the metro level, eight of last month’s top 10 permit-issuing places returned to this month’s list with only the first three remaining in the same place. The list of top individual permitting places (cities, towns, boroughs, and unincorporated counties) generally includes the principal city of some of the most active metro areas.
The borough of Brooklyn and the cities of Austin and Los Angeles returned to the first three permitting spots in October, but like their metro areas, permitting increased in Brooklyn and declined in Austin and Los Angeles. The city of Atlanta moved up three spots this month but increased annual permitting by just 60 units to 5,862 units.
The city of Fort Worth remained in its previous spot but declined by 395 units from September’s total. The city of Phoenix also slowed its multifamily permitting (-734 units), while the city of San Diego increased by 279 units. Mecklenburg County (Charlotte) permitted 605 fewer units than last month’s annual total, down 11.4%.
The Bronx borough moved onto the top 10 list at #9 with 5,186 units permitted, a 340 unit increase from last month, and the city of Columbus made the top 10 with 5,116 units permitted, about even with last month.
While Texas still leads all states with six of the top 20 individual permitting places on October’s list, only two are in the top 10. New York state takes four spots in the top 20 with two in the top 10 and California’s two top 20 places are both in the top 10.


