Only Six of the Top 150 Apartment Markets Continue to See Occupancy Decline

In the midst of prime leasing season, only six of the nation’s largest U.S. apartment markets are still seeing occupancy constrict.
The U.S. overall saw occupancy tighten 140 basis points (bps) in the past year to stand at 95.6% as of June, according to data from RealPage Market Analytics. Most of the largest 150 apartment markets nationwide are also seeing occupancy improvement, with only six of the big 150 markets recording declines up to 100 bps in the year-ending June.
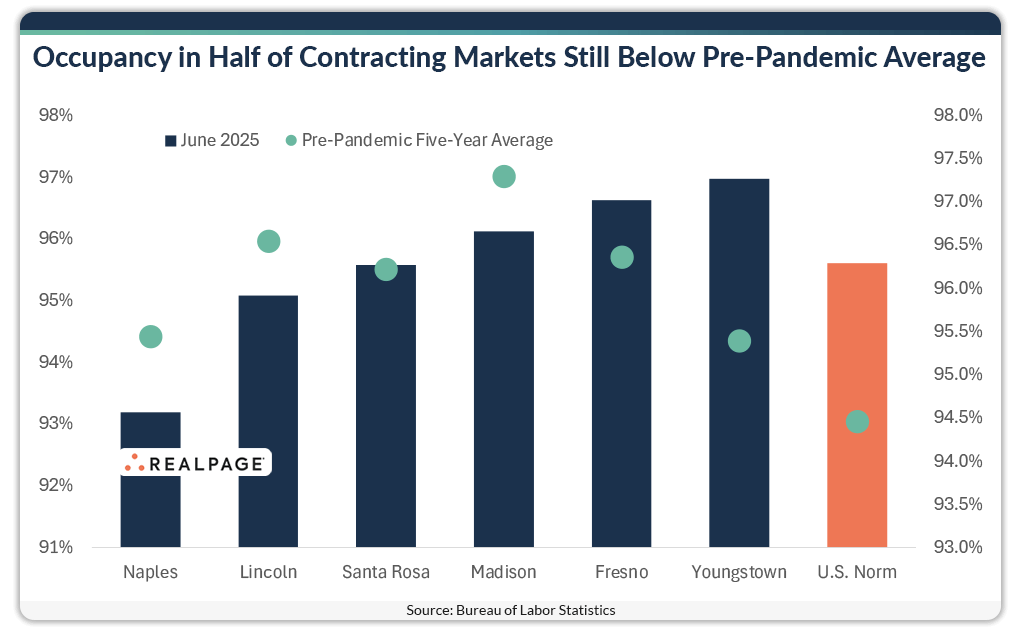
With continued decline, half of these markets are still seeing apartment occupancy rates hovering below pre-pandemic averages.

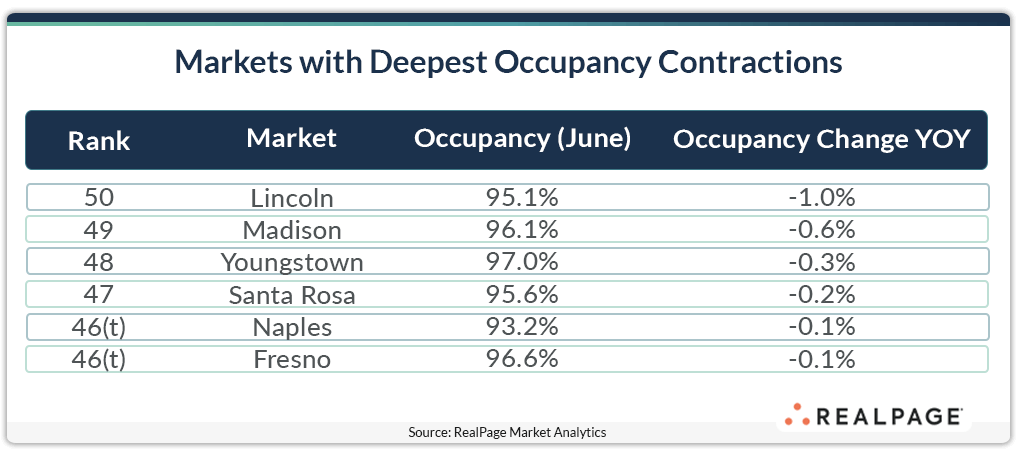
Lincoln realized the nation’s deepest apartment occupancy contraction in the past year. Occupancy in this small market with just over 36,100 units backtracked 100 bps year-over-year to 95.1%. That rate landed 150 bps below Lincoln’s pre-COVID five-year average (2015 to 2019) of 96.5%. It also fell 180 basis points below the average over the last five years (96.5%). Contributing to this decline was somewhat elevated supply levels. Demand for 876 units fell short of the 1,139 units delivered in Lincoln during the year-ending 2nd quarter 2025.
Madison, with nearly 81,000 existing units, ranked #149 for occupancy change in the year-ending June. Occupancy compressed 60 bps to 96.1%. That occupancy rate sat 120 basis points below Madison’s 2015 to 2019 average and 130 basis points below the five-year norm. While supply volumes have been a factor in Madison in recent years, supply has declined recently. In the year-ending 2nd quarter, only 1,815 units were delivered. That completion level fell about 18% below the same period last year. Meanwhile, absorption rebounded from negative territory experienced in 2024 in early 2025 and continued its positive trajectory in 2nd quarter with annual demand for 1,032 units, nearly in line with supply, a positive sign for the outlook of this market.
In Youngstown, an apartment market with just over 25,400 existing units, occupancy softened 30 bps in the past year to stand at a still solid 97% as of June. That occupancy rate outpaced the U.S. norm (95.6%) and was the tightest occupancy rate among the group of six markets still seeing rates contract. Although occupancy in June ranked above the pre-COVID five-year average from 2015 to 2019, it fell below the average over the last five years. In this tertiary market, supply and demand remained stagnant.
The remaining three markets recorded negligible contractions: Santa Rosa at #147 (-20 bps), and Naples (-10 bps) and Fresno (-10 bps) tied at #146.


