Job Data Revisions Shift Employment Picture for 2017

Job growth numbers may have been overstated in 2017, but revisions weren’t as sharp as in previous years.
That’s the takeaway from the latest data revisions by the Bureau of Labor Statistics (BLS). At the beginning of each year, the BLS releases revised job numbers for the previous year. This revised data contains additional information that was not available at the time of the initial release and provides a more accurate depiction of the jobs each metro gained or lost.
According to the new figures, the U.S. added 2.26 million jobs in 2017. That revised number is down by 28,000 positions, or 1.2%, from the initial figure.
However, adjustments were more significant in some metro areas – especially those in which the initial data was overstated.
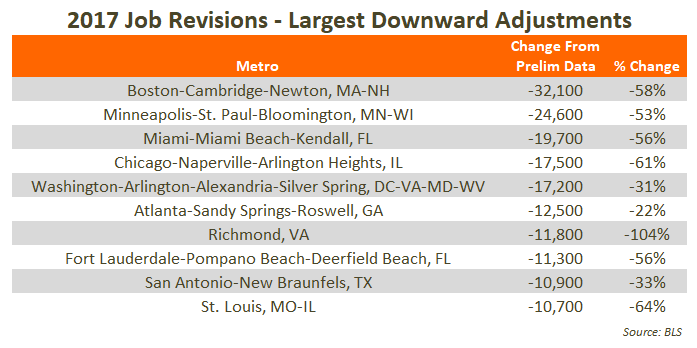
The most drastic downward revision registered in Boston. Initial data from the BLS put job growth in Boston at 55,800 jobs in 2017, positioning the metro among the nation’s leaders for annual employment gains. But revised figures indicate that number was overstated by 32,100 jobs. The downward revision of 58% leaves annual job growth in Boston at 23,700 positions, knocking the metro down to the #20 spot for employment change in the U.S. during 2017.
Also claiming a spot among national job growth leaders in the initial data was Minneapolis, where the BLS reported gains of 46,700 jobs. Revisions cut that total essentially in half, revealing the metro actually gained 22,100 jobs in 2017, ranking the metro at #27 in the nation.

Miami, Chicago and the Washington, DC area saw downward revisions near the 20,000-job mark. The nation’s capital generally ranks among the country’s leaders in job production and initially it was reported at #5 in the nation with 55,000 new positions. But the revisions pushed DC to #11 with the gain of 37,800 jobs.
Atlanta registered a descending adjustment of 12,500 jobs. While down 22% from the original estimate, Atlanta’s revised employment growth of 43,100 jobs allowed the metro to hold onto its standing among the country’s job growth leaders in 2017.
When initial data was released, BLS figures showed Richmond with a gain of 11,300 jobs. Revised figures reveal the metro actually lost 500 jobs in 2017. Meanwhile, downward adjustments around the 11,000-job mark registered in San Antonio and St. Louis.
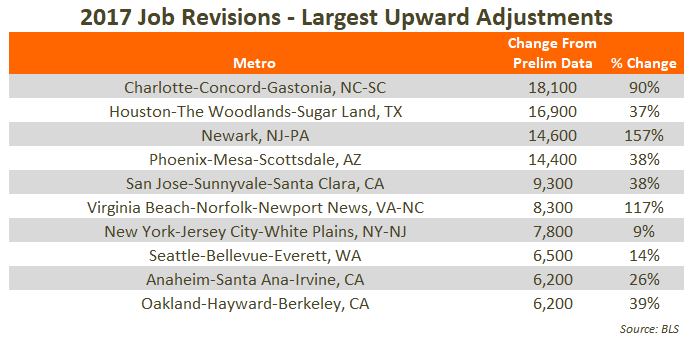
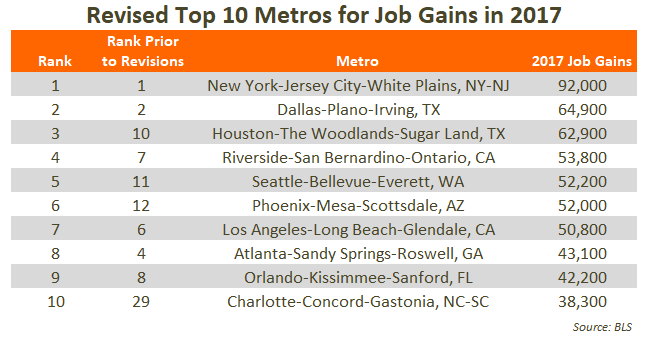
In contrast, the revised figures show some regions of the country actually gained more jobs than originally reported. The most dramatic of these upward adjustments was seen in Charlotte, where new figures put employment growth at 38,300 positions, 18,100 more jobs than previously estimated. This new job gain figure placed the metro in the #10 spot among national job growth leaders in 2017.
Meanwhile, Houston moved from #10 up to #3 on the country’s leader board, with 16,900 more jobs than originally estimated. Revised figures show the metro gained 62,900 jobs in 2017, a 37% increase over the preliminary figure.
BLS revisions show adjustments of just over 14,000 jobs in Newark and Phoenix. In Newark, the original data estimated an annual job loss of 9,300 jobs. The revised figures show the metro actually gained 5,300 positions in 2017. Phoenix is now estimated to have gained 52,000 jobs last year, 38% more than the original data, which earned the metro a spot among national job growth leaders, at #6 in the country in 2017.

Upward adjustments of about 8,000 to 9,000 positions registered in San Jose, Virginia Beach and New York. While the 9% revision in New York was mild, the metro held onto its position as the country’s #1 employer, far outperforming every other metro in the U.S. in 2017, with a gain of 92,000 jobs.
Recording revisions between 6,200 and 6,500 jobs were Seattle, Orange County and Oakland. This 14% adjustment in Seattle takes the metro from #11 in the nation to #5, as the new data indicates the metro created 52,200 positions in 2017.

While these new figures alter the perceived economic conditions in certain metros, the revisions are far smaller than in previous years, when it wasn’t unusual to see revisions closer to the 100,000-job mark in some large metros.


