Class A Occupancy Recovers, Though Still Trails B and C Assets

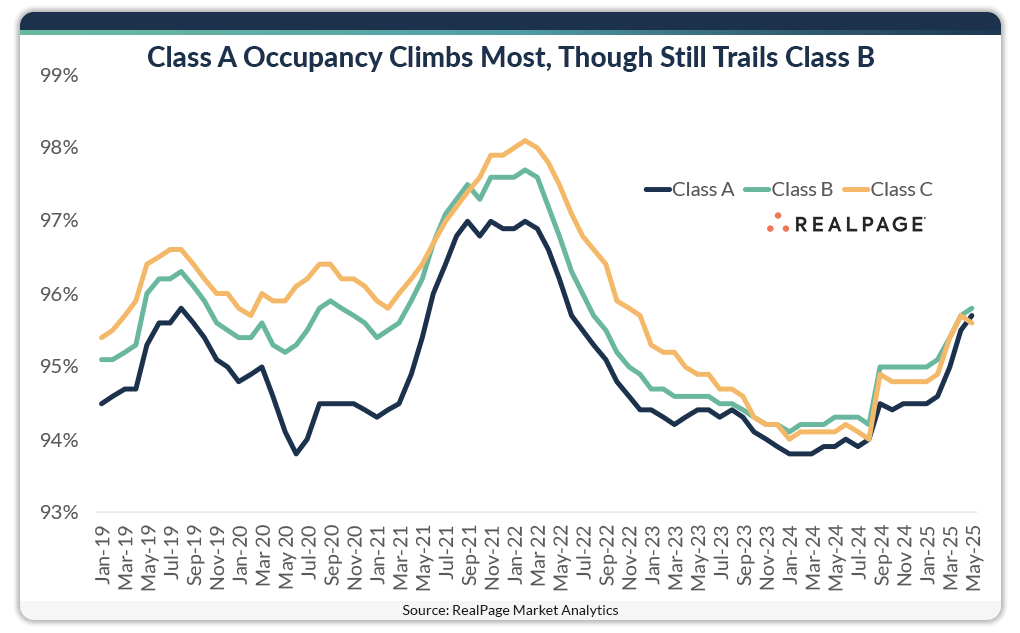
Further proving that the U.S. apartment market has captured outsized demand, occupancy has trended up across the price spectrum over the last year or so. Class A, B and C units all reported year-over-year occupancy gains in May, with the highest growth seen in the priciest asset class.
Occupancy in stabilized Class A apartments hit 95.7% in May, the highest rate seen since June 2022, according to data from RealPage Market Analytics. That reading ranked a hair below that of Class B occupancy (95.8%) and a hair above the Class C rate (95.6%). That Class A reading also marked the highest annual gain across the price spectrum. Year-over-year, Class A occupancy climbed 170 basis points (bps), compared to a climb of 150 bps in Class B and 140 bps in C units.
In the years leading up to the global pandemic, it was typical for Class C units to be the most occupied, followed closely by Class B units and trailed by Class A units. The pre-COVID five-year average occupancy across product classes reflects this. From 2015-2019, Class A units averaged the lowest occupancy (94.7%) with tighter rates in Class B (95.3%) and C (95.4%) units.
Since late 2023, however, Class B units have consistently claimed the fullest occupancy, as is the case today, with Class C units following closely behind. Class A units, which are the most sensitive to competition from new product in lease-up as well as resident turnover due to home purchase, have labored under supply pressure throughout the last couple years to generally stand below average. Until recently, that is. Occupancy across all product classes registered above their pre-pandemic five-year norms as of May.


