Does Dallas’ Multifamily Permitting Signal the Next Supply Wave?

Although multifamily permitting was down nationally in July, several markets are still ramping up housing production.
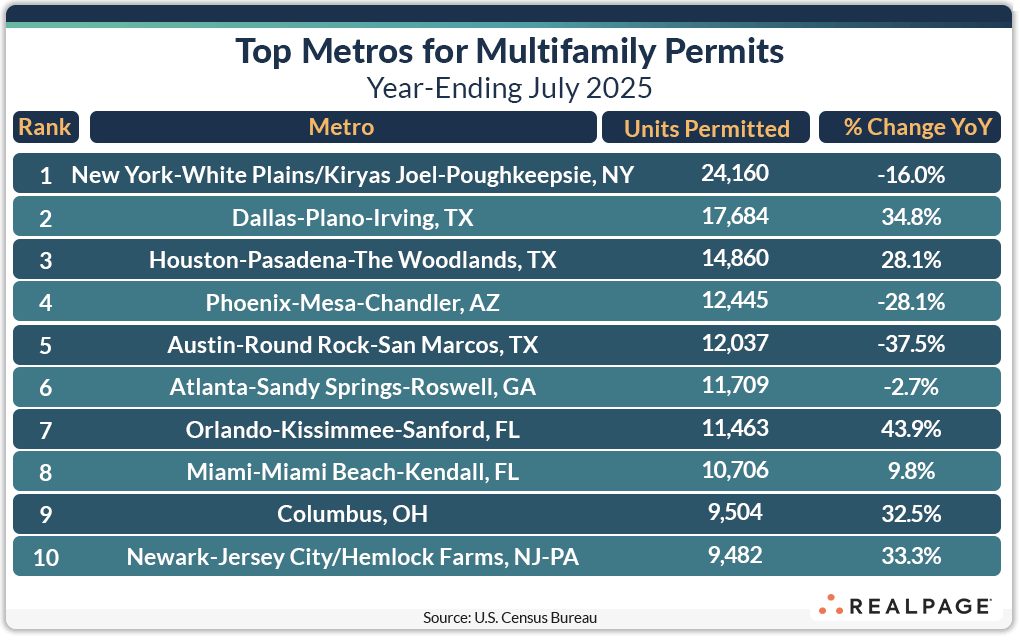
Six of this month’s top 10 markets for multifamily permitting increased their annual total of units permitted compared to last year. Five of those were greater by more than 2,300 units each.
The top 10 market with the largest increase in multifamily permitting in units from last year was Dallas, up 4,566 units from last July to 17,684 units permitted. Despite slowing employment growth, Dallas has seen its annual permitting increase each month from a low of about 12,600 units in November 2024.
Dallas has led the nation for apartment completions since mid-2024 and has perennially been a top market for new construction throughout the years. As the current wave of completions slows, it appears Dallas is on its way to a resurgence as the next supply cycle may be on the rise. Granted, the Census Bureau’s 5+ multifamily permitting totals include more than market rate, conventional apartments, but the trend is apparent.

Orlando and Houston were also up significantly from last year and permitting activity is up by about 33% in Columbus, OH and Newark.
All of last month’s top 10 permitting markets returned to July’s list with the first three in order.
Despite leading the nation, New York saw a significant decrease in annual permitting, as did Phoenix and Austin. Atlanta and Miami had modest changes in annual multifamily permitting but remain among the top 10 as well.
The sum of permitted units for July’s top 10 of 134,050 units is virtually the same as one year ago and up 1.5% from June’s sum.
In addition to Dallas, Orlando, Houston, Newark and Columbus, markets with significant year-over-year increases in multifamily permitting include Chicago (+2,489 units), Detroit (+1,940 units), Bridgeport-Stamford-Danbury, CT (+1,902 units), Fayetteville-Springdale-Rogers, AR (+1,761 units) and Savannah, GA (+1,300 units).
After Austin, Phoenix and New York, markets with significant decreases in annual multifamily permitting in the year-ending July were Washington, DC (-3,621 units), Tampa (-3,290 units), Los Angeles (-2,796 units), Greensboro-High Point/Winston-Salem/Burlington, NC (-2,388 units), San Jose (-1,952 units) and Seattle (-1,866 units). Nine other markets had decreases of 1,000 units or more.
Permitting by Place
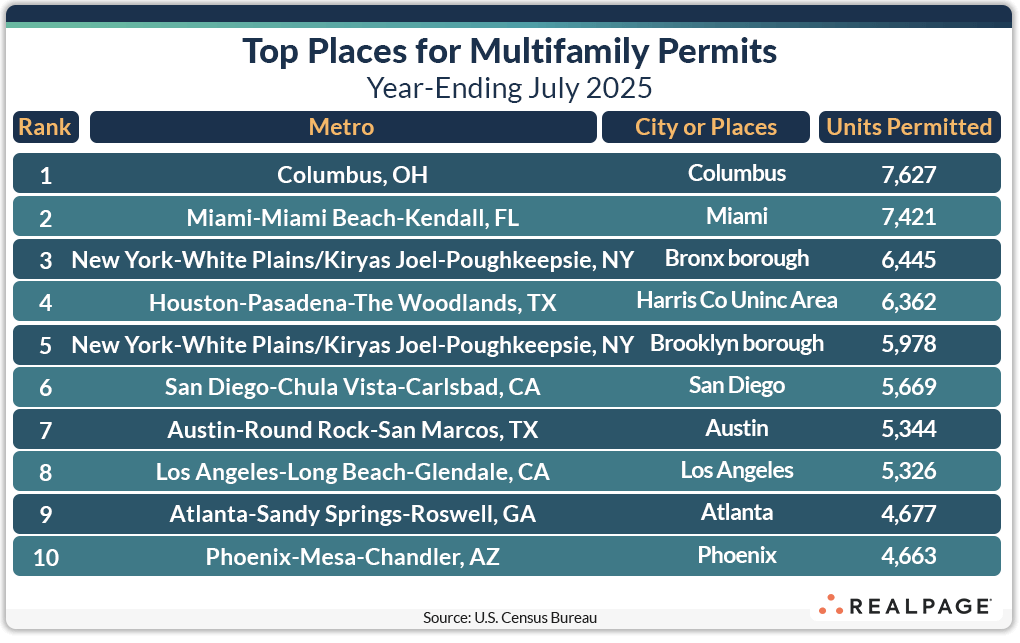
Below the metro level, all but one of last month’s top 10 permit-issuing places returned to this month’s list with only one remaining in the same place. The list of top individual permitting places (cities, towns, boroughs and unincorporated counties) generally include the principal city of some of the most active metro areas.

The city of Columbus moved into the #1 spot in July with more than 7,600 units permitted, an increase of almost 700 units from June’s total. The city of Miami was close behind with more than 7,400 units permitted. The boroughs of The Bronx and Brooklyn made the top five while Unincorporated Harris County remained in the #4 spot.
The cities of San Diego, Austin, Los Angeles and Atlanta also returned to the top permitting places list this month, while the city of Phoenix displaced Charlotte’s Mecklenburg County at the #10 spot.
Only four of this month’s top permitting places had fewer units permitted for the year than last month, with an average decrease of about 650 units. Conversely, the six other top 10 places averaged an increase of about 350 units.
Texas’ top permitting places continued to slide with only the city of Austin among the top 10 (although down two spots from June). Travis County (Austin) and the cities of Houston, Fort Worth and Dallas each moved down a spot or two among the top 20 permitting places. However, the cities of Frisco, Denton, Carrollton and McKinney – all northern Dallas suburbs – were among the next 50 top places, accounting for the rise in the Dallas metro’s permitting.
This post is part of a series by RealPage Senior Real Estate Economist Chuck Ehmann analyzing residential permits and starts data from the U.S. Census Bureau. For more on this data, read previous posts in the Permits series.


