Despite seeing competition from record completion volumes, Austin’s Class A apartments are not struggling.
Austin received roughly 26,800 new units over the past 12 months, growing existing inventory by 8.5%, according to data from RealPage Market Analytics. That completion volume was just shy of 1st quarter’s record high annual figure of 30,964 units.
With such a massive volume of new units, it’s unsurprising that Austin occupancy registered at 93.9% in 2nd quarter, marking the 11th consecutive quarter below 95%, commonly referred to as the effectively full occupancy rate. However, occupancy is actually up year-over-year, as strong demand rose up to meet record supply volumes recently.
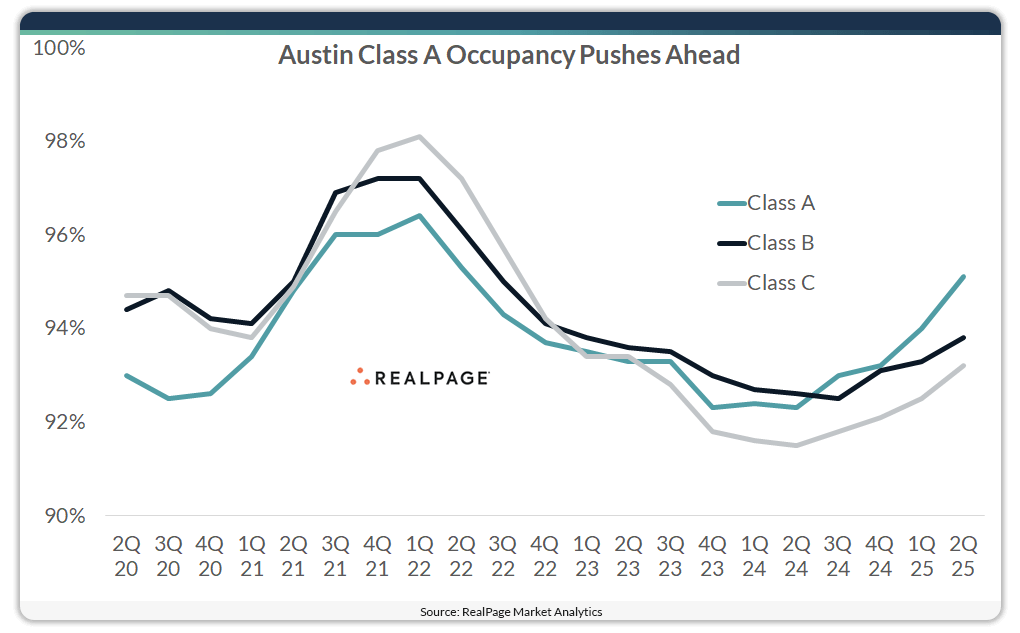
In fact, breaking that down by product class, we see that Austin’s top-tier, stabilized Class A units did reach that effectively full level (95.1%) in 2nd quarter. That was a 270-basis point (bps) gain year-over-year and the first reading over 95% in Austin’s Class A units since mid-2022.
Just a few years ago, Austin’s Class A stock was trailing other product lines in occupancy performance. As of 2nd quarter 2025, however, Class A stock was the only product class in Austin to register 95% or higher occupancy. The progress in Class B product was softer, rising 130 bps year-over-year to 93.8%, with Class C performing similarly with a 180-bps gain to 93.2%.
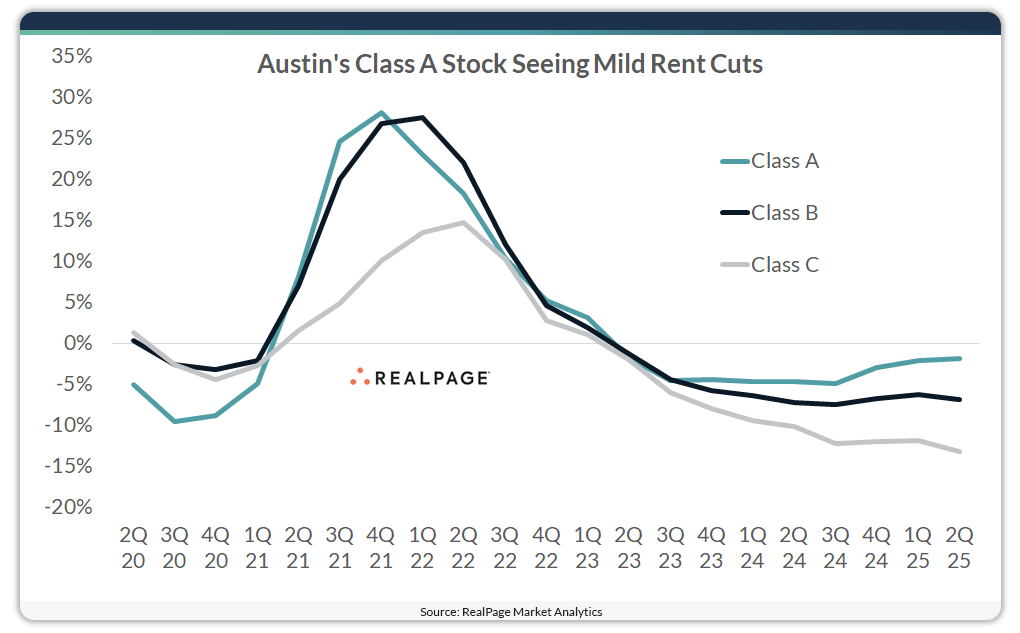
So, it would appear that Class A product is “pulling up” renters from Class B and C units. However, Class A stock is not sacrificing rents to do that. While all product lines in Austin are logging rent cuts, the decline in Class A stock is the most mild. Prices were cut by just 1.8% in the year-ending 2nd quarter in the most expensive units, while cuts were deeper in the Class B (-6.8%) and Class C (-13.2%) product.
With so much competition from new deliveries, one might expect concession usage to be higher in top tier Class A relative to the more affordable Class B and C units, but that is also not the case. While 30.5% of Class A units offered concessions in 2nd quarter, that figure rose to 33.9% in Class B and 56.7% in Class C, meaning Class A units were the least likely to offer concessions. Further, the Class A concession amount of 7.2% was also the lowest, with Class B (8%) and Class C (9.2%) product offering larger discounts.
Adding further complexity to this pricing and occupancy performance is the fact that average effective asking rents in Class A product ($2,034) remain nearly double that of Class C units ($1,205), with Class B rents ($1,393) landing just about 15% higher than Class C product.
Although the driving factors influencing these pricing trends are complex, wages and personal incomes well above the U.S. norm alongside explosive population growth are major factors. The metro’s population grew by 10.9% between 2020 and 2024, according to the latest estimates from the U.S. Census Bureau. That was the strongest showing among the nation’s largest markets.
Additionally, lack of single-family housing stock as well as affordability challenges are likely pushing would-be home buyers into the Class A apartment space. As the Texas A&M Real Estate Center reports, “Austin’s home prices have increased rapidly over the last few years. In 2019, the reported average sales price of a home was $393,138. By 2021, that number had risen to $564,974, a 44 percent overall increase and a 20 percent average annualized rate of price increases.” While home prices have faded more recently, they remain notably elevated compared to pre-COVID norms.
Looking ahead, the Austin-Round Rock-San Marcos metro’s strong demand drivers are expected to remain intact for the foreseeable future, with market occupancy continuing to tighten and annual effective rent change returning to growth in mid-2026.
For more information on the state of apartment markets across Texas, including forecasts, watch the webcast Market Intelligence: Q3 Texas Update.


