Through the Lens: A Look at Apartment Rents, Home Prices and Incomes in Real Terms


Strong performance in the multifamily sector of late has raised some concerns about affordability. The concerns are very much centered on trends over the last four years, as annual same-store effective rent change for the top 50 U.S. metros has outpaced the rate of inflation for 17 consecutive quarters. And in 3rd quarter 2014, annual effective rent change for the top 50 metros came in at a two-year high of 3.7%, more than twice the reported annual rate of inflation.
However, before sounding the alarm, it’s useful to look at apartment rent growth with a zoomed-out lens – viewing rent growth relative to inflation, wage growth and single-family price growth over multiple cycles. This zoomed-out view paints a very different (and perhaps surprising) picture. It shows that even post-housing bust, single-family appreciation has far outpaced apartment rent growth since 2002. It shows that apartment rents, adjusted for inflation, are basically equal to 2002 levels. And it shows that the real problem is that wage growth hasn’t kept up with inflation, especially since the recession.
The chart below compares monthly apartment rents and home prices alongside incomes. The blue line shows the median home price among the top 50 metros (excluding New York), while the red line reflects average monthly apartment rents in those metros. The green line shows average median household income levels for those metros. All of three of those metrics are adjusted for inflation and indexed to 1st quarter 2002 levels.
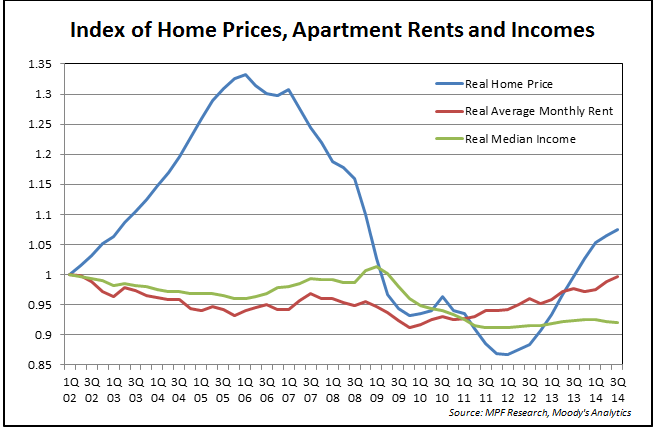
Among the top 50 metros, inflation-adjusted median home prices as of 3rd quarter 2014 have increased almost 8% above 1st quarter 2002 levels. Meanwhile, average monthly apartment rents are just now reaching 1st quarter 2002 levels in real terms. However, home prices, apartment rents and inflation have all outpaced income growth – highlighting the real problem. In fact, inflation-adjusted median incomes are now about 8% below levels seen in 1st quarter 2002.
Disparities among housing costs and incomes aren’t equal across metros, however. Real median home price has outpaced income change in all but 10 of the top 50 metros, while apartment rents have outpaced incomes in all but 12. The home price-to-income gap has widened the most in the coastal markets — predominantly in the West region, with Orange County leading the way — that have experienced a great deal of institutional and foreign investment. Likewise, the apartment rent-to-income gap was widened most in San Francisco and many of the same West Coast metros experiencing steep appreciation in home values.
However, a true comparison of homeownership and renter affordability is not as straight forward as many might surmise. The cost of homeownership varies greatly across cities and financial characteristics of each specific individual. Meanwhile, average apartment rents are somewhat skewed by the large number of high-priced, urban core units that have been so popular in the latest cycle. This is why you tend to see highly divergent conclusions from different rent-or-buy comparison studies.
But the broader point holds: Apartment rent growth has merely matched up with inflation since 2002. The real challenge is that incomes aren’t keeping up with inflation. If that trend continues, rent growth potential could become more limited in many spots – particularly for mid-market product that has produced especially large rent hikes of late.
(Image Source: Shutterstock)