National Permit Volumes Surpass 400K Units in February


Annual multifamily permitting activity surpassed the 400,000-unit mark in the latest national authorizations data, while most top metros for annual permit volumes saw increases in February.
Local governments across the country approved 401,533 units in the year-ending February 2018, according to Census data. That permitting activity, inclusive of the 26,741 units authorized during the month of February, represents a 0.7% increase from January 2018’s annual volume and a 2.3% increase from February 2017’s annual total.
By comparison, annual permit volumes have run slightly below 400,000 units in most months since December 2016. Those numbers represent a deceleration from June 2015 through November 2016, when annual totals regularly topped 400,000 units. Annual permit volumes averaged roughly 430,000 units over that time.
On the metro-level leaderboard for annual activity in February 2018, nine of the top 10 permitting metros remained the same as they did in the previous month, with the first five remaining in order. Phoenix improved one spot from No. 11 to round out the top 10, switching places with Boston from last month.
Meanwhile, eight of the top 10 markets experienced increases in annual multifamily permitting from the same 12 months one year ago. But perennial top performer Dallas is showing signs of slowing. With a decrease of 5.3% from the 12 months ending February 2017, Dallas was the largest metro on the leaderboard with a significant decline. The metro has dropped almost 20% below the pace of two years ago. However, overall permitting levels remain well above the market’s historical norm.
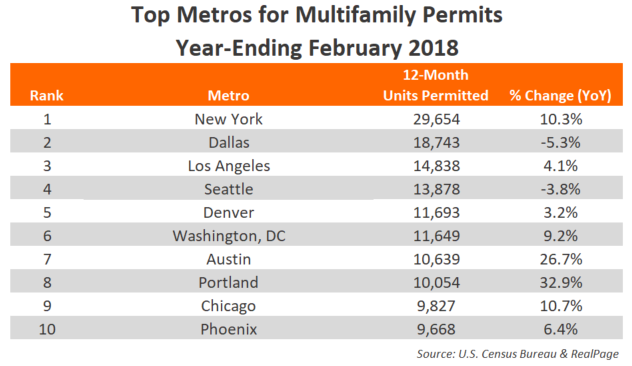
With the majority of the top 10 markets reporting at least some increase in annual multifamily permits, the annual total of multifamily permits issued in the top 10 metros – 140,643 – was 7.1% greater than the 131,275 issued in the previous 12 months. The total number of permits issued in the top 10 metros was almost equal to the number of permits issued within the #11 through #37 ranked metros.
For the month of February, the standings experienced a notable reshuffling, with half of the top contenders replaced from the previous month. New York again retained its leading position, while Washington, DC entered the list at a strong-but-distant #2. Permitting more than 1,500 units, the Washington, DC metro recorded the leaderboard’s greatest year-over-year change.
Meanwhile, the leaderboard’s significantly lower barrier to entry meant some metros – namely, Austin and Denver – rose several spots, despite essentially flat or lessened permitting volumes from January 2018 figures.
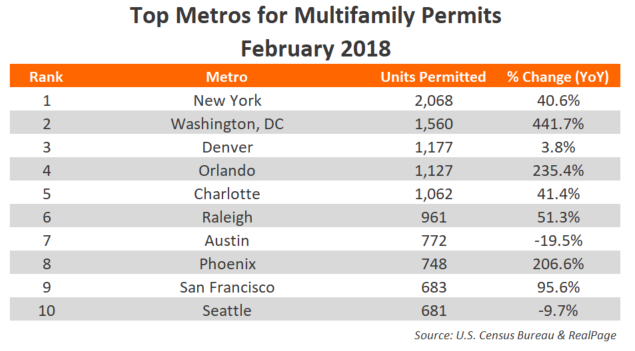
The introduction of Orlando, Raleigh, San Francisco, Seattle and Washington, DC pushed Atlanta, Boston, Fort Worth, Los Angeles and Miami from the standings.