Elevated Supply Volumes Common in Markets with Largest Occupancy Declines


In 3rd quarter 2017, 48 of the nation’s top 50 metros recorded occupancy rates below the year-earlier level. While most of these markets remain essentially full with occupancy levels above the historical norm, the collective dip demands a closer look. Among the 10 major markets that registered the steepest annual declines, most received more supply in the past year than they could absorb. A handful of others saw net move-outs.
In Nashville, the high-supply narrative rings true. Nashville ranked #1 for the sharpest negative occupancy change in the year-ending 3rd quarter 2017. The development-heavy metro saw occupancy drop 3.0 percentage points to land at a seven-year low of 93.4%. While the market logged strong demand for nearly 5,880 units annually, deliveries for the 12-month period breached 10,500 units to expand inventory a whopping 8.0%. That was the largest completion volume since MPF Research began tracking the market. Despite sluggish rent growth – 1.1% in the year-ending 3rd quarter 2017 – developer interest in the urban core and high-end suburbs remains high. Across the metro, 8,547 under-construction units are set to grow inventory another 6.1%.
In #2 Salt Lake City, a similar supply story is playing out. The annual completion volume of 6,430 units, the highest in more than two decades, was nearly double the annual absorption volume in 3rd quarter 2017. The 7,883 units currently under construction are scheduled to expand metro stock 6.1%. Occupancy, though, was tighter than that of Nashville, at 95.3% in 3rd quarter 2017, down 2.1 points year-over-year. Despite elevated development, the market has registered a series of strong performances. Population and employment growth helped drive annual rent growth of 3.8% in 3rd quarter 2017.
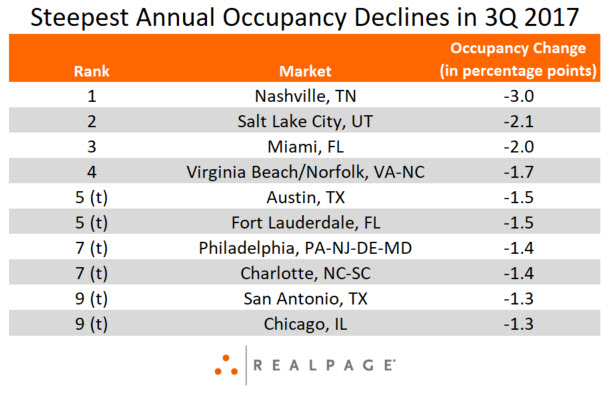
Meanwhile, net move-outs contributed to Miami’s annual occupancy decline of 2.0 percentage points. While the metro received nearly 5,000 units, the occupied unit count fell by more than 1,250 during the 12-month period ending in 3rd quarter 2017. Five of Miami’s nine submarkets logged negative absorption, with Coral Gables/South Miami and Northeast Miami taking the biggest hits. Still, supported by strong demand drivers, occupancy in Miami remains healthy at 96.2%.
Philadelphia and Chicago were the only other markets on the list to record negative demand over the past year.
Meanwhile, Austin’s occupancy decline of 1.5 percentage points came as the metro continued to endure a four-year supply wave. Occupancy in the Texas capital metro has remained below 95% over the past year, and rent growth has essentially evaporated. Still, a reprieve from building activity doesn’t appear likely anytime soon. More than 11,500 units set to deliver in the next year will expand Austin’s inventory 5.0%.